
Welcome to the new Traders Laboratory! Please bear with us as we finish the migration over the next few days. If you find any issues, want to leave feedback, get in touch with us, or offer suggestions please post to the Support forum here.

tomerok
-
Content Count
110 -
Joined
-
Last visited
Posts posted by tomerok
-
-
BearBull
What is the time frame in the charts?
20 changes?...
Tomer.
-
Hi
Today's summary
Trade 1 - played the hinge at the open, PA was clear, had the patience to wait for a pullback and exited just as TL broke
Trade 2 – a reversal setup by my rules + no LOD, followed my rules and was happy.
Then price headed down that’s when I noticed the TL (down) from the open, I was patient because of the news and waited for confirmation either up or down because of the downward TL.
I totally missed the bigger upward TL from yesterday (drew it only after the rally up to 2821, I was looking for something to explain it)
While price rallied up I was waiting for a pullback or a reversal
Trade 3 - when price pulled back after breaching 2821 i went long not realizing that price reversed a tick before HOD, I should have notice that and paid the price.
Trade 4 – a small hinge was formed, price was slow moving and I practiced patience till price broke down with speed after a pullback, I was late on the entry…, once I noticed no LL was formed + slow PA I decided to exit with a loss
Trade 5 – again a strong thrust down, I was late and waited for a pullback which arrived, when I entered short price froze again and started drifting sideways creating tiny HL, decided to ditch the trade because of the close TL (which I polity disregarded when entering the trade in the first place)
Generally I felt better than the last 2 days, PA was much clearer for me, I managed to follow my rules and be in control over impulse (though I slipped a couple of times).
Tomer
04_10_2012-trades.thumb.jpg.8ab512d1027b28b6233f18442d10b30b.jpg)
-
HOD = High of day
But still S is Strong..
-
mind there was no HOD...
-
04.10.2012
Good Morning.
34 range – R @ 2807-2808 breached yesterday, R @ 2821 tested twice after a nice pullback (all this in pre-session today), overall there is an uptrend from the S @ 2778
21, 13 range – pre-session test of R, pullback and re-test are more clear, notice the LH…. and no major HH
144 Tick - a hinge is forming
Areas of interest
R @ 2821
Will try to play the hinge at the open.
If I notice LH and break of the pre-session TL I will be looking for shorts (taking into account the previous R we broke yesterday as a potential S)
If I notice HH and pre-session TL holds I will look for long (no visible R up to 2853 area)
I'll try to keep it simple and really avoid the R @ 2821 area today
Tomer.
04_10_2012.thumb.jpg.917a6fdfaaf9d967efc8d4c9bb1ef706.jpg)
04_10_2012.thumb.jpg.6ab47e1c23eb467bd74ec68b89c1515a.jpg)
04_10_2012.thumb.jpg.2a3b18cbfe528c1832d803748499e7cc.jpg)
04_10_2012.thumb.jpg.b66fa5fba786d21ffdeb86f07f0d65a0.jpg)
-
Hi
Second bad day in a row i would like to share with you guys.
left the TL as i drew them in RT, white circles for stops, blue for targets, red short, green long.
Trade 1 – short, at the time I thought it's a reversal trade according to my rules, the little dip below the last swing high tricked me, in hindsight it was not even close to comply with my reversal rules… I was too quick on the trigger, stopped.
Trade 2 – price went up past the last high and tested the HOD, again I was impulsive and did not wait for a pullback, stopped.
Trade 3 – was according to reversal my rules and the resistance ahead and failure to even test the HOD gave more confidence shorting it, trend line broke and I was not happy with the speed of the pullback so I got out.
Trade 4 – price failed to LL, and bounced back up pretty fast, later on got back down below the S that triggered my long, and stopped me out.
Trade 5 – support was tested a bit and price went up (news), once my TL got breached I lost confidence and decided to bail out.
Trade 6 – I tried long again thinking it a pullback and got stopped
Trade 7 – after the drop I noticed a lot of buyers, thinking that we hit again the bottom of the narrow trading range, got long, price was slow moving, and past failed trades got me pulling out with a loss
I missed the whole ride up since my nerves were shaken from all the failed trades, I was waiting for a clear reversal
Trade 8 – even though price was slow moving decided to short because of the clear R, waited for a pullback and entered, TL tested and no clear sellers, price just slowly was drifting sideways I pulled the plug.
Clearly not a good day for me, (second in a row), my initial game plan was looking for good reversals at the areas of interest R @ 2821 and S @ 2778 and avoid the middle.
Tomer.
03_10_2012-trades.thumb.jpg.19bc17e2d06e6499e033adfd6bb6b48c.jpg)
-
Morning all
Since I'm finding myself putting more weight on Trend Lines then I should, my long range views will not include them for now.
I also ditched the large scale chart and will only glance at it at the start of the week.
34 range – rearranged the boxes (trading ranges) to make more sense, levels are much more aligned and logical
In the past days price ranged between 2821 and 2778
2821 (Last swing high) was tested once and held, NO HH since then so i' look for HH today as a sign for buyers
2778 was tested on the last attempt down but price quickly turned up suggesting strong support.
21,13 range - nothing special that i could notice.
areas of interest similar to yesterday
R @ 2821
S @ 2778
Middle – 2794-2800 is choppy
Tomer.
02_10_2012.thumb.jpg.83a4f99650679b49e0fedce6a2737b0d.jpg)
02_10_2012.thumb.jpg.01832210915f4b020a08cda26e5f8426.jpg)
02_10_2012.thumb.jpg.ae37b75cd574dc37583873903d7ec780.jpg)
-
02.10.2012
Good morning.
No significant changes from the past days on bigger picture so I'll be short.
Yesterday – ended in a downtrend closing lower, resistance at the highs is valid and strong.
89 range – a trading range is formed
34, 21, 13 range – inside day, PHOD & PLOD are the edges of the trading range, price is at middle of the range.
144 tick pre session – opened up from yesterdays close, currently at the middle of the range.
Areas of interest
Edit : (mixed PLOD and PHOD...)
Resistance @ 2822 (PHOD & high of trading range)
Support @ 2778 (PLOD & low of trading range)
2800 – big round number and middle of trading range.
Tomer.
01_10_2012.thumb.jpg.1194a3ad70cd62863c864759c23b4588.jpg)
02_10_2012.thumb.jpg.f2d2e9314b90aefd6304bdfa627694dd.jpg)
02_10_2012.thumb.jpg.cd302506e7b621f15d5c5d364757e8e2.jpg)
02_10_2012.thumb.jpg.66e11fe7f2add577516c587c70b63e13.jpg)
02_10_2012.thumb.jpg.e0c422ff4d2953aa456c1e7b769c1dbb.jpg)
-
Hi tupapa.
i can only give advice from from problems i solved with my own performance.
i also noticed a difference between my backtested results and RT results.
what really made a difference for me in RT is cutting my setup and entry into smaller pieces and giving each piece a score. the trade score is the sum of the pattern/setup/entry trigger..
in a matter of days i could notice the changes i had to perform in order to get a better result.
other than that there is the screen time needed to build up the confidence in a trade since every trade is a little different even though the same rules for entry apply.
from your posts it seems you clearly know what you're looking for in a trade setup.
Just my 2 cents.
Tomer.
-
Following my post from the TIF thread
decided to quit early (10:30)
trade 1 - short, no significant HH, TL breached, pulback, and LL , small reversal according to my rules
trade 2 - was wrong i was putting to much weight on the TL, and did not take into account the support i noticed a couple of minutes before.
i did not take the short before the news (i'm still not comfortable with the wide moves)
trade 3 - long, support was tested, entered just above the last swing high, the decision to enter was mainly because of the large buyers on the T&S window
trade 4 -short, i was looking for a reversal since momentum died and we saw LH, support noticed below led me to exit at entry since sellers were not dominant
trade 5 - short, a little late but short since S was breached and we pulled back, a down trend was clear
Tomer.
01_10_2012trades.thumb.jpg.7f3b3e5e07144ef4edd3e69dc09cfa7d.jpg)
-
What you're referring to isn't tape reading in the traditional sense. Actually, I don't know what you'd call it since the tape is comprised of trades. As such, bid and ask "volume" are irrelevant as they represent intent (unless they are completely fake), not completed transactions. If you wait to figure out what the "big guys" are doing, you will likely find that you are consistently late. This will, of course, cut into your profits.These comments apply as well to "the Book". With a little research, you'll find that those -- at least those who post -- who take their cues from "the Book" will regularly stand aside or enter trades in the wrong direction while those who post here are making money. This isn't intended to be snarky; it's just the way it is. Same goes for those who trade "the news". We ignore it and do quite well. The same can't always be said for those who take their cues from it.
Db
I think i was misunderstood, i do not observe traditional level 2 data nor take it into account.
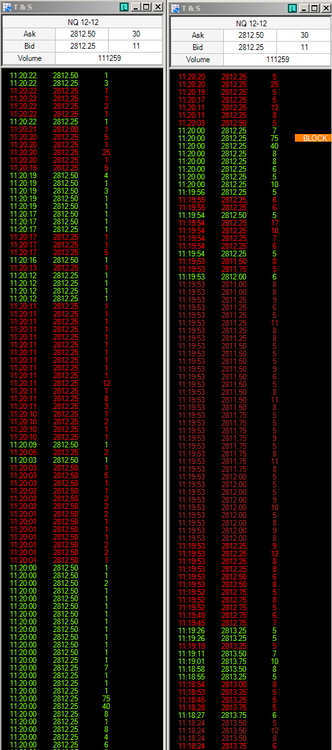
i use the T&S in NT7 which reflects ".... the current Bid/Ask price and volume as well as color coded last traded time, price and size." (taken from NT help menu.)
for my understanding it is the traditional "tape" reflecting filled trades.
i don't care about the volume nor the current Bid/Ask only the flow of filled trades.
since i have the option i color code to reflect if the last trade was filled at the bid or the ask which implies (i think ... ) who is stepping in.
(your reply is making me second judge it's accuracy and i'll check if the data is reliable.)
the T&S is another reinforcing parameter in the trade.
i attached a print screen of what i mean.
i appreciate your time and effort for the reply
Tomer.
-
01.10.2012
Good Morning.
My view of things...
Friday - finished with a downtrend, closing lower.
89 range - long term trend channel support acts as resistance
34 range - an up outside day, small trading range (small second box) seems invalid, first trading range (first box) middle acts as STRONG support, it's highs also acts as support
21,13 range - down TL from the highs forming a hinge...?!, PA from pre session breach it once.
144 tick chart - pre-session strong rise, currently sideways.
Points of interest for today (watch how price acts near them and act accordingly)
Support @ 2765, 2789
Resistance above 2813 and up to bull trend channel support
hinge (triangle) trend lines - we already breached once, if we pullback look for re-entry long.
Major news @ 10:00 and FED @ 12:30 so we might not see anything happen by then
Tomer.
30_09_2012.thumb.jpg.626ffe0c2ac44835233fc8c43ee85414.jpg)
01_10_2012.thumb.jpg.1c560b587eedcf23583c19848065e3f6.jpg)
01_10_2012.thumb.jpg.4a63d0b876aa4d316923aa169c8be5c7.jpg)
01_10_2012.thumb.jpg.402ca83ac1f279732a0cb5becbd74f46.jpg)
01_10_2012.thumb.jpg.32d2388525241f566edf087ac79b3765.jpg)
01_10_2012.thumb.jpg.32223550651c54d9d6d8e81f69855a0b.jpg)
-
Hello Tomer, I've been looking at your chart and was wondering how come you went long at point 1 so close to R?Also you mentioned a few times you pased a trade because you didn't see enough buyers on the tape or enough sellers. Are you using a price ladder to read the volumes?
I've been observing the ladder recently and often, focusing on how much volume is going through can be deceiving and lead to hesitation so I am considering ignoring it and focusing on the tick chart.
For instance, yesterday I took a short at point 2 in the following chart:
I was looking at the ladder and saw big size hitting the offer at 141.57 for some time, which made me doubt, but in the end price fell another 10 ticks.
Thanks for sharing ur trading.
Hi tupapa.
actually i don't use the price ladder only 2 simple windows of time and sales (at least that is how they are named in ninjatrader)
I position both next to the 144 tick chart, and one of them is configured to filter 5+ lots.
with them (and the tick chart) i can get a sense of "speed" and direction of price.
i try to notice where the "big guys" are entering their trades and in which direction (bid/ask)
I don't care much for volume in real time, i only consider it in past term regarding areas of interest.
that is how i observe price in real time.
actually (funny coincidence....) i was thinking to myself the other day that this forum is missing a thread on tape reading to complete the picture, but i was too shy to propose it.
Tomer.
-
Why so late on 2 and 4? And why short at 5-7 since we're practically at S?This is good stuff.
Db
The entry on 2 was late due to lack of sellers on tape ( if I recall correctly... I'll replay it later on to verify)
4 was according to my rules, I'm waiting for price to reach near to the last swing high on a reversal, and in that specific pattern I did not see enough buyers as price went up
5 was hope
7 was plain stupidity after 6....
I working on realizing those in real time

Tomer
-
Tomerok's chart is so clear. I am feeling jealous. Shorter bar interval does show things not visible in even the 1 minute. However, looking at only the 1 minute chart I would find it tough to identify that wiggle in the price bar that turned out to be a springboard.Perhaps in time some dough will need to be spent to get the sharpest tool. Until then I'll enjoy Tomerok's chart and day-dream.
Gringo
Gringo
It's tick charts, I found them reflecting PA more clearly to my eyes
and free (as in free beer :-) ).
Not promoting any software but ninja trader is free for sim use.
Tomer
-
Hi
continuing my post from the TIF thread....
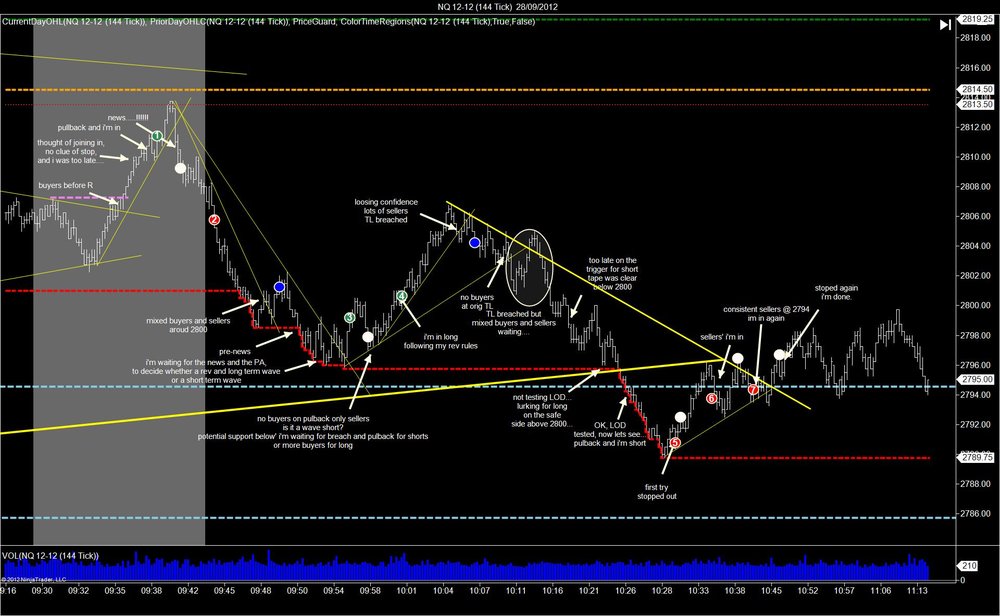
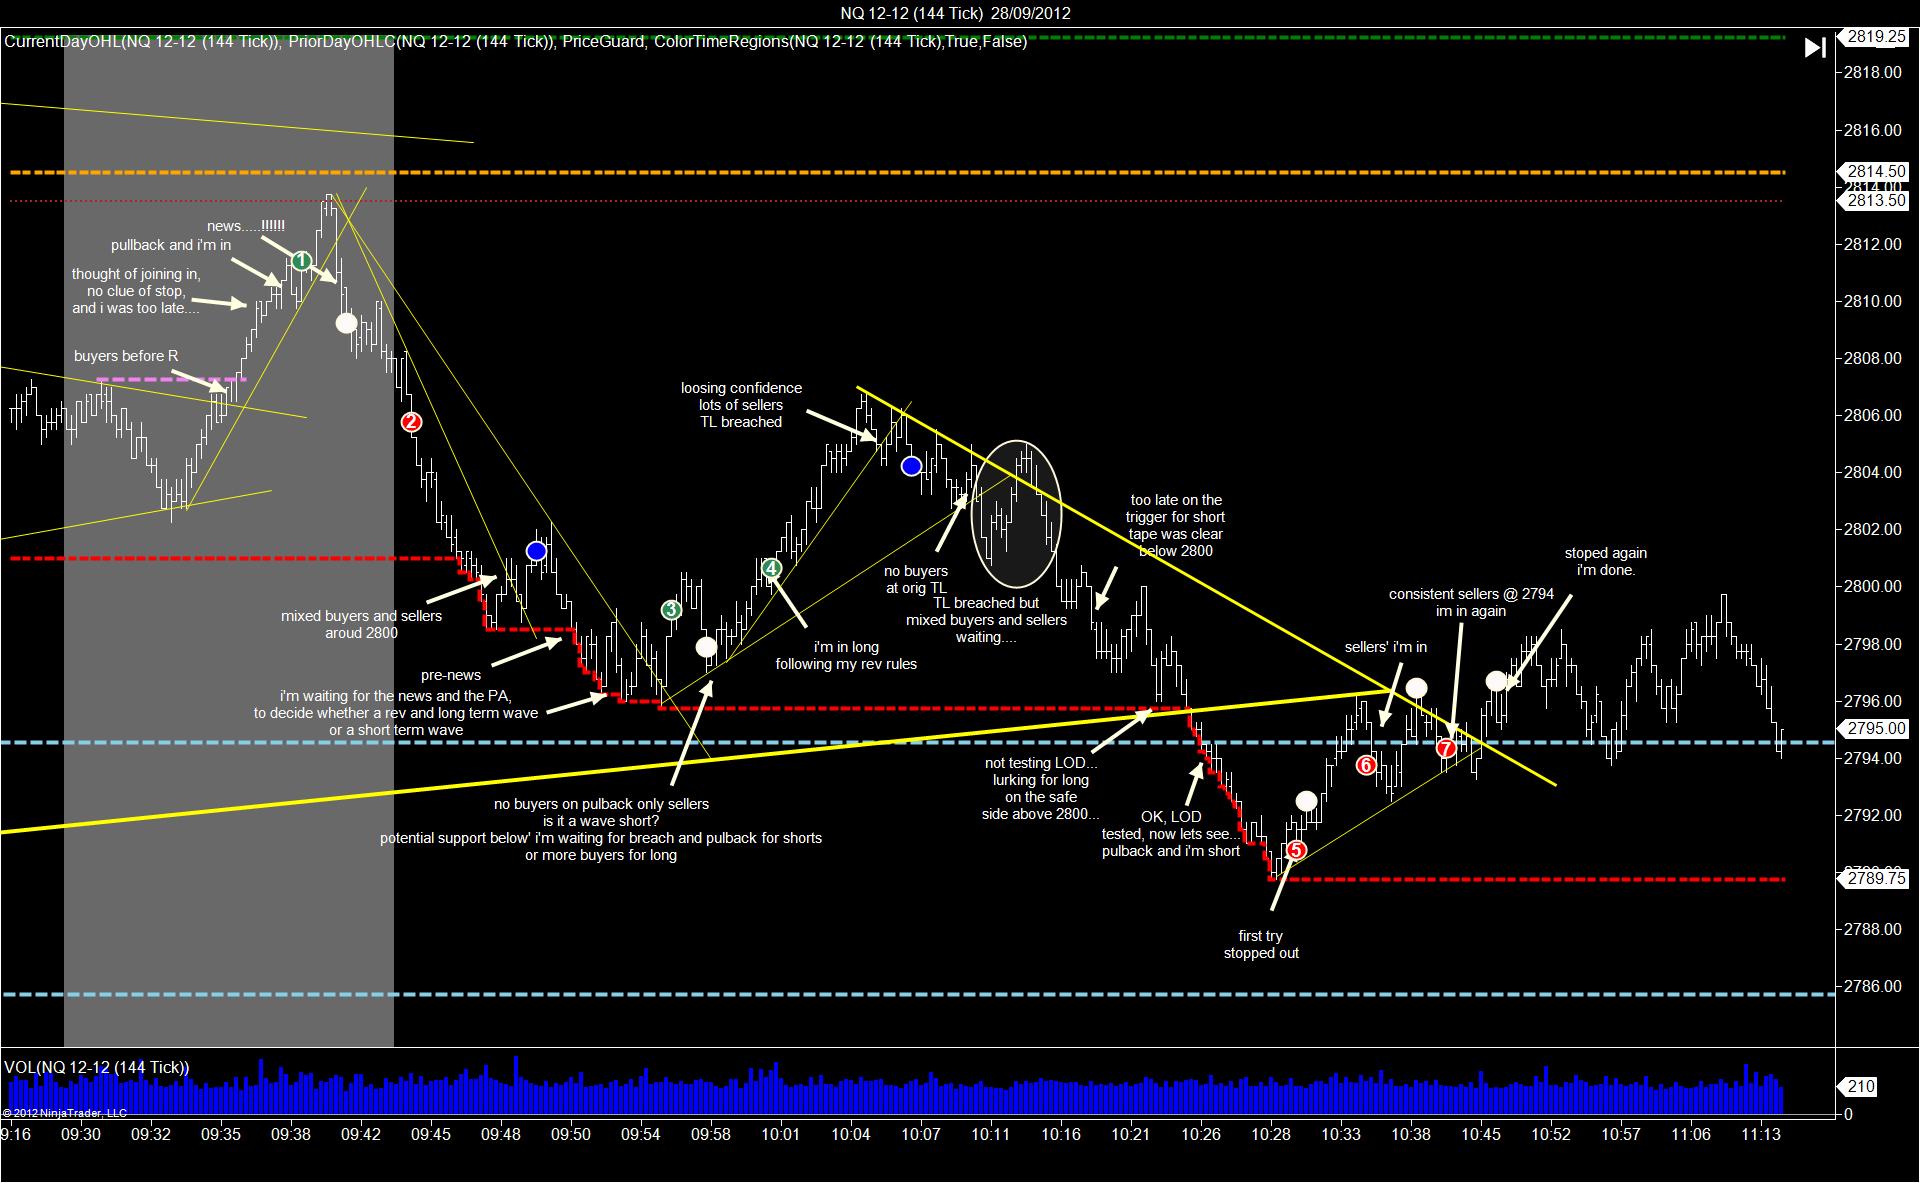
FWIW that's how my day looked liked
I narrated my thoughts on the charts as time passed
entries are colored circles
i kept the chart as it was in real time.
4 first trades were according to my rules
6 also
5 and 7 were not
Tomer
-
28.09.2012
Good morning.
Yesterday (144 Tick chart) - Price tested support at the start of the session, then tested resistance at the high of then, but only after 11:30 major support showed it's power and price went up.
89 Range - After testing support price went back to major SL, new major support for future use is around 2778 - 2788.
34,21 Range - Inside day, price descending, might be a pullback might be a reversal
13 Range - a potential TL from the lows, will consider it if/when price gets near.
Points of interest for today
S around 2794
major SL if price head up
round number 2800
Tomer.
27_09_2012.thumb.jpg.a082185ecd284f32250395b84a35174e.jpg)
28_09_2012.thumb.jpg.f3384b3a588b82cbb57c54f8d4199aa3.jpg)
28_09_2012.thumb.jpg.be5384ac0df30e2e60c913d344e82321.jpg)
28_09_2012.thumb.jpg.ef8e0a686d272ffa99eb58e726c0ea11.jpg)
28_09_2012.thumb.jpg.00fa6712a5da705de5ec9babc72ddc21.jpg)
-
Pre market update from atick chart point of view
Tomer
27_09_2012.thumb.jpg.296f7647dd11ed4e658e11e2178f0f3d.jpg)
-
Hi all.
i finally decided to try and contribute a bit after enjoying this one of many wonderful Wyckoff threads.
In the last month i tried to ditch what i was doing and focusing at wyckoff approach.
Here is my view of today's 27.09.2012 PA.
a quick explanation of my daily routine...
every day i go through 4 charts (long to short range) and try to see if i can notice any S&R.
I'm using range charts.
Solid lines are used for Trend Lines
Dashed lines are S&R lines
Dotted lines are used for less important S&R lines
Blue for S and violet for R
yellow lines are used for intra-day trend lines.
89 range - Long Range Bull Trend Channel support broken, Long Range Support from previous trading range highs (second box) broken, Long Range Support at middle of previous trading rage (first box) is valid.
34 range - last support (first trading range middle) holds, a 20 pt. pullback was formed, currently at the trading range highs.
21 range - An inside day with a small uptrend from yesterday.
13 range - No HH at today's session yet, still at the trading range (first box) highs
Let's watch what the open bring..
will broken S will become R
Will price go into a new trading range?
Or maybe it's long range sellers creating a pullback.
Tomer.
B.T.W.
Db.
i accidently posted it on the journal thread. please delete it.
27_09_2012.thumb.jpg.4344a1037d4e67c904bdbe464ccee439.jpg)
27_09_2012.thumb.jpg.59d8a34686770720e797877af3b8aec8.jpg)
27_09_2012.thumb.jpg.5d743d96a6a3f8a99b4cce763b492cd3.jpg)
27_09_2012.thumb.jpg.515b8ab0e6e416ac6496fd273dbc6caf.jpg)
-
Hi Db.
Good morning.....
Could you please explain the logic behind the 2791 line.
I can see their might be resistance before price rocketed up to 2800 (PHOD) and the last support between 2792-2790.
i guess my exact question is does the breakout of the hinge also contribute to this SR area?
Thanks
Tomer.
-
I think it was in the original course where I read that a trader should hide in his office, isolated from the world and listening only to the sound of the tape.This might've been viable 100 years ago, but is it advisable to trade like this today?
For example, I trade s&p futures and the FED could anounce QE tomorrow, what do I do?
1- I disregard this, cut my self from the world and trade like normal.
2- I include it on my plan and do not trade.
3- I wait for the outcome, and put my Position depending on it.
The same could be said if we trade the bund and Dragui is giving a conference or if we are an oil trader and a conflict kicks of in the middle east... Etc.
So do we ignore everything around us or do we act uppon the news?
tupapa.
if we trade price, then i believe it does not matter if there are news or not, there is always "something" to move price around, news is another thing that moves price.
when major news break it could be mayhem till someone takes control.
it's our "job" to act upon it (the price move..)
when i read that section on the ebook it meant (for me...) that a trader should keep himself isolated from distractions (rumors, advice, bias... etc.) and focus on price.
i personally wait for the outcome, it's a technical decision to avoid the violent moves we see sometimes.
Tomer.
-
What are you learning from all of this so far?
Db
Db.
Thank you for your pointers.
regarding your question...
to be short..., I'm learning another way to look at price.
to be honest..., somewhere along the way i forgot that things should be kept simple....
Tomer.
-
Today i was watching the NQ and TF.
I tried observing them both, i probably missed something along the way, since the TF price action caught me, i did not like what was happening on the NQ and naturally gave the TF more attention.
i'm posting the remarks as i wrote them live....(few after thoughts added..)
NQ
Long term analysis - bull trend channel, price is at R (my bias is short) waiting for a pullback to see where we are going.
09:33 - large buyers, without much success
09:38 - large buyers,large sellers, support holds, but without any decision
09:39 - volume,speed, price jumps up, i was happy something happened and started developing a long bias
09:43 - price did not break HOD!, large sellers, price quickly falls, shook my long bias, and marked in my mind the support below, if it breaks, probably price is headed down
09:47 - no decision, low speed, no buyers or sellers in control
09:57 - clearly no one in control (sometime around here i started focusing on the TF more)
10:09 - still no decision, i'm marking the price range on the chart.
10:12 - large buyers, speed, price breaks the price range (i was happy for a moment.... )
10:18 - buyers left early, and sellers appear, i'm realizing the break is false and drawing an r trend line for later use.
10:33 - still no buyers ... price glides down...
10:34 - large sellers, speed,volume, new LOD
10:37 - lots of big buyers!?....
10:44 - still lots of big buyers, (i now start to wonder how far will price go up...)
10:50 - large sellers, price retraces back, i'm thinking the down trend line is valid and price starts a new move down
11:12 - price breaks trend line
11:18 - i'm seeing large sellers, but resistance fails a minute later and price shoots up, new HOD....
TF
long term analysis - very similar to NQ.., long term trend channel , price is at the high after testing long term R, i'm waiting for the retracement to complete to give the tone on the long term direction
pre session - support and resistance were clearly set in a range.
09:34 - looks like an up trend is forming, only one large buyer, price trades above pre-session R
09:37 - i'm seeing large sellers but price holds and form a new high every bar, so buyers are in charge.
09:44 - price drops, no large buyers or sellers, i not sure who is in charge or why price descends
09:47 - still price descends, i'm still can't tell.. price action (tape) looks indecisive but looking to the left shows that price is going down.
09:51 - a very clear Swing Low is formed, i'm marking a trend line
09:55 - again, mixed buyers an sellers, price did not make a HH, and i'm beginning to lose confidence with buyers.
10:01 - speed , voume, new HOD, trend line is valid, buyers in control.
10:08 - price starts going sideways with no significant new HOD, (i'm watching closely at the tape trying to figure out who is trying to take control.)
10:13 - trend line is tested but still holding. (i'm watching closely at the tape without success)
10:20 - price is near HOD with a clear resistance,round number, large sellers but price holds
10:21 - more sellers but price goes up
10:22 - new HOD, still buyers in control
10:25 - i'm realizing i'm seeing a lot of red(bid's on the time and sales window) in the past minutes price holds on the tick, i wonder what will happen when buyers will stop holding price, since bid's dominated the tape.
10:29 - price start to drop, looks like buyers just left....
10:31 - long term resistance still hold, but there is not a clear pullback yet, that 800 sellers might be the mark for the long term change of direction...
10:35 - little volume and speed longer bars, price is headed down
10:49 - 3 big buyers, price retraces up. (i'm wondering what will happen around 800 if price gets there)
11:04 - trend line still holds, i'm seeing 3 LH but no LL, i'm marking support, and on the lookout when price start descending again towards S.
11:12 - price didn't get near S, trend line broke.
11:15 - big buyers in front of 800 zone.
11:18 - 800 holds, (i was thinking at the time this was the point for the long term down move)
11:20 - volume, speed broke 800, new HOD.
11:27 - another push up, new HOD, (since my long term bias was down i re-checked my long term charts and to verify where is the long term R.... still more 5 pt. to go...)
That's when i had to take a break

Tomer.
08_08_2012.thumb.jpg.86f0899a0853d44be4973895271f7c9a.jpg)
08_08_2012.thumb.jpg.d8df472979f9ec2a400222188d8f0b75.jpg)
-
Hi
I would like to share my observation on yesterday PA on NQ
I was taking notes as price moved and drew notations on my chart as i noticed things happen.
notes were taken from my log.
09:22- pre-session, up trend, coming close to long tern bull trend channel resistence.
09:27 - several big sellers (>10 lot) on tape, we break S trend line.
09:32 - price tested lows and highs without any decision...
09:33 - Lots of big buyers (>10 lot) (it looked like price is going to jump up)
09:35 - the response for the buyers was disappointing (i was expecting a better thrust because of the big buyers speed and volume)
09:39 - we are testing the pre-session trend line support again,
09:41 - at that point i was suspicious because i'm seeing big buyers at the lows but still price is not making higher highs or testing the highs again
09:46 - even though it's slow going up , there is a clear support forming , so the line with least resistance is up for now.
09:48 - price did not make it to HOD, lots and lots of big sellers, price drops fast right through pre-session support line, it's seems like support vaporized.
09:50 - still big sellers, but without success!, price is holding
09:52 - tried to refresh my view, looked back and tried to view things on a wider scale, the PA high and low looked like "somebody" or "something" shaked things up a little bit and the trading range got wider but without any real direction yet, looked like a "confused" market.
10:02 - (i tried a 30 sec chart to see if things will make sense over there) no big buyers no volume but slowly we returned to the up side, looked like an elastic band is slowly contracting to it's natural shape again
10:06-10:22 - price was caught in a 3 pt. trading range with no real direction
10:23 - finally we broke to the up side and hit the long range resistence of the long term trend channel,
10:46 Resistance is holding i notice LH, no volume to the up side, but also nothing to down side
i hope my post is helpful, and would appreciate any comment.
Tomer.
07_08_2012.thumb.jpg.9bacf5d2f0e0ff4dfc00709f99c55b36.jpg)
04_10_2012-trades.jpg.65f21264b28cf7261e47ee5138fc5c06.jpg)
04_10_2012.jpg.9bbd1e8e195e2f539010efac3bc4f33a.jpg)
04_10_2012.jpg.7a77089e27c25235ed318b2664c761e8.jpg)
04_10_2012.jpg.ede6aef72e5b08705ac58856ae2c9a93.jpg)
04_10_2012.jpg.8834e3046f604a6de6777cb5a8981576.jpg)
03_10_2012-trades.jpg.8180f305a8e3ccdbe4d3c1fd61d1beb0.jpg)
02_10_2012.jpg.f4d4a28df7babd7f001abcddd14bf032.jpg)
02_10_2012.jpg.004b19ac14067ca202611a4c5e73199f.jpg)
02_10_2012.jpg.18a6da4d74208c5eb16078ed77acee97.jpg)
01_10_2012.jpg.b252d15ecfc74bdcb9a828713e191d1a.jpg)
02_10_2012.jpg.c2860ca64a392986ed17fc1f0fa1c58d.jpg)
02_10_2012.jpg.1b9913adc1311380b67db331c9d3a6c8.jpg)
02_10_2012.jpg.64935ad37d887847246f82c07bf67ad1.jpg)
02_10_2012.jpg.a257390c9639e0b0e543215b64294354.jpg)
01_10_2012trades.jpg.51f08e902af211f22481737be6cafd14.jpg)

30_09_2012.jpg.80afcc60ed8b0f9cfd79f67504b28709.jpg)
01_10_2012.jpg.86c92767e283d6d96fe1a05d521286fd.jpg)
01_10_2012.jpg.651d2156d97a87464196d8e6ff6b4355.jpg)
01_10_2012.jpg.11d814835a1513411345fb890d158c84.jpg)
01_10_2012.jpg.ce31c6e6165193649e413c4b5f537855.jpg)
01_10_2012.jpg.1c8debc3f5cfe0106860ddced74dfc26.jpg)
27_09_2012.jpg.5749adce57ca42837591677208a11af2.jpg)
28_09_2012.jpg.feb352fc608a9af0d23908435829d590.jpg)
28_09_2012.jpg.31685f71cbdc1073accca4fa7fee071b.jpg)
28_09_2012.jpg.a37501093550368d5fd3499505b5af5f.jpg)
28_09_2012.jpg.f3c728188c0e8e1673f32d04aa2f9568.jpg)
27_09_2012.jpg.b0bc375630f207973720b58b07319e30.jpg)
27_09_2012.jpg.3bedf90a323fdc5f626fb8d1cf740446.jpg)
27_09_2012.jpg.9d13d0533b7ba3257ae4d9837dd5fc27.jpg)
27_09_2012.jpg.3027611abcb7b2d1e9860dc3be1572da.jpg)
27_09_2012.jpg.8f657bd521b7c625a19150840ca9690c.jpg)
08_08_2012.jpg.d22c9b18c52e24c85ed0efe7ed378f2d.jpg)
08_08_2012.jpg.948943b29d92bf0ed13ebb9a57f46a45.jpg)
07_08_2012.jpg.c2bbf78d9c6064b8df65a612d0ab4106.jpg)
Trading The Wyckoff Way
in The Wyckoff Forum
Posted
05.10.2012
Good morning.
34 range – a 5 day trading range is visible, price above it, exit from the box ranges was not violent but more with ease with the uptrend.
Areas of interest
R @ 2852, 2871
S @ 2821
Upward TL.
Tomer.