
Welcome to the new Traders Laboratory! Please bear with us as we finish the migration over the next few days. If you find any issues, want to leave feedback, get in touch with us, or offer suggestions please post to the Support forum here.

tomerok
-
Content Count
110 -
Joined
-
Last visited
Posts posted by tomerok
-
-
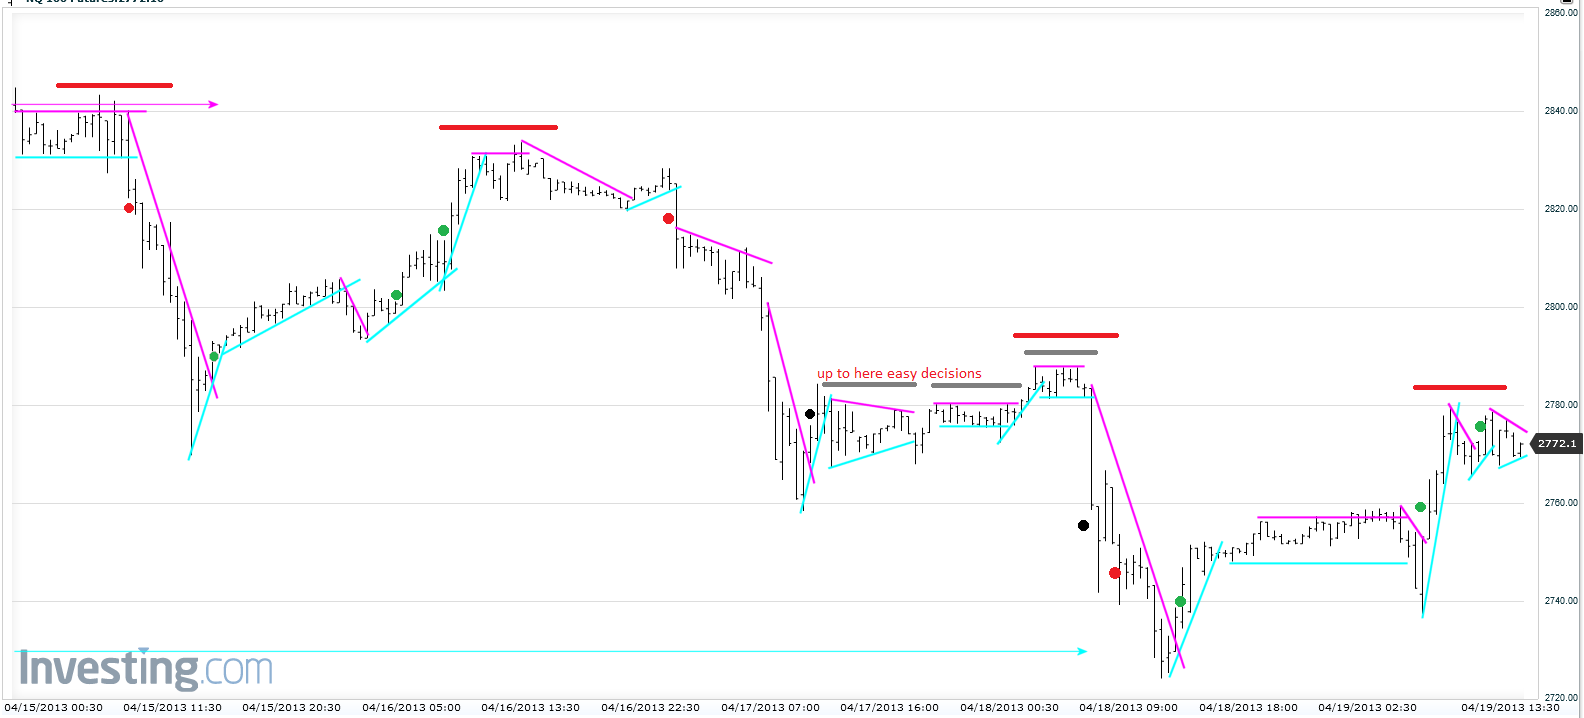
But you won't know the weekly trend on Monday. What do you do on the 15th? And each day thereafter?I was referring to my post in which i completely misunderstood your question.:doh:
of course i can't tell the trend on monday i would have opened up past week, month , year or whatever i needed in order to to see what going on.
for me looking at this chart as is without referring to the left is belongs to the CWS thread or "sharpen your entries" thread..
i have not yet mastered the surfing ability.
i tried to answer with that in mind and a little peaking to the left..
assuming always in position..
note the black point which represent indecision points for me.
since this is a 30M i would have liquidated and gone long, BUT let's assume this is a 1M, now there's no reason to rev since we are at the overall right direction. (small red lines marking the tops)
the second black dot would be short if i was long.
Tomer.

-
Actually I was referring to the entire week, beginning with Monday. A 30m bar chart for the previous week was also posted, though anyone who is interested can convert these to 60m bars or 5H or 12H or whatever.typo on my part, meant weekly trend, re-edited that.
Tomer.
-
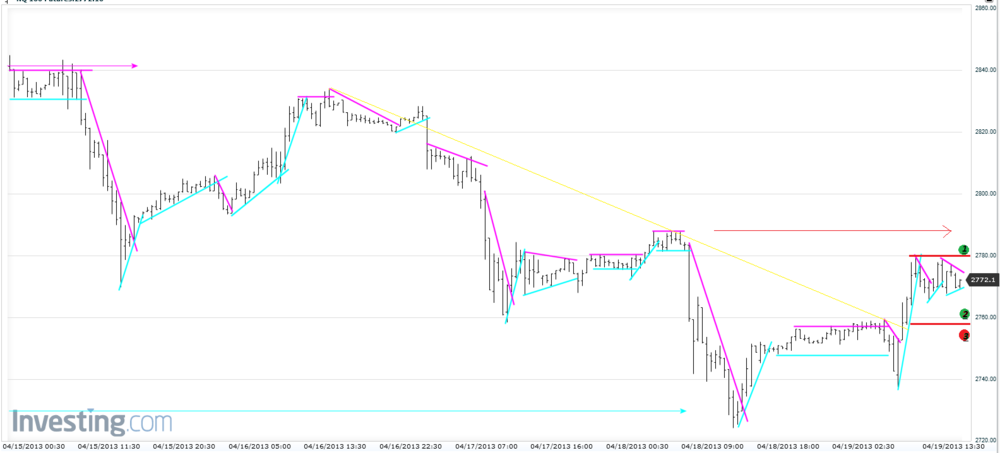
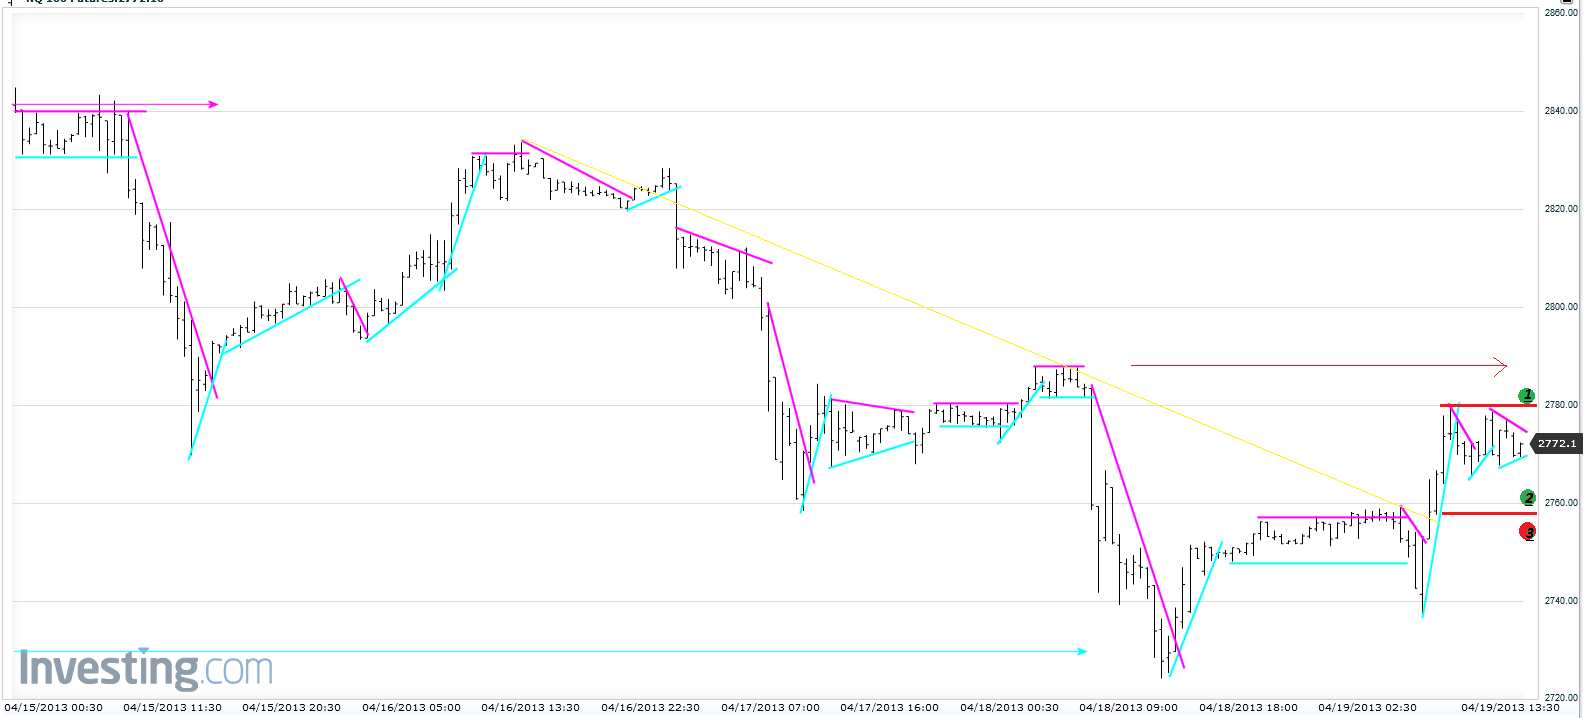
i see three options.
immediate weekly trend TL is broken (yellow)
no new lows, in fact HL and HH after the break
hinge at 04/19/2013
1. i'll wait for price to BO above 2780, pullback and then enter long, looking closely for any signs of R from the LSH (red arrow)
2. i'll wait for price to re-test 2760 area, if holds i'll go long
3. i'll wait for price to re-test 2760 area, if breaks i'll go short
P.S. zooming out to the 60M, 360M, reveals that the down TL is still intact
taking that into account i would avoid any directional bias.
Tomer.
-
sorry Dbphoenix, i do what you said but ican not find itgozilla
follow the link Db posted, you'll see in the post an attached file (pdf)
download it and search inside the pdf.
Tomer.
-
I don´t have anything smart to say about volume, but if someone has anything to say about it I would appreciate it.
I'm sure it's not that smart

But it is obvious to me that price BO to the down side without much volume, which lead me to believe buyers are not there.
not much effort and price drops... might imply a change in trend..
Tomer.
-
Tom,How do define the establishment of a LH? Ticks away from the LSH?
The way I see it, once the LH is set, it still has to break LSL in order to make a stronger
downwave. That is why I wait for the BO, one could also short the BO, but I decided to
start with the RET. I am highlighting the BOs in my analysis, but will first get stats on the
Ret after the BO.
Since LH can only be determined at hindsight or at least after price has moved further
way from the LH point (for my taste...), i use in RT a shorter time frame to pinpoint the
entry point.
Take a look at the 360 chart, circled is the entry point, one can argue waves are not clear
enough and no clear LH is visible.
i use the 120tick for entry and if required even down to the 20tick.
regarding ticks from LSH, as a baseline for my entry definition i will not take entries that.
their LH reached back into the TL zone, for me this is a sign for indecision or at least that
buyers has not given up yet. the actual number of ticks is depended on the context(time
frame) and slope of trend reversed.
i can understand your logic for confirmation on the reversal, I did not mention i put a lot of
weight on the pullback that break the TL in terms of speed,length and determination visible,
Tomer
2_5_2013.thumb.jpg.25096eb63e5a516f7fc88ca8f3687f24.jpg)
2_5_2013.thumb.jpg.ad07174c38192476d405fe2b2bcb40e8.jpg)
-
I'm with tupapa, I enter right as lh is established, if i'm wrong and it's not a rev i'll know it straight away, with your entry technique Niko, you might find yourself at the end of the reversed move in no time.
Tomer
-
is it just me?, none of the images at this thread are visible
Tomer.
-
Attached you will see a picture of the chart I use to trade with . Nothing fancy , just 2 things and that's it........
Gekko :missy:
Actually i see 3 things on your charts...... price......

I think the biggest problem was and always be most people prefer shortcuts
could be culture, could be upbringing, could be they are just plain lazy
some of them even go through so much trouble and effort in order to take the shortest road
and never stop to think that if they would have put the same effort in just walking the path,
they would have already been there or at least did not waste some much time in chasing something that does not exist.
Tomer.
-
Sharp eyes will notice i have been converted to time based charts
I did not notice any significant edge with tick for my kind of trading
another change i have made is zooming out to 5M chart's and timing the entry on 1M
which result with a calmer experience of the trading session
if anyone interested i use 60 and 15 to determine levels and and come up with an action plan for the day
during the session i watch the 5m (mainly) and 1m for entry keeping the 15m open as a reminder for my general daily plan.
Tomer.
1_29_2013.thumb.jpg.5b74d50bfd65e827ff0dc00d868f1e29.jpg)
1_29_2013.thumb.jpg.cde37f557dbabb2b70538db90a8ef6f4.jpg)
-
-In reference to this post, here's a little exercise from way back when (forgive the candles and the MA; they aren't pertinent).
Is this a retracement in an uptrend or a lower high in a downtrend?
Who knows.... and who cares...
one of the biggest lessons i learned in past months is i do not know where is price heading.
i can only craft a plan to attack any direction price will decide to take.
I'm assuming this post intention was igniting participant's response and ideas, but without any clear view to the left any answer is valid.
Tomer
-
today's plan embedded on chart
pretty simple range plan
Tomer
1_9_2013.thumb.jpg.d75079e57c821e25686fe9cd1003d316.jpg)
1_9_2013.thumb.jpg.4dcb81c7e62f27210b78de89802df129.jpg)
-
today's plan embedded on chart
Tomer
1_8_2013.thumb.jpg.dd1c6364cc470c1536351baff041f78c.jpg)
1_8_2013.thumb.jpg.097edb9302163e69e3324a5c086ab1f9.jpg)
-
-
Tomorrows plan for the morning.At A, look for long on a rejection, enter at the test. If we break below A, go short on a test from the downside.
At B look for longs on a rejection, if we break below, go short on a test from the downside, and target is A.
Above C short on a rejection and long if we break and hold above, target becomes D.
At D, short a rejection, if we break and hold above, go long and target becomes E
If we break below A, I have 142.26 as a potential support level, if there is rejection I will go long.
I would also keep an eye for a hinge play
Taking into account the S&R mentioned.
Tomer.
-
I know most of you guys are still in the "Observing Price Movement" but have any of you moved to backtesting or forward testing?Yes, I started backtesting a month ago but stopped after 6 month of data.
I am interested not in what you are testing, but more in the process. It seems like most of us are learning the same thing, which is trading of support and resistance. Have you guys tried testing what db outlines here?I think more than testing a particular pattern, we should be testing how the market responds to S/R and our management strategy don't you agree? I don't see much point on testing a pattern in isolation.
I started a year back, plotted S & R just as i would have done in RT, long to short term.... S&R, so if i had to go even backwards i did that, then i looked for my defined setups near those S&R, updated the S&R if needed and moved forward.
For instance, I trade the bund, so if I want to trade "in Foresight" of Support and resistance, I would go back to the 22-11-2011, and start testing my plan.I draw my levels on the 30m chart, and use replay to find my reversal pattern, but only at the pre-defined levels right?
Lets assume I am only trading doble tops on the 1m chart, of S/R from the 30m chart, in this case, I move my charts back to the 21st of November, plot my levels on the 30m and I would enter at the rejection of D, that would be it for the morning.
Then I would move on to the 23d, and do this for the remaining 11 months of the year.
What do you guys think? Are you doing your forward testing in this way? I know it will take days to go through a year but it seems the only way to test this sort of thing!
I chose to test my setups in 2 steps, the traditional backtest as i described above and documented the results on spreadsheet.
the 2nd stage will be replaying 2 random days each week, and taking trades "RT" on the same data (1 year back), this way i can confirm (or not) the stats..
i'm also trading the setups in RT and keeping record of the stats..... for further comparison
I once read somewhere that you should take into account 30% margin of error between backtested results and forward tested results, i dunno if it's correct, but i hope the path i chose will give me a better view or understanding on the actual expectancy of my trading plan.
as i said in another post, i found my stats of the backtest too good to be true and decided to stop that process and refine my setups, another thing i realized is that i should minimize the number of setups and test only 3, if i choose to add to my arsenal another one later on than i would do the whole process again for each setup i add.
it's a tedious task but necessary.
Happy Holidays..
Tomer
-
Here's my journal for today
luckily i realized early it's not a very "nice" day and hold my horses.
WHITE are RT notes, YELLOW are my post analysis notes
Tomer
20_11_2012-notes.thumb.jpg.785303bef4b3a36ae0f095b99f12ac41.jpg)
-
Price is back in long range down trend channel, almost near it's long range SL
Since we had so much selling pressure in the long term I'm not sure if we should anticipate price testing DL back again
Past days TL holds nicely
Overall game plan is buy up to DL area, and be on the lookout for R if price continue rising
If price show weakness , wait for TL break and LL to verify short direction
Areas of interest
2625
2618
2608
2597
2584-80
Tomer
20_11_2012.thumb.jpg.b2ec9308dd14d08e882562428270d3dd.jpg)
20_11_2012.thumb.jpg.9d1988f18d37dee0155e0a88429d1302.jpg)
-
Here's my journal for today
was a short session for me
WHITE are RT notes, YELLOW are my post analysis notes
Tomer
19_11_2012-notes.thumb.jpg.620b48bfe731b273feff927bbf336393.jpg)
-
On Friday price tested long range lows and failed
Price have cleared 2 days TR and is back in long range DL zone again
Currently price at hinge MP from 14/11 and testing medium range SL
Areas of interest
2607
2597
2584
2572
2555
2539
2534
2526
2513
Tomer
19_11_2012.thumb.jpg.2928b428089977797f211dd6c83492a3.jpg)
19_11_2012.thumb.jpg.8817ce72deb38b0d9ad12eab1c84a0ae.jpg)
-
Tom, great notes. Just 2 comments:Did you test your setups?
I see that you take some of your trades away from your S/R levels, perhaps that is why you are getting some false starts.
I am not yet into trade design but some preliminary observations make me think that as long as the trade is started near S/R the probability of success increases dramatically and the r/r ratio also improves.
Hi Niko
I did not back tested them yet, i'm playing with them to refine the entry points
your comment is exactly what i have realized in the past days/weeks
i started back testing a few setups a month ago and the stats were way too good to be true, (comparing to the RT trades taken.)
don't be confused by the trades taken, they are sim and taken only because i feel i learn more if i execute my thought in RT.
Tomer.
-
Here's my journal for today
WHITE are RT notes, YELLOW are my post analysis notes
Tomer.
16_11_2012-notes.thumb.jpg.edb21f5fc1f791ca23ae625602110225.jpg)
-
Long Range view has not changed much in the past days, still pressure to the down side
But I can notice smaller down thrusts in the past waves
Price also stopped few point from major S from the past
Areas of interest
2550
2540
2534
2526
2513
2510
Tomer
16_11_2012.thumb.jpg.4d8abcde842884b3545dd2ed4292fe85.jpg)
16_11_2012.thumb.jpg.2a3d2b582ea5dd2719cf4af2fee2116b.jpg)
-
Here's my journal for today
WHITE are RT notes, YELLOW are my post analysis notes
when i decided to call it a day price was at 2522 showing no signs of sellers
eventually it descended a little bit more
Tomer
15_11_2012-notes.thumb.jpg.7f46c968857bea67fc4a37daf7e77bb9.jpg)
2_5_2013.jpg.a548804199ddad3fd2ab2bd82987d695.jpg)
2_5_2013.jpg.a6759845030d83a98640df9bd7de274c.jpg)
1_29_2013.jpg.7db32d99324687aed29e1fb206e69bc2.jpg)
1_29_2013.jpg.44e02330b7f29a18b08f5c39ccb7e70b.jpg)
1_9_2013.jpg.8779965d515568856307c37923869b17.jpg)
1_9_2013.jpg.02485775444153c1c75837c009be9c25.jpg)
1_8_2013.jpg.529b1bc2a785298be8fc75797d5255a7.jpg)
1_8_2013.jpg.6e84817f9fa5e87bf84403375643253b.jpg)
20_11_2012-notes.jpg.8bff89fb232057f084cf676ed6411ad1.jpg)
20_11_2012.jpg.0b70d4760aaebdea5848db8b2190f374.jpg)
20_11_2012.jpg.0cd5fab0bfe9183735f8350ac683a340.jpg)
19_11_2012-notes.jpg.a5f5506f65e50f9be98ee5f99f9f1f1e.jpg)
19_11_2012.jpg.1f7976481b1c4296105c329540946c54.jpg)
19_11_2012.jpg.c895de549906ad550c8a9331b1dc9198.jpg)
16_11_2012-notes.jpg.cb469b7054d8037027856568a5d07faf.jpg)
16_11_2012.jpg.512f846e26887bbf4cda33dafc3df5b2.jpg)
16_11_2012.jpg.f73d80a8f0f5ee7cf3acdf1cabc6c704.jpg)
15_11_2012-notes.jpg.0dcb02657b866efa1ba38b9d02d3179b.jpg)
Sandbox
in The Wyckoff Forum
Posted
I was referring to my post in which i completely misunderstood your question.:doh:
of course i can't tell the trend on monday i would have opened up past week, month , year or whatever i needed in order to to see what going on.
for me looking at this chart as is without referring to the left is belongs to the CWS thread or "sharpen your entries" thread..
i have not yet mastered the surfing ability.
i tried to answer with that in mind and a little peaking to the left..
assuming always in position..
note the black point which represent indecision points for me.
since this is a 30M i would have liquidated and gone long, BUT let's assume this is a 1M, now there's no reason to rev since we are at the overall right direction. (small red lines marking the tops)
the second black dot would be short if i was long.
Tomer.