
Welcome to the new Traders Laboratory! Please bear with us as we finish the migration over the next few days. If you find any issues, want to leave feedback, get in touch with us, or offer suggestions please post to the Support forum here.

wrbtrader
-
Content Count
314 -
Joined
-
Last visited
Posts posted by wrbtrader
-
-
Does anyone has all the charts uploaded which were deleted? It's a pity if they aren't uploaded again.What charts were deleted ?
I asked because I just did a quick reviews of parts of the thread and I see "attached thumbnails" and then when I click on the image...charts appear.
Thus, are you talking about specific charts that someone posted as a link to somewhere else that's not Traderslaboratory? In fact, can you name the message post number that had a deleted chart. For example, the number of my message post is #180 in the upper right corner. I'm replying to your message post #179.
-
Although the OP (thread starter) question about what to trade based upon liquidity after 5pm est is almost 2 years old...there's also the issue of your trade strategy being used besides liquidity. I'm assuming you're on eastern standard time and most likely want to be in bed by midnight.

For example, if your trade strategy is based upon Japanese Candlestick patterns...you will not see too many of these patterns after 5pm est in many trading instruments (e.g. Emini ES) even if it's one of the most liquid trading instruments in the world.
Simply, whatever trade strategy you're using...backtest it on all the available trading instruments after 5pm est to see which trading instrument is more suited for that particular trading instrument.
However, if liquidity is your only concern, you should take a look at the liquidity charts @ Futures Liquidity - January 2011 as a starting point but that list changes every month because liquidity changes.
Here's my list of trading instruments to trade between 5pm est - 12midnight est based upon volatility, swing points and directional price movements (list below not in any particular order).
- Light Crude Oil CL futures
- Gold GC futures
- Hang Seng HSI futures
- S&P CNX Nifty futures
- Eurofx 6E futures
- EurUsd Forex
- Emini ES futures * only during key market events
In contrast, if you go to bed early and wake up early to squeeze in a few hours of trading before work...I would add to the above list Brent Oil BRN futures, Eurex DAX futures, Eurex BUND futures, Kospi futures and many other Forex Currencies based upon the 3 requirements I've listed above.
- Light Crude Oil CL futures
-
Hey Guys! Sorry for not replying lately! Been real busy! All the post have been informative!Just one question i have is How do you trade the TF when the ES is closed!
Dont all emini futures trade 24 hours a day, so how is this possible?
Thanks!

elovemer was just joking...you can not trade Emini TF when the Emini ES is closed.
Also, Emini futures don't trade 24 hours a day...they are closed during maintenance periods (4:15pm - 4:30pm est week days, closed Saturdays and not open until the evening of Sunday). There are also many U.S. holidays when they are closed while the European futures are open such as Eurex DAX or vice verse.
However, be aware that the Emini TF is on the ICE exchange whereas the Emini ES is on the CME exchange. If one of the exchanges goes down (computer problems)...the other exchange is still open. However, such situations are rare and may only last a few minutes but never all day.
Last of all, some data vendors software gives the option of using regular trading hours (9:30am - 4pm est) charts or all session globex charts. My point is that some traders prefer to use charts set to regular trading hours, others prefer all session globex charts while others have both type of charts. I'm the latter...I use both charts side by side on my monitors because I have a few trade strategies involving gap trading and I can't see such on the all session charts. I also use other strategies involving the all session charts whenever there's volatility spikes via key market events (e.g. European market news). Thus, I need both types of charts. However, in comparison, I do have a preference for regular session charts.
-
Yes, brokers love scalpers as long as the scalper stays in business or as long as brokers have a consistent turnover rate from one scalper to a new one.
Also, I'm not sure if you qualify as a scalper because the information you've provided is not scalping. Simply, it seems like you're just day trading.
Scalpers have special commission rates because of a high number of trades and/or negotiated special rates with their broker...some even have exchange seats or large trade rebates. Scalpers usually stay in trades less than a few minutes. Scalpers main system involves order flow, times & sales screens, market depth, DOM et cetera that involves tape reading. In contrast, a minority of scalpers use charts as their main system and those charts tend to have intervals of 1min or less and possibly tick charts. Trade latency is a big issue for scalpers and they usually have something in place that measures such from one trade to the next trade. Scalpers have their computer equipment setup for scalping to make it more efficient (e.g. keyboard macros). The few profitable scalpers I've met...they don't use risk:reward ratios.
However, I know you didn't explain everything but the stuff you've did mention falls in line with just a day trader.
I recently started scalping the ES. Today I took 20 trades. They varied from 1 contract to 3 contracts. Stop loss was discretionary and varied from .50 to 1.50 depending if I was directly trading with the very immediate trend or contrarian to the very immediate trend. When I say immediate trend I mean on a 1 min, 5 min, and 15 min chart. I also look at 30 min and 1 hour and daily charts for a view towards the longer trend. Here is what happened on the trades.Total profit gross: $412.50
1) 18 winners. 2 losers ...89% win rate.
2) Average win $24.31
3) Average loss $25.00
I had 29 RT so I traded 58 contracts over these 20 trades.
Comm 145.00
Net 267.50.
I have some questions:
1) Is the reward to risk ratio as important to maintain at least a 2:1 ratio when scalping ES?
2) How do you maintain a 2:1 ratio scalping when the system I use takes 1 to 6 ticks as its profit target. Usually .50 to .75 pts is more the norm. It is hard to have a 2:1 Ratio when going for such small targets. I can't make my stoploss less or I will get stopped out too much?
3) Those of you that scalp the ES what is your average stoploss and average profit?
4) I actually scalp off the 1 hour chart but use the 30 min, 15 min, 5 min, and 1 min, for trend confirmation. But my setups are on the 1 hour chart. Those of you who scalp the ES what chart you use?
I know..the brokers like this sort of trading...but I consider simply a business expense. The only way I could lower the comm would be to make less trades and go for bigger profits but the system seems to work best taking ,50 to .75 pts profit each time and an occasional 1 to 2 pt profit.
Any ideas anyone or suggestions to me?
Patuca
-
Amen mark.philosophical is a bit like a Möbius Strip
does TL have a forum for traders interested in charts with actual entry & exit strategies?
Peter
Yes, this forum has tons of threads where traders talk about the details (entry and exit strategies) along with chart examples. There's also tons of threads where traders may only talk about one and not the other (entry signal only or exit signal only).
Just explore more and you'll start to see them because it's a big forum with lots of stuff spread out.
-
There's just too many different situations where worrying about which (buyers or sellers) is in control becomes just another philosophical discussion because whatever time frame someone is using to make a trade decision...
A different time frame used by another trader at that exact same moment could show just the opposite about who is in control. Further, even if someone had the resources to know what every hedge fund, institutional trader, high stake professional retail trader, corporate traders et cetera was doing at one particular moment in time in a particular trading instrument along with knowing what their goals were for the position...
You can't exploit such as a retail trader, let alone via technical analysis by itself (this question is posted in the TA section), although it makes an interesting discussion for some. The markets is just too dynamic to explain via technical analysis alone although such falls under the facade of keeping it simple.
Thus, to echo what someone else said...don't get caught up with this type of questioning unless you had the resources to see it occur in a particular market at a particular moment in time.
-
I prefer to trade Emini TF because my method (volatility based) was backtested on both TF and ES. It showed better profits with Emini TF in comparison to the profits in Emini ES.
My point is that to properly determine which is better...it's strategy specific. Thus, someone using a different method can backtest and choose Emini ES because ES has better profits than Emini TF due to the type of trade strategy being used.
Simply, there are methods used by traders that performed better in Emini ES and there are methods used by other traders that performs better in Emini TF.
-
I notice in your explanation you use the word "bid" while not including anything about the word called "ask" in the same sentence although elsewhere. My point if you're trying to understand supply/demand via such a way...it's difficult.
There are many ways to explain who is in control via supply demand analysis and using "bid/ask" references is just one way out of many although not my favorite. By the way, there are other explanations here at the forum @ http://www.traderslaboratory.com/forums/f131/ and you can then use that to further your research outside the forum into other areas of supply demand analysis if needed especially when you get into more trade strategy specific discussions.
Also, pay attention to what electroniclocal said...
There is one thing you are ignoring. There can be both buyers and sellers in control. On, say, the 1 minute timeframe buyers can be in control and on the 10 minutes time frame the sellers can be in control. It's important to trade the trend of the chart you are trading from. That is THE trend. -
Hi guruji,
I don't follow stocks so I really can't comment upon any of them nor do I know what time frames you're testing on. However, I do trade futures and see the pattern on intraday charts of futures and forex trading instruments.
Also, most of the documentations I've seen about the pattern involved futures or forex. In fact, I can't even remember the last time I've seen chart examples of this particular pattern via stocks.
In addition, most of the literature I've seen doesn't use the strict variation that you've mention in this thread. I've seen at least 7 different variations of this particular pattern discussed in different literature (books, videos, websites and forum discussions).
Think about it, your strict variation has the high price of the doji LESS than the lows of the interval 1 (dark line) and interval 3 (white line). Basically you're talking about the entire price action range of the doji interval gapping below the entire price action range of the black line and white line. That's a very rare price action and a particular variation I don't see discussed too often. The few times I've seen such occurred within the context of key market news causing the entire range of the doji to gap down.
Simply, the Morning Star Doji is a commonly discussed pattern but some of the stricter variations are not commonly discussed in any literature I've read.
guruji, out of curiosity, have you compared your results of any particular type of candlestick pattern to some of the candlestick websites that post daily scan results of stocks (e.g. stockcharts.com) to determine different variations being used that contrast your own variation ???
A few comments:- I am being very generous when I state on my blog that there are less than 10 instances on this strict definition of the pattern. I have NOT FOUND any instances of this pattern
- The back testing was NOT done on the SP500 index. It was done all the 500 stocks that made up the SP500 index in 2010.
- Yes, I agree this is a very strict interpretation on the morning star doji. I plan to back test a more relaxed interpretation soon.
- I find is interesting that particular pattern that is well written about in literature actually does not exist
-
A morning star doji is a 3 bar pattern with bar1 (long and dark), bar 2 (doji) gaps down and bar3 (long white) gaps up.I did a back test over SP500 stocks over 15 years and could not find this pattern.
Have you seen it
I just went to your blog and it saids you have found 10 examples of this pattern while you said in this message post you didn't find any. Which statement is correct ???
Regardless, there are several variations of this pattern and your requirement of the high of the doji be less than the lows of both interval 1 and interval 3 is an extremely strick variation.
I also want to remind you of an earlier conversation we had about Japanese Candlestick patterns. Each pattern has there own different variations. Thus, it's absolutely critical that if you're going to backtest, test any particular candlestick pattern...you test all the known variations you can find or else your testing results will be flawed and may be different in comparison to what traders are actually using in real money trading.
For example, another variation of the Morning Star Doji pattern is that the high of the doji is less than the close of interval 1 (dark line) and less than the open of interval 2 (white line). Simply, this particular version doesn't use the Lows as a criteria as a measurement against the high price of the doji. However, in this particular version the lows of the dark line and white line are not less than the close=open of the doji.
Something else you may want to consider. You're testing your particular strict variation on the S&P 500...you testing it on the Index only or have you included results of the SPY and Emini ES. Also, I'm going to assume you've been testing this pattern on multiple different time frames (monthly, weekly, daily and intraday charts) to have a decent sample amount versus testing on one time frame alone.
-
What is the best time to trade the emini russell 2000 futures?It's very simple...whatever trade signal you're using...backtest along with analyzing your real trading results to determine when you tend to lose money and when you tend to make money while trading the Emini TF futures.
-
Keep it simple via backtesting your method on different time frames and then choose the best interval based upon the results you're comfortable it.
Also, your results to determine a suitable timeframe will differ in comparison to someone else if you're trading something different, trading a different time of day, if you're not using an auto-trading system, your ability to manage a particular timeframe on your monitor et cetera.
I myself use multiple time frames which is why I use more than one monitor to manage multiple timeframe. Simply, if I get a trade signal on the 1min chart...I take it. Just the same, 15mins later and I get another trade signal on the 5min chart...I take it. I have on my monitors the 1min, 2min, 3min, 5min, 15min and 60min charts...trying to find trade signals on any of those chart intervals. Thus, I'm not married to one particular timeframe.
My point is if you want "more" trade opportunities...you're going to need to follow more than just one timeframe and learn to manage them on your monitor(s).
Mark
Having recently transitioned from EOD trading where I used daily charts to intraday trading, I've been giving a lot of thought to the right timeframe (1m, 5m, 15m, CV, etc.) for my charts. After much experimentation, I'm coming to the conclusion that it's best to use a chart resolution where your expected trade duration for the type of move that you're trying to capture will typically be in the range of 2-20 bars. If you go below that (e.g. 1m chart while trading multi-hour swings), you'll find legitimate reversal patterns forming on the chart, which would rightfully put you out of a trade much sooner than with higher timeframe charts. That's not to say that you shouldn't fine-tune your entries/exits with a lower timeframe chart or confirm key support/resistance and trend with an even higher timeframe chart, but the key entry/exit decisions seem easiest on a chart where your trades have an average duration of 5-15 bars.Is this observation consistent with the experience of other intraday traders?
-bbc
-
It really depends on the type of trade one is. Putting on a swing trade (overnight holds) or position trades (several weeks)...yeah...a walk away monitoring of a trade is ok. However, for day trading purposes...I can't imagine nor met anyone that was consistently profitable on the Russell Emini TF futures doing walk away as the primary approach as a day trader.
Thus, I myself as a day trader only do walk aways whenever I swing trade or position trade but rarely ever for day trades. Remember now, we're talking about the Russell Emini TF which is a volatile trading instrument. Yet, I do understand if a day trade position has moved strongly in our favor (big profits) and the day looks like it's going to be a trend day...yeah...set the trail stop and walk away but that's a rare type of day trade. I've done such only a few times this year but only after the position had gone in my favor more than +7 points and when I felt the trading day may continue developing into a trend day without any deep pullbacks.
Simply, walk away from a day trade position has never been a goal in my trading plan nor do I believe such can be consistently applied profitably a part of day trading. In fact, if a day trader is strongly considering "walk away from a day trade position"...that's a day trader that will better spend his/her time and energy in learning how to manage the discipline, stress, emotions of a day trade.
-
Any Russell eMini traders finding success day trading the Russell these days? It was tough going for me a few months ago but it seems to have really come alive lately. I'm curious how traders are doing with it. What timeframes, objectives, etc. I like the 377 tick chart with my strategy.ICE Russell 2000 Emini TF is sensitive to volatility. Thus, that "come alive lately" you saw is due to key changes in volatility.
Time frames - 1min, 2min, 3min, 5min and 15min on a multiple monitor setup.
Objectives - Every day is different especially when volatility changes
-
Yep, I have seen the same thing on the ES which surprises me given the extreme volume. Like today, I had an order to buy at 1102.5 (prior low) and I couldn't get filled on 1 contract after several failed "touches" so I moved up 1 tick and got filled. But on the Russell with far less volume I seem to get filled almost instantly most of the time...You must backtest your method on all futures markets to determine which specific market your method produces the best results. With that data...you can determine which trading instrument to trade. Thus, it's possible your method is more suitable for another trading instrument in comparison to the Emini ES. In addition, the goal is to be profitable. Therefore, it's not uncommon that your backtest results will reveal that you should be trading another trading instrument that's not your preferred market for trading (e.g. your method may perform better on Oil CL futures in comparison to S&P 500 Emini ES futures).
My point is that too many newbie traders follow the herd via getting married to a particular trading instrument without backtesting to determine if their method will perform better on another trading instrument in comparison to the Emini ES.
Never get married to a particular trading instrument because if you're trading something you shouldn't be trading...the divorce will be ugly (e.g. account blow up, not reaching profit goals). In fact, the few profitable traders I've met and watch trade in person...they all are trading something that's not at the top of their list of favorites...they are trading something because it generates the most profits along with allowing them to reach their profit goals.
-
Essentially you are saying that context affects the interpretation of a candlestick pattern. And I think I agree with that.From the perspective of algorithmic/automated trading the challenge is quantify the context.
Thanks for the comments.
Exactly and that's a tough task for a retail home base trader. Also, it depends on what the context is to determine if it can be quantify because some context can't be quantify...rise of the discretionary trader. However, that's where market experience comes into play to compensate for what something else in the trading plan is not able to do with the interpretation of candlestick patterns or any other type of trade signal.
It's teamwork via everything working together to form a trading plan = market experience, market context, money management, position size management, proper capitalization, proper computer equipment, proper trading platform, entry signals, trade management after entry et cetera. Thus, you can quantify some aspects of a trading plan and depending upon the trading day...one aspect in the trading plan will be more important than other aspects in hindsight.
Simply, technical analysis and it's subgroups (e.g. Japanese Candlesticks) are just one chapter in the book of trading...each dependent upon the other to make the few profitable if the pieces of the puzzle fits. Yet, there's different trading plans out there which is why some traders don't have a chapter in their book (trading plan) involving Japanese Candlesticks. In contrast, I do have candlestick analysis as one chapter in my trading plan.
Mark
-
Thanks for your comments and taking the time to go thru what I did. Your comments are valuable and will probably guide me forward. A few comments :- My goal is not build a trading system based on candlestick based trading system but understand if they mean some thing. I think this exercise is valuable to build a good and robust trading system. There are infinite number of primary/secondary signals that people use. To test each combination of these signals would be a huge effort.
- I am using a doji after 5 down days as a trend reversal pattern and not in isolation
- Yes, trade management is key. My success rates change quite a lot if I allow my trades to last longer than the next day. I can even make them profitable. But I would like to find a primary signal that gives me 65-70% success rate before I go into optimizing trade management. (may be I won't get there... or... i will)
Hi,
Thanks in replying.
There are hundreds of documented testing performed on candlestick patterns in isolation and your blog results is just another one. You're doing nothing new in comparison to all the prior blogs, websites, magazine articles, forum discussions et cetera. However, that's not a concern because I do understand that you're trying to see for yourself via your own data instead of listening to others that have done the same before you.
There are infinite number of primary/secondary signals that people use. To test each combination of these signals would be a huge effort.
That's correct and you don't need to test them all because that's impossible...just start with one. Like I said to you in my prior reply...you're going to need to sit down and make a decision. You can continue testing candlestick patterns the way losing traders use them or test them the way profitable traders use them. Choosing the former instead of the latter as a valuable exercise to build a good and robust trading system doesn't have merit. That's ok for simplicity (computer codes) or discussion but not ok as an exercise to building a robust trade method. A robust trade method involves a complete trading plan and candlestick patterns is not the only chapter in a profitable trader's book.
I know...I've stood in the past where you're at right now via trying to approach trading via pure science (computer codes). However, if you're going to be a profitable trader...I recommend you make the effort and concentrate your efforts on testing candlestick patterns the way profitable traders use them instead of the way losing traders using them unless the purpose of you're testing is to show how losing traders are using Japanese Candlesticks.
I am using a doji after 5 down days as a trend reversal pattern and not in isolation
That price action definition is not within context. Here's a example (hypothetical) of a candlestick pattern within context (understanding the price action). The S&P 500 breaks below a key support area and begins making lower highs with failed counter-thrusts in between those lower highs along with other key markets doing the same. In addition, the industry group itself involving your selected stock is getting hit with negative news and then 5 consecutive down days appear. This is an example of within context because you understand the price action, able to explain it. Thus, to be looking at bullish candlestick patterns via a code only...you'll be ignoring the "within context" information I just revealed...you're testing candlestick patterns in isolation. (I have stood in the past where you are at right now...I know exactly what you're trying to do).:hmmmm:
Further, if you truly understood the price action and are not using candlesticks in isolation via some analytical computer code...you should have designed a code to look for and test the reliability of dojis as a bearish continuation signal after 5 consecutive down days and then compare the results to using dojis as a bullish reversal signals (I'm going to give a little via pretending that a doji is a reversal signal even though it's an indecision price action)...thinking outside the box.
Reminder - each candlestick pattern has different sub-groups.
Here's a real example of within context via your GNW Financial of October 2008 chart at your blog instead of my hypothetical explanation above. Your code involves a handful of intervals only and your posted chart of GNW is a financial stock during a time period everybody was running scared in the overall financial crisis along with the fact that GNW had fallen from $25 price range to $3.50 price range...your code explanation with zoom-in chart is an example of using candlestick pattern in isolation while ignoring the facts I just explained (that within context information). Therefore, you're trying to let a code define the price action instead of you understanding the price action prior to the appearance of any candlestick pattern. Should you been looking or testing for bearish continuation signals or bullish reversal signals or both (thinking outside the box)...comparing the reliability information of each for "within context" situation I just explained about GNW ?
Lets now talk about the AIV chart at your blog because it represents a Bullish Hammer "continuation" pattern. Instead, you in error called it a Bullish Hammer "reversal" pattern. There are several subgroups of hammer patterns called continuation hammers and reversal hammers. Your AIV chart falls under the continuation sub-group category that can be broken down further into different variations because I took a closer look at AIV chart via my own data provider with many months of price action in comparison to you zoom-in chart of a few intervals in isolation. AIV is clearly in an uptrend with obvious support levels when a small retracement appears involving that hammer line. Had that hammer line appeared below any key support areas along with the uptrend having a key change in supply/demand...that's when you can designate a hammer pattern as a "reversal" instead of as a "continuation" (this is something you aren't going to read in any books nor learn from codes of losing traders trying to build a robust system).
Like I said, there are problems with your candlestick pattern identification but that's ok because you did say you are new at this and you're obviously approaching this via codes only (in isolation) as seen by those that have done in the past what you're currently doing. Therefore, I think a good exercise for you and the readers of your blog is for you to show zoom-out charts that show many prior months of price action before your candlestick patterns along with those zoom-in charts that only show a handful of intervals in isolation without any "within context" information. The zoom-out charts will encourage your readers to seek on their own the "within context" information that may agree or disagree with your analysis.
Mark
-
Trading +20 years and most of that profitably.
#1 rule for me is to "never ignore key market events" (e.g. international economic calendar, global events, breaking news and closing times of other key markets).
-
I am trying to find out if candlestick patterns are any good at picking out short term trend-reversals.Based on what I have done so far, they can pick next day trend reversal with a success rate of 45-52%
Hi guruji,
I've been studying Japanese Candlesticks since Nison and many others released their first books on the topic along with coding, backtesting, trading, writing topics about anything involving them...many know my former user name as NihabaAshi.
I have never met a profitable trader that uses Japanese Candlesticks all by itself and nothing else.
Therefore, I'm always scratching my head why traders waste valuable time in testing candlestick patterns as such (all by themselves). In contrast, profitable traders that use candlestick patterns are using them secondary or merged to a primary trading system (e.g. s/r analysis with candlestick analysis, intermarket analysis with candlestick analysis).
Also, I can tell via your replies or lack of reply when traders advice to use them in context...you continue mentioning testing them out of context as if within context is not important. Therefore, I will state what others have tried to tell you already...you must understand the price action prior to the appearance of any candlestick pattern signal to get within context. That means you should have already determined if the price action is bullish, bearish, price noise or whatever prior to your defined candlestick pattern...then only using the candlestick pattern to open a position when the reward is in your favor.
Your backtesting rules at your blog are not within context. However, that's just one problem you have and there are others. For example, base upon what you show in the price action of your testing rules, you don't understand the doji via stating at your blog that conventional wisdom states that its a trend reversal signal. It is not. However, if you meant to say that the interval(s) after the doji can sometimes involve the doji as part of another candlestick reversal patterns...that's true.
* The type of intervals that occur prior to the doji will often determine the strength of the indecisiveness of a doji and indecision is never a trade signal.
* Trade management after entry has a great impact on the performance results. I've done extensive testing in this particular area and have shown that traders taking the exact same candlestick patterns in the same trading instrument at the exact same time can have results vary from 44% - 73% depending upon the trade management rules. Those that had higher (better) trade results had a stronger understanding of the price action in comparison to those that did not.
Simply, you're going to have to make a decision...continue testing candlestick patterns the way most losing traders use them or test them the way profitable traders use them. If you decide on the latter...you're going to need to learn a lot more than just candlestick patterns...involving more time, more work and less simplicity. However, if you decide on the former (continue testing them as stand alone method)...at least understand the candlestick pattern you're testing and its sub-groups because your blog information implies you're still thinking inside the box (conventional wisdom).
By the way, I stopped coding a long time ago but it was useful in that I was able to discover many variations or sub-groups of each candlestick pattern (e.g. there are 15 different types of bullish white hammer patterns and most are not reliable except a few)...reliability determined within context of the overall price action. Therefore, your testing only reveals what some of us veteran traders already know...don't test them the way losing traders apply them.
-
It's important that Jumper understands (I'm sure he does) that there is no "one size that fits all" for the definition of a price action only trader. Also, I myself don't think a definition is important unless we need to label ourselves for discussion purposes.
I myself use second charts (20s and 30s), 1min, 2min, 3min, 5min, 15min, 60min and daily charts as a price action only trader. I tend to go with the lower chart intervals (second charts and 1min charts) during extremely volatile price action and when I don't want to hang around too long. However, if there's one chart interval I've used more often than the others it's the 2min chart and not because it has some sort'uv advantage (it doesn't)...I use it more often than the others out of habit and that could be due to space limitations of my monitors (how much information I want to see).
Important stuff to me are volatility analysis, supply/demand analysis, support/resistance zones, intermarket analysis, japanese candlestick analysis and global economics to prevent tunnel vision. Each one of the things I've mentioned can be broken down into sub-categories and I've used the same thing +25 years except for japanese candlesticks (early 90's). I studied price action for about 5 years prior to my very first trade. I'm not into DOM, tick charts, indicators, moving averages nor volume in my own trading. I'm not saying the stuff doesn't work...I just don't use them and you may see me post charts about such (rarely) in reply to someone that does use it.
Jumper made the comment that "no one is willing to share anything that will actually make a difference".
That's a matter of perspective because I've seen lots of sharing here at Traderslaboratory.com and other discussion forums that some find the information very useful while others don't. For example, I mention I don't use volume. If someone shares methods or trading tips involving volume...it's not going to make a difference for me because I don't use it nor will I be interested in such conversations. However, someone else that does use volume may find the information being shared very useful. Simply, it's really just a matter of perspective based upon our interests, beliefs, experiences about what's useful.
Once again, there's no one definition and every price action only trader I've met uses something different or something with the same label but in a different way in comparison to another price action only trader.
-
There are different types of price action traders...the one commonality they have is they don't use indicators. However, although I don't use indicators, I'm not going to announce they are "completely useless" if I don't want this thread to turn into fight fest. :doh:
As to the percentage of losing traders...I see the same on both sides of town and both sides have simple and complex trade methods.
Regardless, there is no one type of price action only trader. I can name 10 different types of price action only traders. Thus, there's no one definition as in one size fits all because we really have sub-groups. However, if you want to classify us as price action only traders...just say we don't use indicators.
...Would be glad to hear some refreshing honest insights/knowledge about what it actually takes to read price action, what it takes to trade properly, the things that one should be looking out for etc.Learn to understand market dynamics such as supply/demand analysis, key market events et cetera. As to what it takes to trade properly...that should be obvious (e.g. money management, discipline, proper capitalization, proper trading platform, adequate trading equipement et cetera). I'm sure you've heard all of that before...no magic lightbulb.
Mark
------------------------------
Hi,For those of you out there, what ACTUALLY is tape reading, in our day and age? What do you think trading off "price action" means? 1min chart with DOM? Tick charts? T&S?
I have a dilemma, all indicators I have ever used are completely useless, when it comes down to it, they might look fancy in hindsight, but thats about it. So I tend to try to stick to clean charts, 2m with volume and DOM, trading mainly index futs. What exactly is tape reading? Is using a time-based chart wrong for this because of time itself pushing the chart through, so you get a distorted perception? True price action would be something that is PURE price moving by itself, when it wants not being forced to draw empty bars/candles on a time based chart etc? Wouldn't it?
I'm just interested to hear from those who ACTUALLY know what they are talking about, that have the experience, that can share with us what trading is actually all about, most successful traders I have seen, and this is personally, from my own experience, have been traders who scalp or trade with just price action, reading the order flow, watching for the bigger players etc It seems to me that its the 90% that get it wrong that are the ones that use MACDs, RSIs, MAs etc. Does it even matter what method/indicator one uses? It seems as though it doesn't, indicators seem to be of not much use if you ask me, so there has to be something else at play?
Would be glad to hear some refreshing honest insights/knowledge about what it actually takes to read price action, what it takes to trade properly, the things that one should be looking out for etc.
Please dont turn this thread into a fight fest, or a puff your chest up contest.
Jumper.
-
I use contraction / expansion analysis...a sub-group of volatility analysis to identify key changes in supply/demand.
Expansion Interval --> Contraction Intervals (3 minimum) --> Expansion Interval
Each expansion interval is a volatility spike above/below the prior contraction intervals. Basically I want to see a volatility spike (expansion interval sometimes called the alert interval) and then I want to see the intervals after it began to contract as in small in their range in comparison to the expansion interval. Next, I want to then see another volatility spike (expansion interval) that breakout above or below the range of the contraction intervals...the first volatility spike after the tweezer top or tweezer bottom gets designated as the "confirmation" of a change in supply/demand even though the actual change may have occurred at the tweezer top or tweezer bottom.
However, if someone doesn't like contraction / expansion analysis...they can use the range of the tweezer top or tweezer bottom as the change in supply/demand but only after seeing a "confirmation" price action afterwards.
Also, the change in supply/demand doesn't only imply a change from supply to demand or a change from demand to supply. It also implies supply (it's volatility) suddenly spiking or demand (it's volatility) suddenly spiking...all are changes in supply/demand.
Last of all, I often call these expansion intervals as WRB's (wide range bars or wide range bodies). There's other discussions here at traderslaboratory about WRB's.
M.A. Perry
Great addition. Thanks.Can you expand upon how you identify supply/demand areas?? Do you identify them with just the candle formations or in combination with cumulative delta?
-
Hi All,
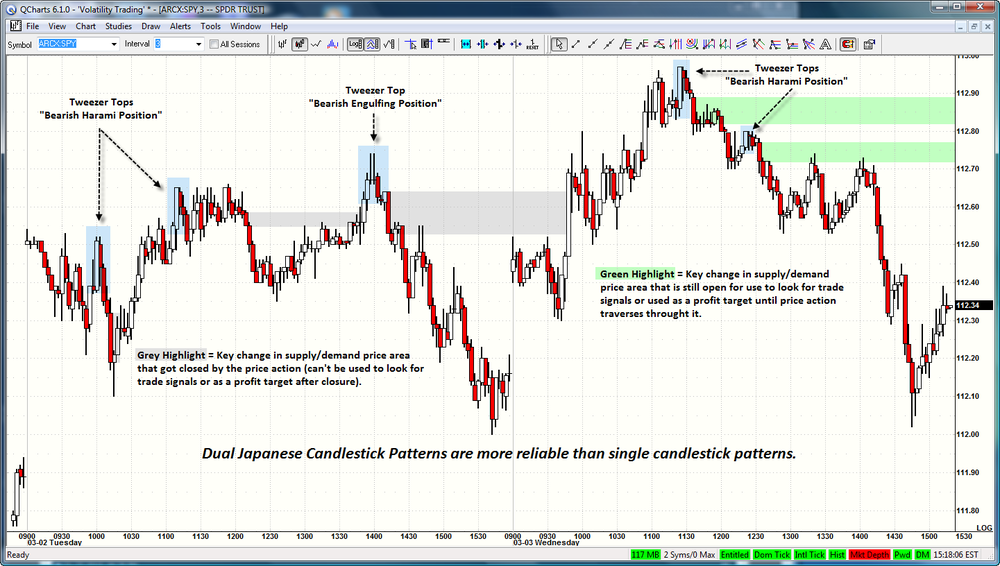
I just wanted to add to the discussion about Tweezer Tops or Tweezer Bottoms that the reliability of them increases when they occur as dual candlestick pattern signals (see chart attachment). For example, a tweezer top with an engulfing price action is a dual trade signal in comparison to a tweezer top with no other candlestick pattern being involved.
Also, arguably just as important, don't forget that these tweezer tops or bottoms contain a wealth of information besides just being a trade signal. They actually setup a way to identify key changes in supply/demand areas that can be used to confirm trades that occur afterwards within those key price areas. In addition, those key price areas can be used as profit targets for trades taken below or above those key areas.
The key areas I show on my chart are all volatility spikes out of contracting volatility. They represent a key change in supply/demand. Therefore, even if you don't trade the tweezer for whatever reason...they can still be very useful to help with managing other trades that occur afterwards.
Expansion --> Contracting --> Expansion
M.A. Perry
(formerly known as NihabaAshi)
-
The life of a daytrader is very personal and any pros/cons will be different from one trader to the next or not in agreement with the pros/cons of another trader.
Here are some suggestions to help those that see it as a disadvantage.
Lonely - We can quickly develop online friendships via the internet (social networking) faster than someone can without the internet. From there, we then decide whom we want to develop into an in person friendship or professional relationship.
For example, I met an energy futures trader online and he was located in Seattle, WA. He made a remark it's a lonely business along with not knowing any day traders in Seattle. I recommended he get a myspace, facebook, twitter account (all free) and be active in interacting on those sites with others via having discussion about what he does for a living, software he uses et cetera.
He did that and within a few months has regular get togethers (in person) with other day traders along with getting a small trading office with 3 other day traders.
My point is that any listed disadvantage can be fixed if the trader is willing to change something in their personal life.
My Pro: Easy to develop personal and professional contacts online and in person.
My Con: Family lifestyle dictates what I trade.

Wide Range Bodies or 'big' candles
in Volume Spread Analysis
Posted
Thanks arpaf. You should contact the forum manager @ http://www.traderslaboratory.com/forums/43199-madmarketscientist/
Hopefully, they can fix that.