
Welcome to the new Traders Laboratory! Please bear with us as we finish the migration over the next few days. If you find any issues, want to leave feedback, get in touch with us, or offer suggestions please post to the Support forum here.


richbois
-
Content Count
89 -
Joined
-
Last visited
Posts posted by richbois
-
-
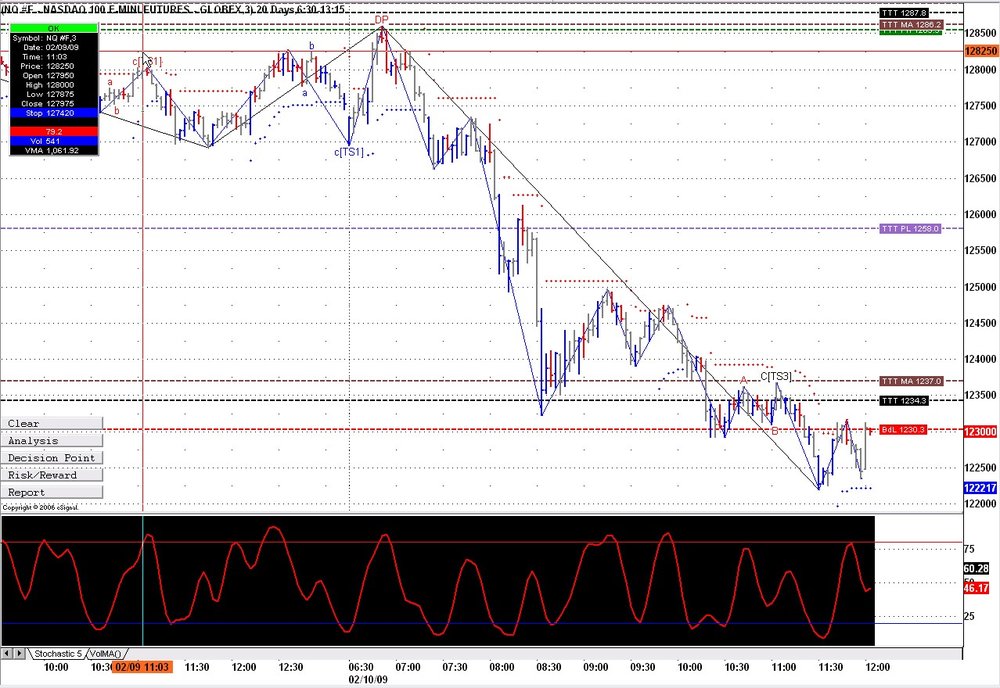
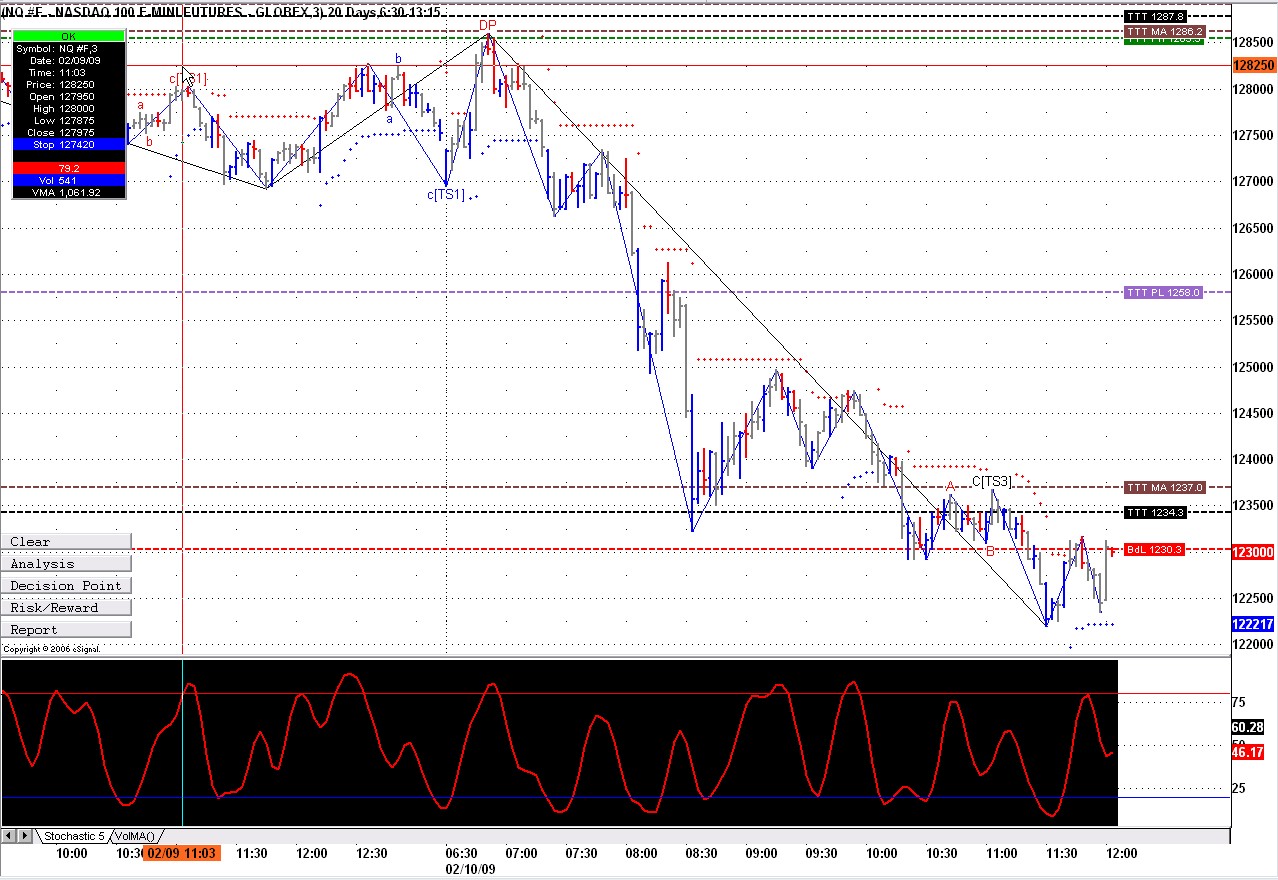
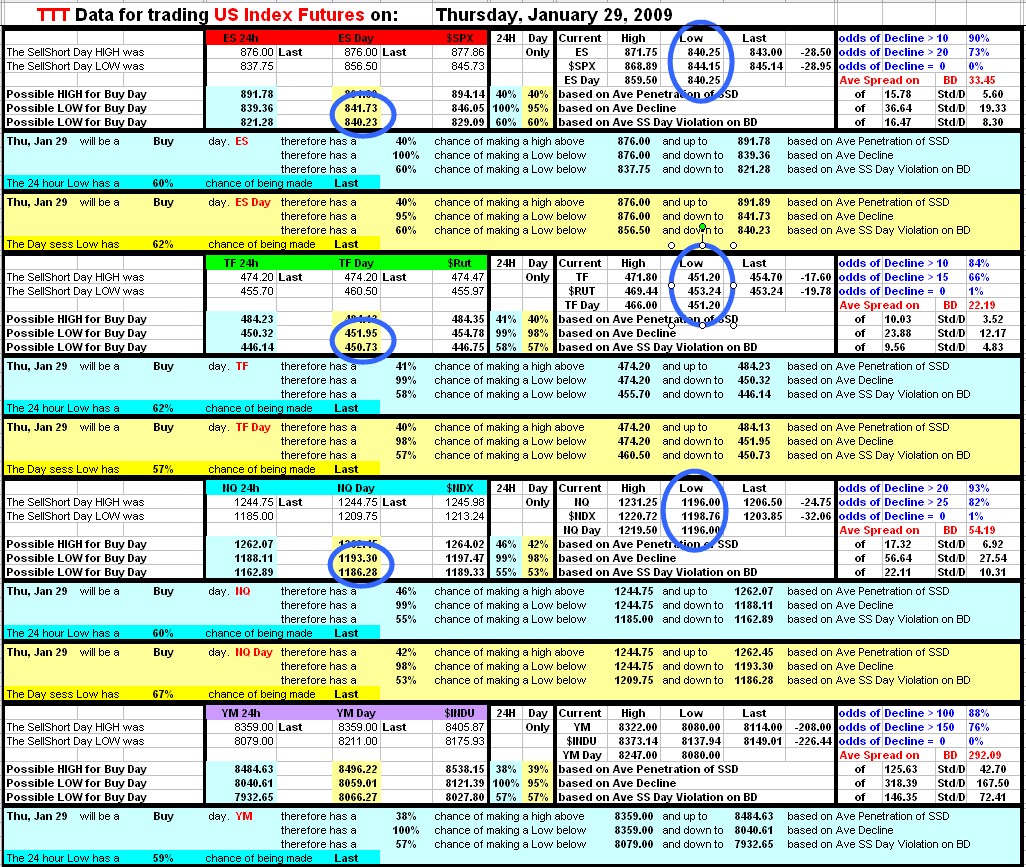
Today was a SS day according to my count and NQ is the best textbook TTT example. We reach the average 3 day rally which was at same level as yesterday's high and failed to go higher. Market reversed and reached the projected lows that offered some support and a bounce just to go lower found some support at the Buy day low and that finally gave through.
And yes Hakuna this would have also been a perfect day to short if it had been a Buy day since we would have needed a decline from the SS day high until a Buy day low is formed.
-
RichExactly what instrument are you looking at? And exactly what time did the high of 2-5 and the low of 2-6 occur?
S&P emini futures ES high on 2/5 at 2:35PM EST and low 2/6 at the open 9:30 AM EST time based on 5 minute bar chart
-
These are the numbers I have for the day session only
2/5/2009 822.50 849.00 816.75 840.25
2/6/2009 844.00 869.25 842.25 868.25
I agree we gapped above the close but not the high of 849 therefore giving us a small decline from the high of 849 to low of 842.25 = 6.75
Isn't that the way we are suppose to calculate the decline.
-
I made a mistake in my typing in post #420 where I typed:A decline zero is simply when the low of the buy day stays ABOVE the low of the previous day i.e. the SS day.
That should read:
A decline zero is simply when the low of the buy day stays ABOVE the high of the previous day i.e. the SS day.
Sorry about that. Hope I didnt confuse too many folks. I was tired.
Glad you corrected that as I know that your knowledge of Taylor is great and I nearly had to re-read the book.

Having said that when you said we had zero decline, do you consider a few points decline as zero or do you go strickly by the mathematical numbers.
In this case all the index futures made some decline however it was very shallow, which by it self also means that the market is bullish.
-
Friday was a Buy day. The concerns mentioned in Thursday night's email to subscribers, that the bullish momentum could produce just a small decline for the Buy day, ended up materializing. TVGR took effect and the markets rallied all day. I don't like picking tops on TVGR Buy days but we had numerous fibs at 868.50-869 and if we add the average range of 33 points expected for Friday.
The low was 836 + 33 = 869. That level ended up good for some quick short scalps but not based on what Taylor would have done.
-
Nice job elovemer
In my book today was a SS day. Yesterday we had a good sell off and the momentum continued today. The markets gapped down tried to rally just to reverse and go test the Buy day lows. We normally should not long on SS day, with just a few exceptions. This trade is one that often works.
We opened at 822.5 and only rallied to 825.50. The Buy day low was at 816 on 24 hour session and 818 on Day session. So at this point it did give us a Positive 3 Day Rally, however it was well below the average of 38 points.
We have a cluster of 3 fibs at 817 to 818 area and the MTP DP. The Buy day low at 816-818. Again we had strong support in that area.
A long could have been taken at 818.25 area with a stop just below the day low of 816.75. A low risk trade.
The market rallied and never looked back until we got close to the previous day high. We also know from the report that the average spread/range for today is 33.32 points. Therefore an exit at 25 to 30 point profit would have been more than acceptable.
That is my take on today.
-
Although I agree with what WHY? posted as his knowledge of Taylor is excellent, I am a day trader and as such I use Taylor as 1 more tool in my box.
If Taylor dictates not to short (or long) on a certain day, I have found the the areas of support or resistance that is produced by my system more often then not produce nice trades. Like today I knew that I had all the possible highs for the day and they came to within a few points of each other. I had average Rally and average Penetration al at the 849-850 area.
Then when I had all the fibs on my charts and get the same area, for me that is a good low risk trade to take.
Even in the email to subscribers last night, I pointed out that these numbers were so close, because that dont happen very often.
I hope that explains my reasoning for the trade using Taylor
-
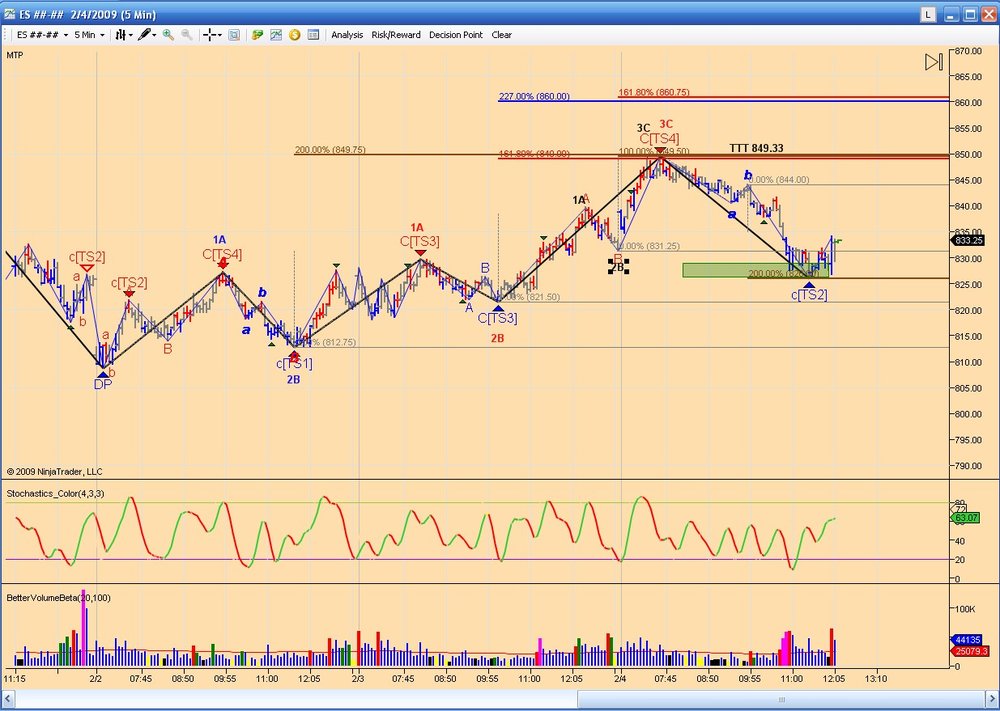
An other nice example to show reversals at 3 differents fib extention and a TS4, right at the TTT projection number to the tick
That decline took us down to the next DP at 826 not a bad trade
-
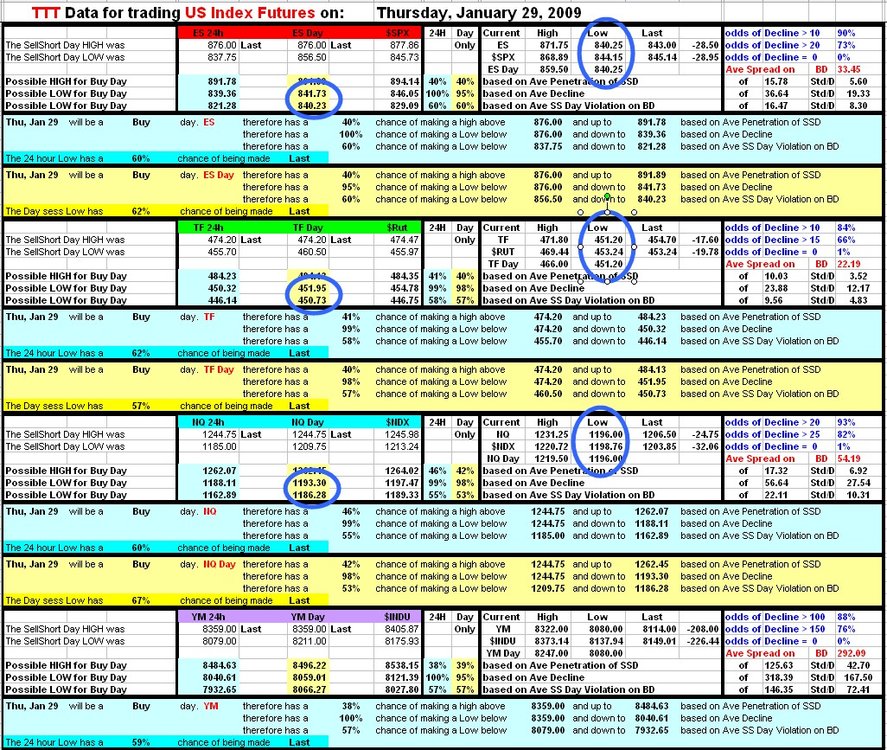
Today was SS Day. As mentioned in Friday's report we had good odds of making it back to the Buy day lows. Although NQ made it and TF came close, today was ok to take longs when we had a chance. Matter of fact both opportunity were nice trades.
-
A new product has been added to the list.
TTT Asia Futures is now available for the HSI and NI225 and soon to be added Topix
Check the website or email me for more info
Rich@taylortradingtechnique.net
-
Today was a perfect Buy day. Since we didn't get our Decline yesterday on the SS day, we did it today. TVGR took effect and carried the markets down to the projected lows.
-
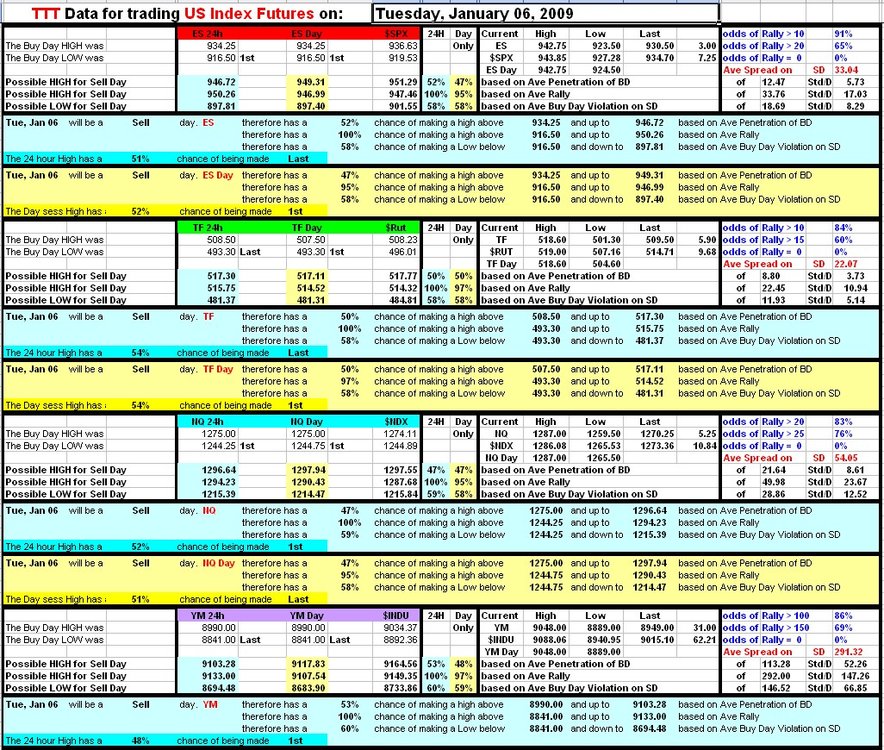
Today was the confusing Sell day. Every one made the projected average rally and tried to make new highs and failed. However they refused to go lower also.
Tomorrow is SS day. Taylor would not be looking to long on SS day and would wait for a test of the Sell day highs to short. The FOMC meeting may be the catalyst that may take us out of this tight range we have been trading in.
-
WHY?actually I was not looking for any info. on the software but if I understand it correctly anybody in this and age who does not have your kind of software and has created a book or if say 3 people have created their books at different times would all end up with a cycle which would not truly reflect what is going on in the market ie. manipulation., hence taylor method would be invalid. am I right.
I have reframed the question in the previous post,
""Having studied the posts on this thread and some taylor, I find the following very confusing: both you and richbois have mentioned that the book can be started by taking 10days data and marking the lowest low and go from there.
If 3 people started such a book on different days or months they are each going to end up calling a particular day either as buy, sell or ssday, hence their strategies will be different for that day. for example tomorrow each would have a different day.
1. How is this going to work out as each has different scenarios to apply.
2. From posts here and in taylor, the market cycles are explained in terms of market manipulation by those who obviously have deep pockets to do that, with the above 3 differing days for each trader, it just doesn't make sense. as the cycle that each of the trader who created the book at different times is understood to be different but the manipulators are not changing according to who created the book.
perhaps you can comment on this.
Yes this is what Taylor explains in his book and you are correct that 3 different cycle could be in place based on when you start your book.
When I started my ES book I used the 10 day low principle. I then looked at the last 30 days and saw that it was the same low. Later in creating averages and studying the cycles I found that there is high odds for a Positive 3 Day Cycle. I then put my cycles to the test and found that the cycle created by the January low of 2008 was the same as the one that my highest Positive 3 day Rally Ratio would give.
Since then, when I create a new book for a different instrument, I use the HIGHEST ratio I get by cycling the data through the 3 permutations.
This issue of having 3 possible cycles for the same instrument as been a bone of contention for ages. That is probably why Raschke, Angell, Why? and myself came up with ways to deal with it. Some prefer to adjust the cycle as needed, I prefer to leave mine as is once it is started.
Since I strongly beleive in the Positive 3 Day cycle, as this confirms what Taylor was preaching, that the markets are manipulated. My results prove that most instruments have a 80%+ Positive 3 day rally since January 2008.
Most markets have dropped 50% during that period and I still get Positive 3 day Rally, I think that is a good proof.
Also I have numerous other averages to confirm the cycles. Obviously I may have to keep some private not to destroy the business I am in.
I hope that helped.
More info maybe found at http://www.taylortradingtechnique.net
-
3) On a SS day only short selling is allowed. No longs.
I do agree with you on what Taylor said, however in my discovery of the Positive 3 day cycle, I found that we can sometime Long on the SS day.
If the SS day opens below the Buy day low we do have very high odds of getting a rally to atleast the Buy day low, at which point stops have to be thighten.
Just my

-
I am finding the pre 11.00 am stuff a little difficult to see - even with the benefit of hindsight! The SS short day closed strongly down (or weak). Had that not been the case we might have expected a higher open. We got one anyway I could not find where T talked about that specific senario. Price did open up and rally briefly is that the basis for the first long?I do see a buy based on the fact that on the SS day we had a good sell off with close near the low meeting the criteria to be looking to buy at or a little below the SS day?
Cheers.
Hope
Yesterday we gapped up and then reversed to close gap. Markets tested the SS day lows and as per Taylor, a faillure to take out that low was your signal to go long. At the end of the day we had accomplished the average rally and therefore was a good place to close position as WHY? said. One could have held on overnight for a few points more but would have givend back nice profits if held this the open.
Overnight ES hit my Recap MA number of 842.75 and reversed maybe due to the fact that we have 58% chance of making a lower low today. At the moment we have TVGR taking effect so we may need to watch any longs carefully.
-
Is Europe in step with the USA? With the holiday and stuff. A real nub question is it acceptable to start a book from a major high (obviously starting with a sell day there)?I did scan the book this weekend. For me it's going to need going through again with a notepad. I am a bullet point sort of guy and while the information did not seem difficult to grasp it seemed quite tangled up, it seems kind of hidden in the walls of text. It does seem to me that it should be possible to boil it down to a dozen or so principles or even rules.
Yes the European Markets are on the same Cycle as the US at the moment, and the holiday didnt change the US cycle since we traded on that day.
-
I my way of looking at Taylor, Yesterday 1/15 had an 85% chance of gettting back to the Buy day low of 857 (Globex Session). After reaching the projected lows, It gave it a go but didnt reach it during the normal session. It reached it overnight and when we opened today we had a gap up above the SS day high and knowing that we need a Decline and that occurs 95%+ of the time, short was the only option, at least until a decent decline is in.
-
To answer how I got on the cycle I have.
I started my trading book on ES last year at the end of January and used as per Taylor the last 10 days and found the lowest low that being Jan 22, 2008.
rest is history.
Today when I start a new book I use a different method then that prescribe by Taylor but it often results in the same cycle.
My method today is that I take as much data as I want (usualy 6 months) and try the 3 possible scenarios with the 1st day of data. The cycle that will give me the highest ratio of Positive 3 Day Rally is the one I choose.
If I was to start a new ES book today I would end up on the same cycle and since I have over 100 instruments to follow and new ones to create every so often, I found that this method has worked the best for me.
-
In regards to Holiday I personally have a different view.
In today's global trading and having a Globex session the US Index Futures gets traded on Holidays at least for part of the 24 hour session. Therefore these days are part of my count and the 19th will be counted.
I tried not counting them in the past and every time I did that my cycles were out of wack until I put them back in. So if they are traded for a portion of a day I include them in my count.
As far as starting your own book we could have 3 different persons starting a book at 3 different time and all 3 would have a different cycle. So for me that is not as important as knowing how to trade any given Buy/Sell/SS day, based on the price action of the previous day.
Taylor traded differently than most of us do. He kept positions for 2-3 days and most of us are day traders and dont keep positions overnight. Therefore we use Taylor's principles and adjust them to day trading. As WHY? said we could be short on Buy days and long on SS days it just depends on how that particular cycle is progressing.
Like we said Taylor didnt have the luxury of a computer, I found that if you put statistics and averages, on all the calculations that Taylor did and included in his Trading Book, you will notice that it will help you in trading with the right bias for that particular day of the cycle.
For instance if you know that on a Buy day, according to your cycle, you have over 90% chance of getting a Decline from the SS day high, and that SS day closed on the highs for the day, why not short until the Buy day low comes in.
This example is just one of many that can be derived from a good statistical Taylor Trading Book.
Anyway that is my 2 cents.
Rich
-
Today was a Sell day and as such we did get the usual see-saw day. TF made the first objective just to pull back and then nailed the second one.
-
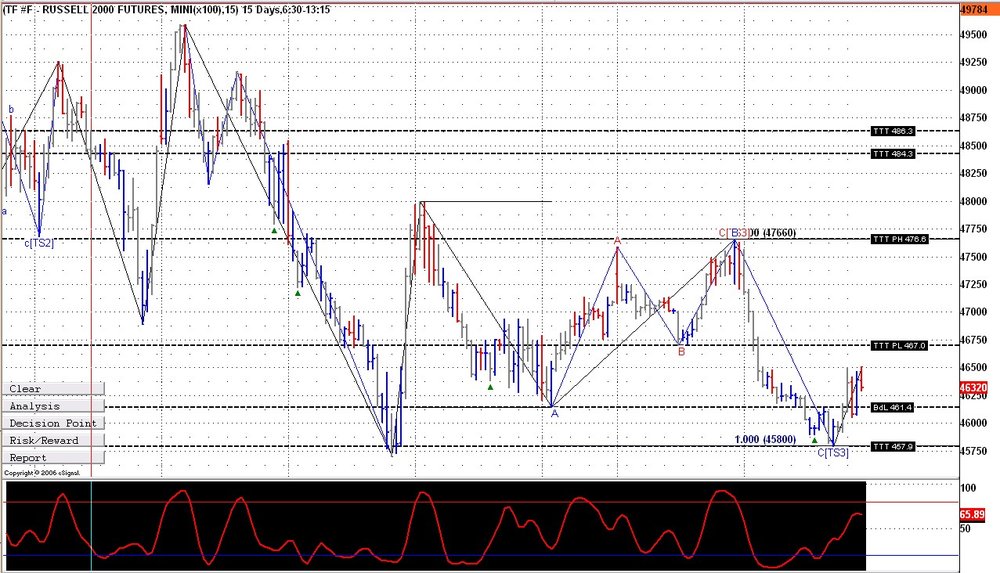
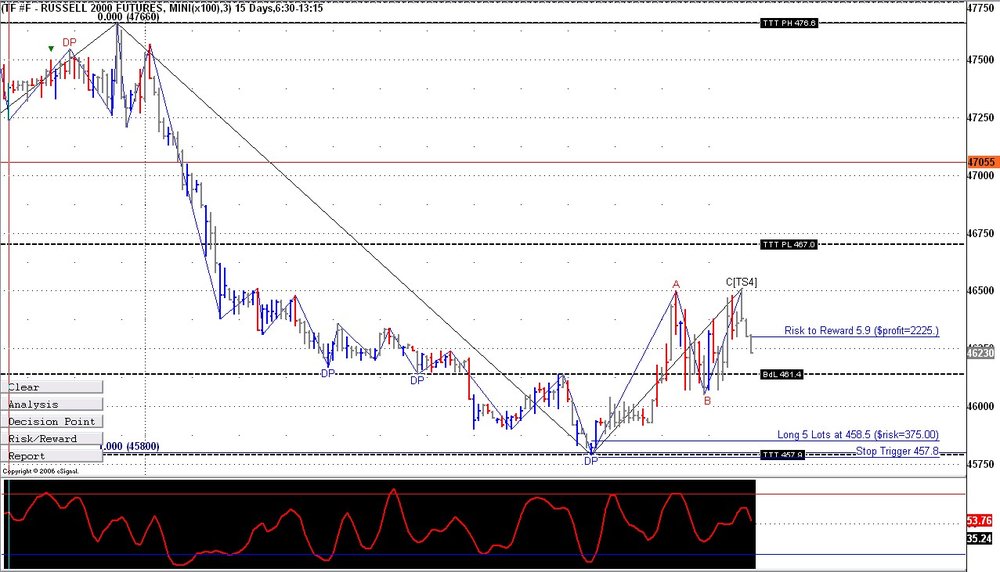
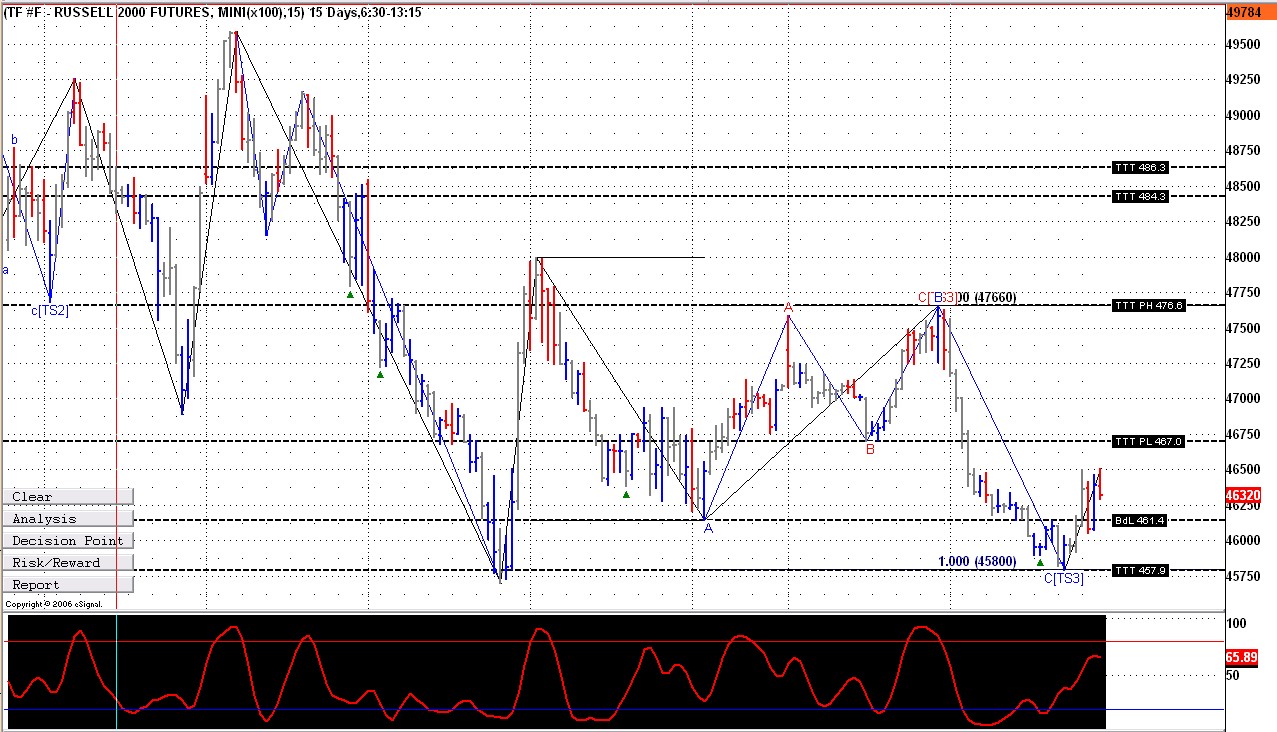
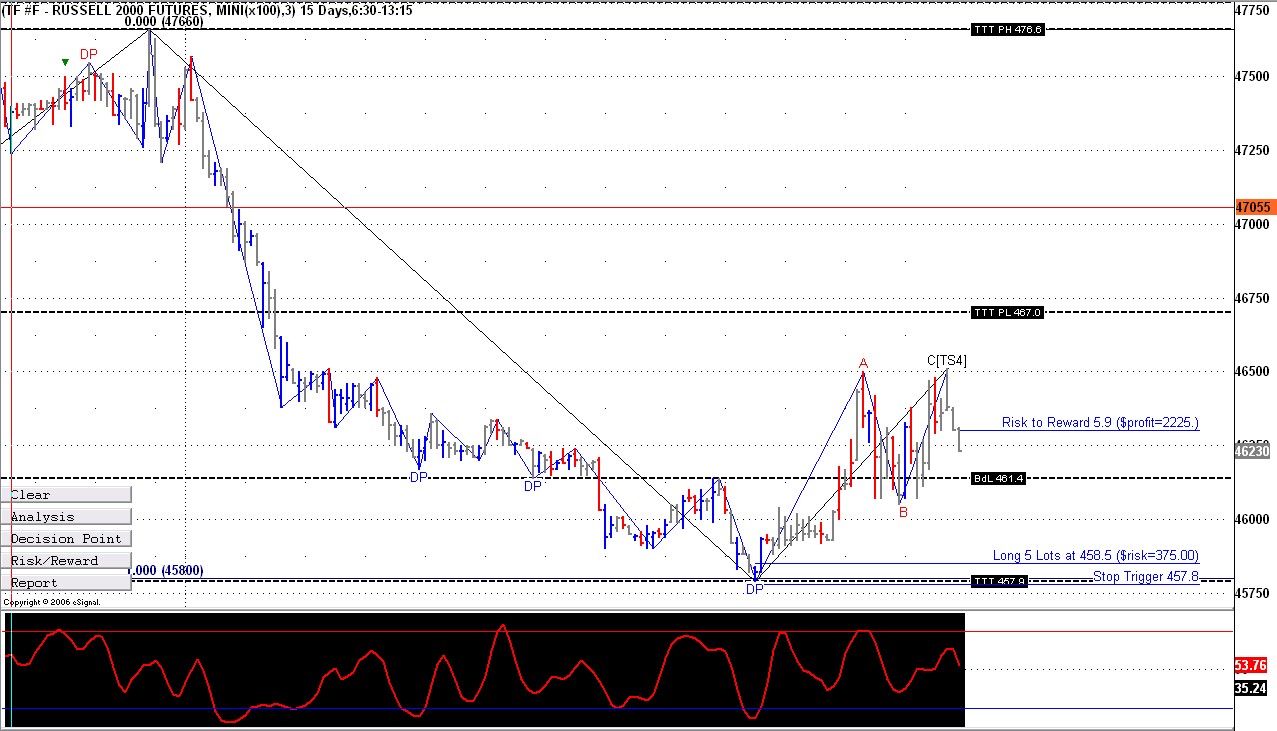
TTT and MTP did it again as TTT nailed the lows on TF with a DP signal on 3 minute chart and a TS3 on the 15 min with wave A = wave C. We also had lots of divergence on the 15 min chart
Nice reward with low risk even if you only got part of it.
I hope one and all had a great Christmas and wish you a very Happy Healthy an Prosperous New Year 2009
-
Today was a SS day. As mentioned in last night's report we had 85% odds of getting back above the Buy day lows. All the Futures except NQ made it however the Indexes didn't.
-
Today was a Sell day. The 60% odds did favor making lower lows and we did. Markets reversed when we got close to the Recap MA numbers
-
Today was a Buy Day. Markets were mixed as TF and NQ managed to make higher Highs and YM made a Lower Low. ES and YM achieved their projected average Decline.
Have a great weekend


Taylor Trading Technique
in Swing Trading and Position Trading
Posted
Today was a Sell Day. Was it confusing enough. We gapped down at the open below the Buy day low. Markets reversed and got back above these lows. When YM finally got above the Buy day low all markets reversed down. Coincidently when ES reached a new DP low, News came out and markets rallied like there was no tomorrow. This had to happen today or tomorrow as we needed to get back above the Buy day low on SS day to give us a Positive 3 Day Rally.