
Welcome to the new Traders Laboratory! Please bear with us as we finish the migration over the next few days. If you find any issues, want to leave feedback, get in touch with us, or offer suggestions please post to the Support forum here.


richbois
-
Content Count
89 -
Joined
-
Last visited
Posts posted by richbois
-
-
Nikke I was looking at a similar thing, however I passed as after the recent run up, I feel I would prefer more of a pullback or ABC down, using longer term bars eg; 15min as it starting to do now. While I dont know enough about TTT - it has made me think more about what I would call marginal trades in terms of the previous days context.Good thinking with TTT on a SS day and it failed to make much of a higher high.
must say it was not a great SS day either.
-
Hi Fellow Traders,
Thales asked if I would start a thread on the Taylor Trading Technique here at TL where those interested in incorporating the Taylor Method into their trading could share their experiences, ask questions, and learn from each other.
In the interest of full disclosure, all should be aware that I do offer a service based on TTT. Basically Taylor showed us how to start our trading book for an instrument, I took his method, added a few of my own refinements, and offer a nightly spreadsheet based on that information. However, this thread is not meant to be a solicitation for my service, nor is to be limited to those who subscribe. This thread is open to any and all traders either already use Taylor's Book Method, or those interested in learning more about the method. All are welcome here. I merely wish to help those interested in Taylor, and discussing the way Taylor should be used.
One thing is of utmost importance - Thales and Rigel have mentioned in other places here at TL that most traders who try and fail to succeed with Taylor do so because the trader makes continued attempts to "re-phase" or "shift" the cycle to "fit" current price action. I want to make clear that according to Taylor, the cycle does not shift, and therefore, we want to keep the discussion based upon the cycle as you or I have in our trading book, and we do not want the thread to turn into a debate about changing the day of the cycle. We can all have a different day and find a way to trade it profitably. That's right, we can have two different trader's trading the same instrument using Taylor, and yet each may be on a different day of the cycle. The reason this can be is that Taylor, in the end, is based upon following the market as it cycles from a trading cycle low to trading cycle high, so the focus is always on recent daily highs and lows. There is another thread here at TL on Taylor where people debated the shifting of cycles. If you subscribe to the notion that Taylor's Method is better when a shifting cycle approach is applied, then may I politely ask you to refrain from posting here, and instead participate in the other TTT thread.
So lets use this thread to discuss Taylor as Taylor himself understood his Trading Technique.
-
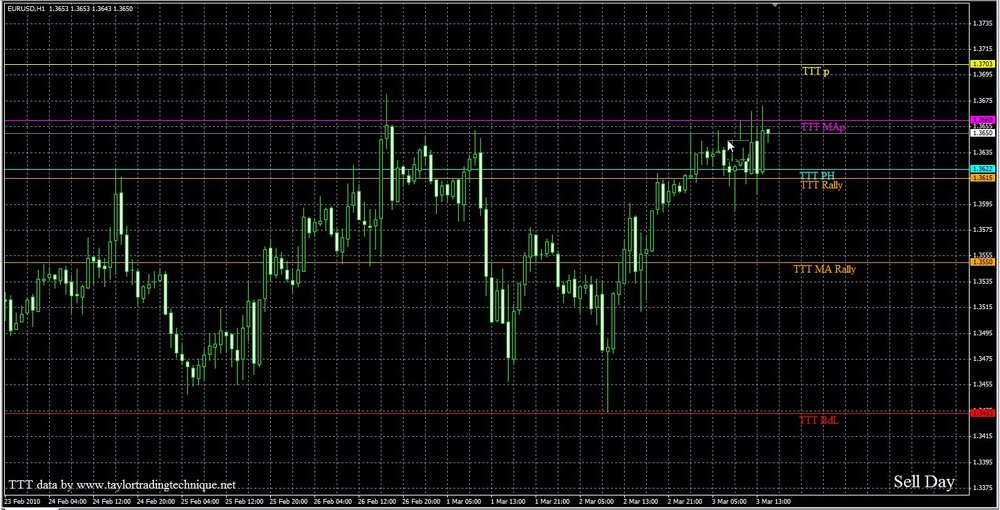
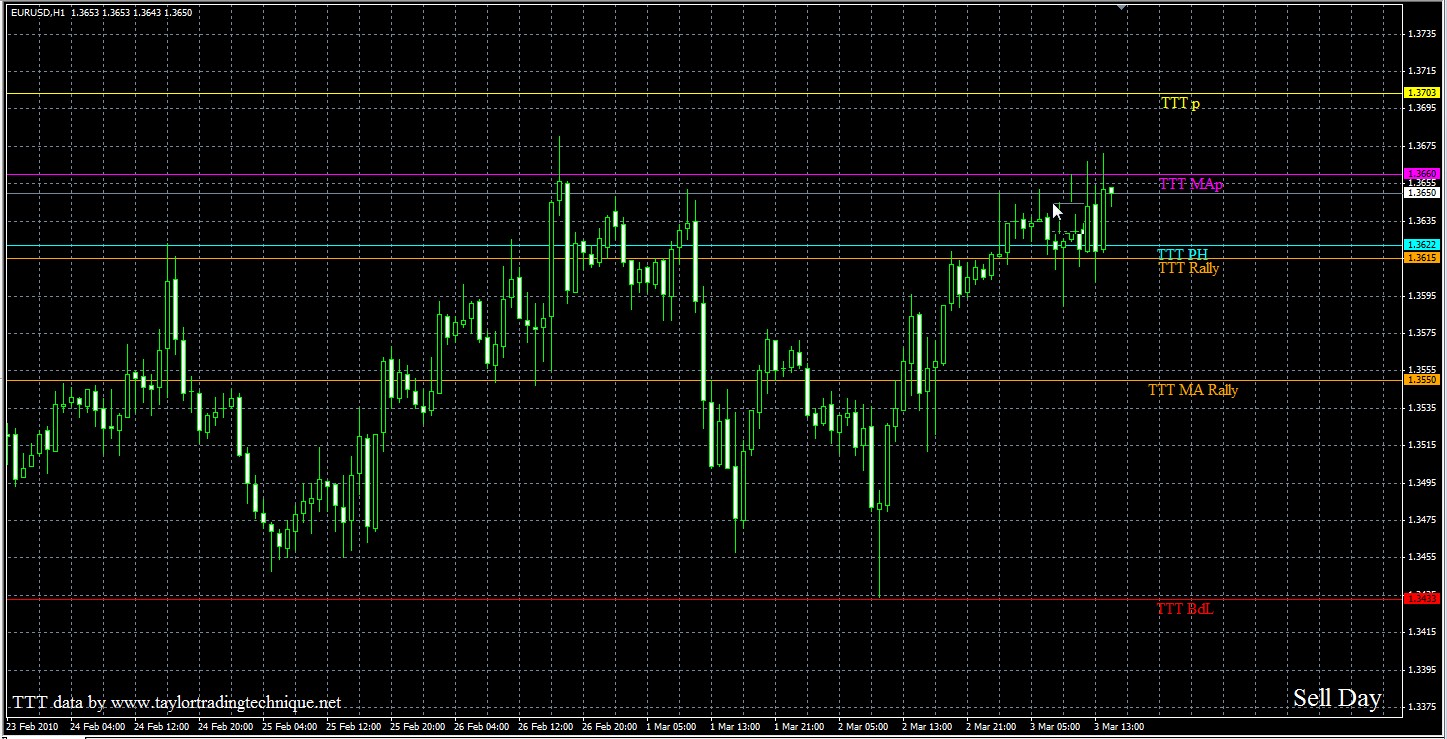
Well 1.3660 offered resistance for quite a while and they didnt bother stopping at my second level of 1.3703
-
my reply is definatly in hindsight since I dont trade FX very often. But let me explain why TTT may have help take the profit at 1.3655.
Today is a Sell day and as such we should expect a rally that started on the Buy day low (yesterday) at 1.3433 I have 2 different ways to calculate what the average rally should be.
One is based all the data since Jan 1, 2008 and that TTT rally would take you to 1.3615
Second is based on data of the last 20 cycle or 3 months Called TTT MA that is at 1.3550
The rally was mostly accomplished on the Buy day. The Sell day opened at the TTT Rally level and tried to continue higher causing a penetration of the Buy Day high.
The average MA penetration takes you to 1.3660 and the regular to 1.3703
So for me TTT would dictate that some profit should be taken at the 1.3660 level
Also most Sell days where the rally has been mostly accomplised on the Buy day, ends up being a confusing day. What I mean by confusing day is that they are usualy see-saw days.
I hope that helps expalin how I would have used TTT in this situation.
-
Thank you guys I may have to do a day session page in my book to see if it makes a difference
-
question for the OIL traders
do you use the full 24 hours of data or only the pit session which I believe is from 9AM to 2:30PM EST
Thanks
-
I wrote a small document tittled The Guide to Trading TTT E-Books. My English is a little better than Taylor's (at least I have an excuse as English is my second language)

I believe that it is a usefull brief resume of Taylor's book.
If any of you is interested, please email me at rich@taylortradingtechnique.net and I will be happy to send you a copy.
-
well, you are, how can I put this delicately .... you are, you see, to be blunt, you are a vendor ....Just kidding richbois ... as far as vendors go, you're ok in my book.
You need to subscribe to a thread to get notices. Go to thread tools at the top of the thread, and make sure you click subscribe. If you already are subscribed, then you need to go to your user control panel, and make sure you select the option that allows for email notifications ...
Best Wishes,
Thales
or maybe putting my new email address would do the trick :crap:
-
I would be more than happy to answer questions on TTT if you guys want me to. I am in Europe at the moment so we will have delays due to time zone difference.
I also find it hard to post and trade at the same time, most of my trades are short and sweet and therefore need my full attention. I must say that I admire Thales for being able to do that.
I also heve a question. I use to get email notifications of new posts on threads and for some reason this is not happening lately does anyone have a clue why
-
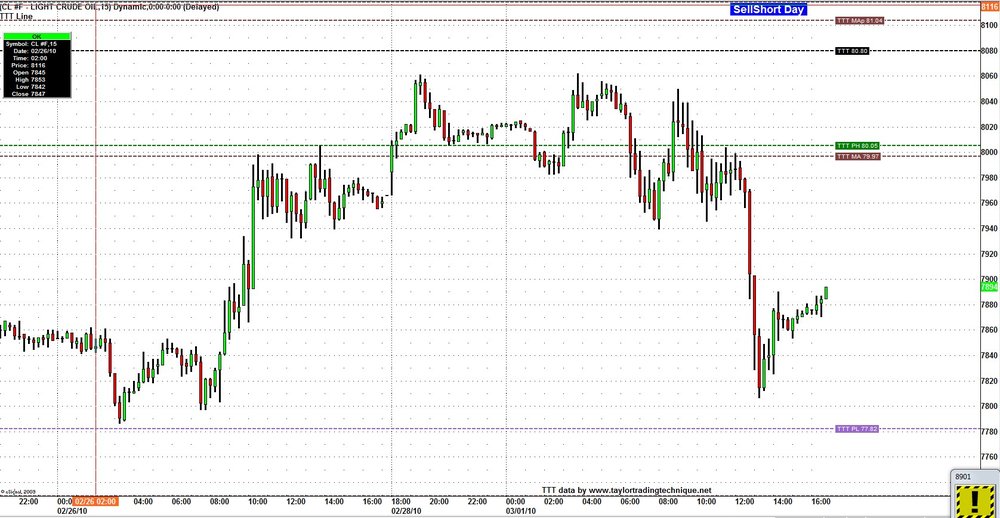
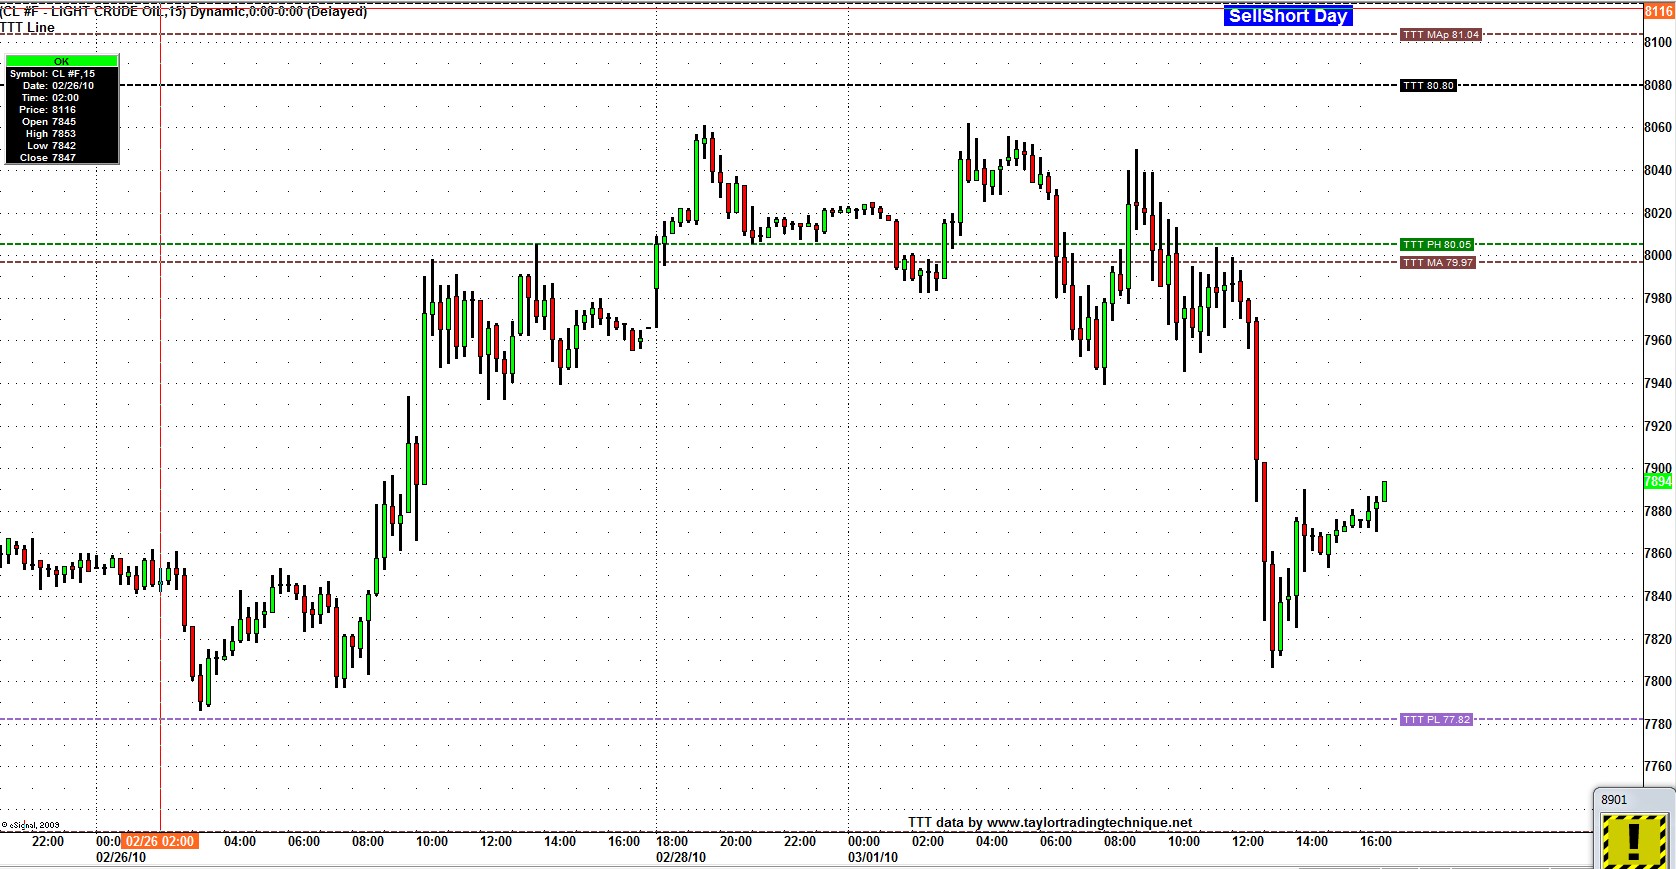
hey guys did you ever try the Taylor Trading Technique on CL
It was a heck of a nice SellShort Day and if you missed the entry at the 1st high there was the second high and you missed that one too you had the 3rd just a bit lower.
2+ handles was not so bad
Sorry Thales I had to say something about your secret
-
Agree it's looking weak and your buy day low is not much of a target- it could go to mid 20's lows of last week and at most 935 resistance but i doubt it's got any chance. I don't want to be a buyer with this breakout short from the recent high sideways range and i believe that the smart money is selling.If so,(and it will be interesting to see weds what happens), then support levels will mean nothing as you will get capitulation and more momentum.If weds ends near a high i would be looking to short early thurs as that would be my next sort day in the cycle.I don't believe this will be more than a pullback and 1000 is more likely to get hit before march low but these bear market moves always go further than you expect-the recent rally a case in point.
using TTT I dont think that far as 1000 or 666
tomorrow being a SS day (based on my count) my 1st resistance will be the Bd Low and then 924-925 area (today's high) and if we get an average penetration 935 area.
if by any chance the bulls decide to wake up my next average 3 day rally levels is 945-952 ( Not holding my breath on that one)
Having said all that, longer term I too believe that we should get another push higher
-
Am i the only one left:confused: I had today as a short sell and as you know from my pevious post i was short,expecting some unwinding from the recent 956 top which finally happened today.(though,as usual it was best to be already short from last week as after the initial drop it was mostly sideways). Sticking with my R-10 multiples (see prev chart) short targets from 956 high/946 fri close,for today were 926 (hit) 916 (no doubt coming to a chart near you soon and 912 (elliott wave support) is still in play).There was also an outstanding gap below at 919.1-923.2 from may 27 which we all but closed today but the rally from there was weak and i would not consider a small reaction long play until around 912 at the moment.(cautious at that).tues is buy day and futures tonight are barely in the red so expect a mixed open as probably traders consider how deep this pullback might be.I dont see us testing march lows at 666 just yet- a pullback then a shot at 961 and levels up to 1000 would suck in retail weak hands.That would be the ideal scenario for another panic plunge that would be needed to end this bear,But i.m sure there's many twists and turns yet.
If nobody else is gonna join me here i might just stick to TA thread....
I like your R-10 theory and today we went to 906.
I use something a bit different which is based on Gann's square. Based on the high of 957.50 I get R/S every 7.75 points at the moment. that would be every 22.5 degrees. If I use 30 degrees I get 10.25 points which is close to yours.
As far as TTT is concern we are on a different cycle. I had today a Sell day. We had a very small rally and closed below the Buy day low. That is not good for the bulls but we do have good odds of making it back to atleast the Buy day low by the close tomorrow.
will just have to wait and see.
-
For those of you that are tired like me of this pissing contest and want to discuss the Taylor Trading Technique, you are more than welcome to join me on this forum. Day Trading Forum - Taylor Trading Technique
Yes I am the moderator and all of you know I do have a business. One thing I don’t do is put pressure on people to take or not to take my services. There are contributors on my forum that are not customers and we have nice exchanges.
It would be great if we could all get along here but it looks like it is not going to happen. This is probably my last post here as I hate wasting time reading posts that are just :crap: .
This was a great forum and I found some great explanations by Dogpile, Frank, Why?, and many more. Frank has brought comparisons between Taylor and Market profile and now brings statistics on the time of day when highs or lows are made. Blowfish wants to discuss price action, etc. All these discussions are helpful and could be useful. However a lot of the last exchanges have been useless.
PS. As I was writing this post, I just read ThalesTraders post and that is what I consider constructive.
-
Thank you all for the kind words.
Nomad
The projected lows as per my TTT were ES 881 and TF 475.5 for 05/21
You all have a great weekend
-
Chapter 1 page 10
It is a fact and the records show it, for many years back that the market has a definite 1-2-3 rhythm, varied at times with an extra beat of 1-2-3-1 and at times 5, these figures represent days. The market goes up 1-2-3 days and reacts, the 4th and 5th figure is the variation when it runs that extra day or two on the way up and on the way down in both Bull and Bear trends. This beat of the market subject to these occasional variations occur with surprising regularity, so it seems that the same methods of manipulation used in the past are still used today, that is of buying and then selling every third or fourth day in an uptrend and reversed for a downtrend and this action the book records very faithfully.
We consider 3 days as a trading cycle—the 4th and 5th days are the (1st) and (2nd) days of a new cycle. We use the 1st day for buying and the 2nd and 3rd days for selling.
Therefore the cycle does not change but only the way to trade it.
-
Frank,Wonder if you have made a study of failure to penetrate Buying or Selling Objectives, for in Taylor's time they occurred 40% of the time.
Part of my statistics say that in the last 19 months, since this bear market began, We have more Violations than Penetrations. This fluctuates based on the day of the cycle, however 55% of the time we had Violations of the previous day's low , compare to 45% of the days we had a Penetration of the previous day's high.
That makes sense considering that we have been in a bear market.
I would anticipate the opposite to occur in Bull markets and I can see that holds true if I use only the last 20 cycles.
PS: these stats are based on ES day session only
-
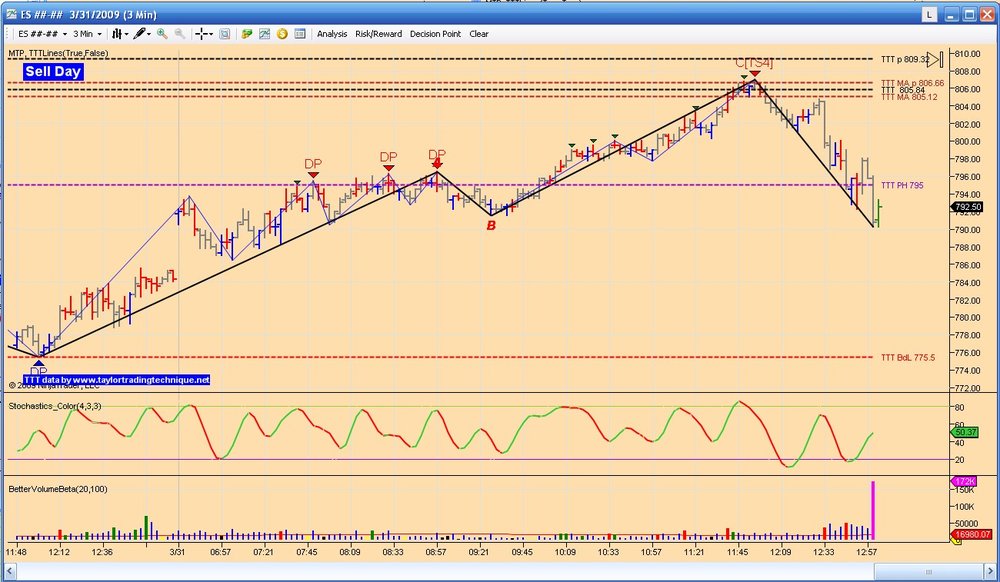
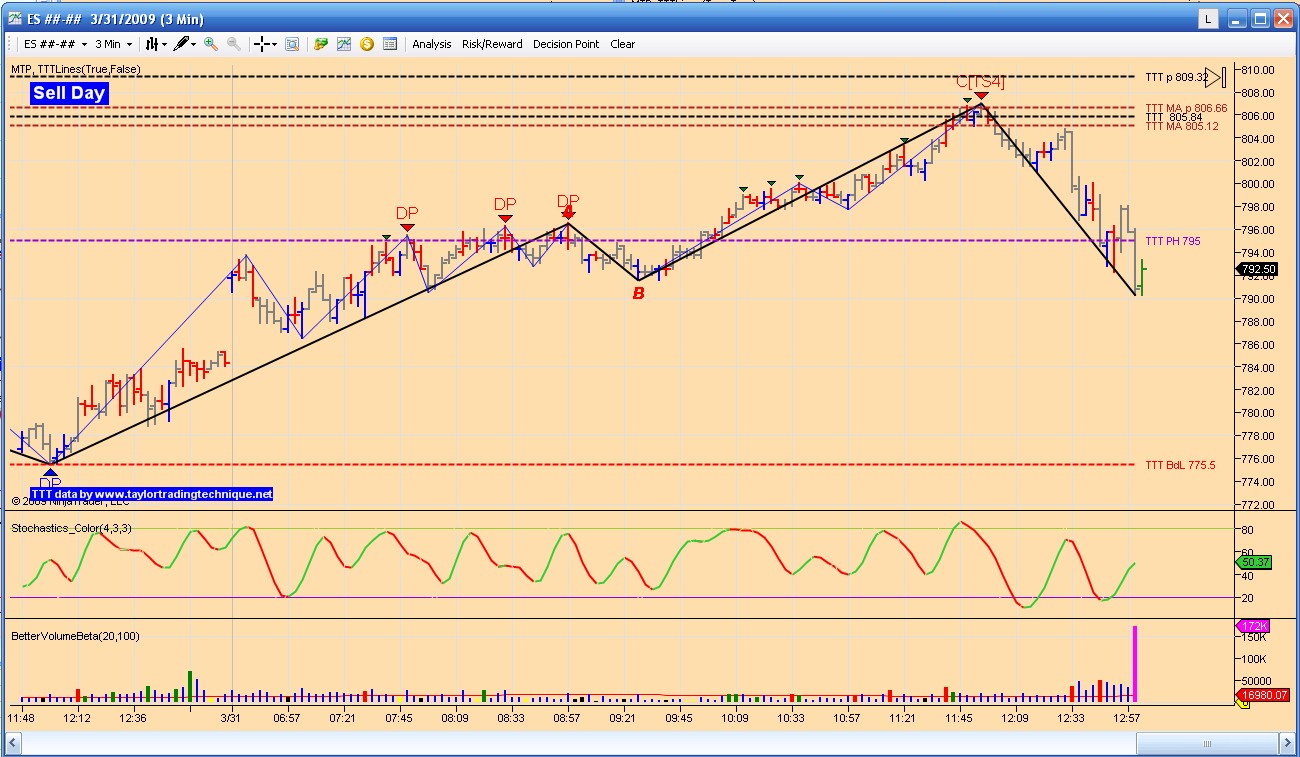
I went short at 809 (cash) as it was the high on monday.I figured we wouldn't close higher than that. Also figured we would close up on the day but that futures overnight will cause the market to open down weds and for weds to be weak on a short sale day.If we had closed higher i would have averaged in there,and if there was a new high made first,added again to the position-more risk,i know,and lots of assumptions,but so far it's working- futures are negative tonightThanks for the chart but i don't really understand what i'm looking at. Eg,what does DP mean,what is bdl at the bottom there,what is ph,how is the ma calculated?
EDIT oK,i see from ttt.net DP is decision point and bdl is buy day low,correct? That still leaves ph and ma calc
Sorry I missed your question
There is a possibility of 9 lines for the 24 hour session and 9 for the day session and they are labeled as follows:
TTT MAp is the possible Penetration based on the new Moving Average Recap sheet
TTT MA is based on the MA recap sheet and represents either the possible Decline level on a Buy day, possible Rally level on Sell day, possible 3 day rally on SS day
TTT MAv is the possible Violation based on the MA recap sheet
TTT p is the possible Penetration based on the regular Recap sheet
TTT is based on the recap sheet and represents either the possible Decline level on a Buy day, possible Rally level on Sell day, possible 3 day rally on SS day
TTT v is the possible Violation based on the regular recap sheet
TTT PH is the Previous day's High
TTT PL is the Previous day's Low shown on Buy days and SS days
TTT BdL is the Buy Day Low shown on Sell and SS days
Any of these labels followed by a "D" indicates numbers from the Day Session.
MA is for Moving Average.
I have 2 recap sheets 1 is based on data from Jan 3,2008
tha second is based on data of the last 20 cycles. about 3 months.
-
Yes, I know. And both of them were here for promotion. Not for research.Buy the way WHY never tried to sell anything. As far as I am concern I came to this site to add to my knowledge. I found some very interesting posts in this tread and even used some of them (with the owner's permission) in my Guide to trading TTT. Some guys on here have really studied TTT and are very well versed in it.
We may not all have the same approach but as long as it works, that is all that counts.
-
TTT nailed the high for today as we had a cluster of TTT levels and a nice Sell signal to go with that.
-
Just downloaded a copy of ttt and it is very badly written and hard going.I want to persevere with the concept though as it fits in very well with how i believe markets work.Somebody really should lay out this concept in a much condensed form with clear diagrams.But your suggestion of relating it to the market going forward would really help me pick this up quicker so i hope you don't mind me joining in here as a newcomer to this forum.To get the ball rollin' i guess todays rally was a buy day,and that the cycle might be extended beyond the normal 3 days? Today was a 'gap up and go' and was easy to spot early on.I would think that not as many shorts are trapped as you might normally assume for 2 reasons (1) many bears must have got increasingly nervous as the recent selloff looked over extended with the vix not showing panic and no real news, (2) fridays strong close off the 666.7 low,was an early warning for bears to cover.
I must agree with you that Taylor had a great mind, but a terrible writer.
I did a short recap of his book which is available through my website.
There also must be a reason why no one has ever rewritten his book. Probably the manipulators don't want everybody to understand how they move the markets. Others wrote how they modified the method to the way they understand and adapted their trading to the principle.
I had Monday as a Buy day. On Buy days we need to get a decline from the SS day high. Since we had closed near the highs on Friday the decline had to take place on Monday. On Sell days we need a rally from the Buy day low. That is exactly what we got on Tuesday.
Rich@taylortradingtechnique.net
-
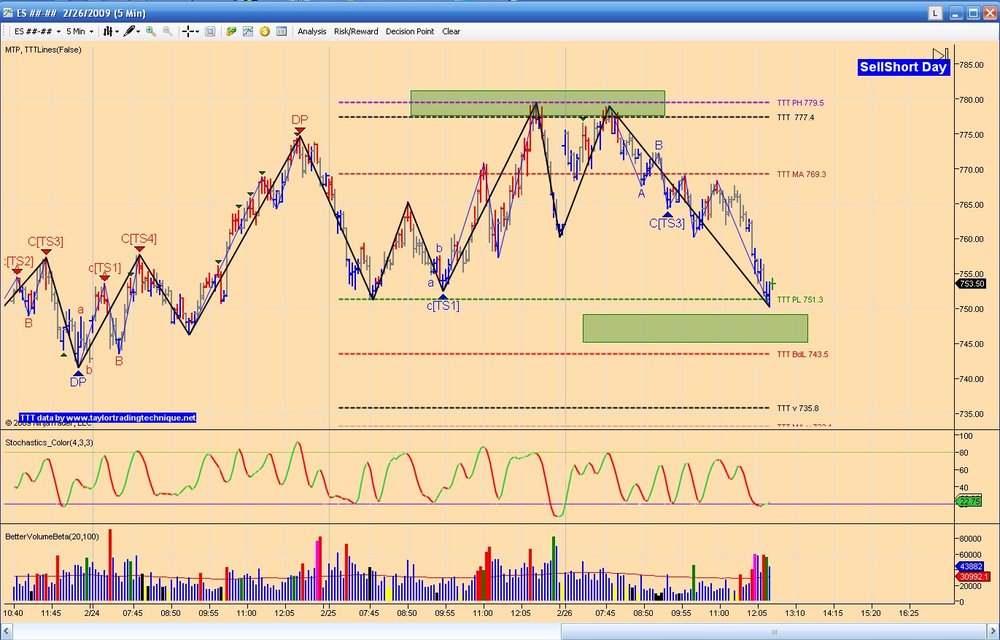
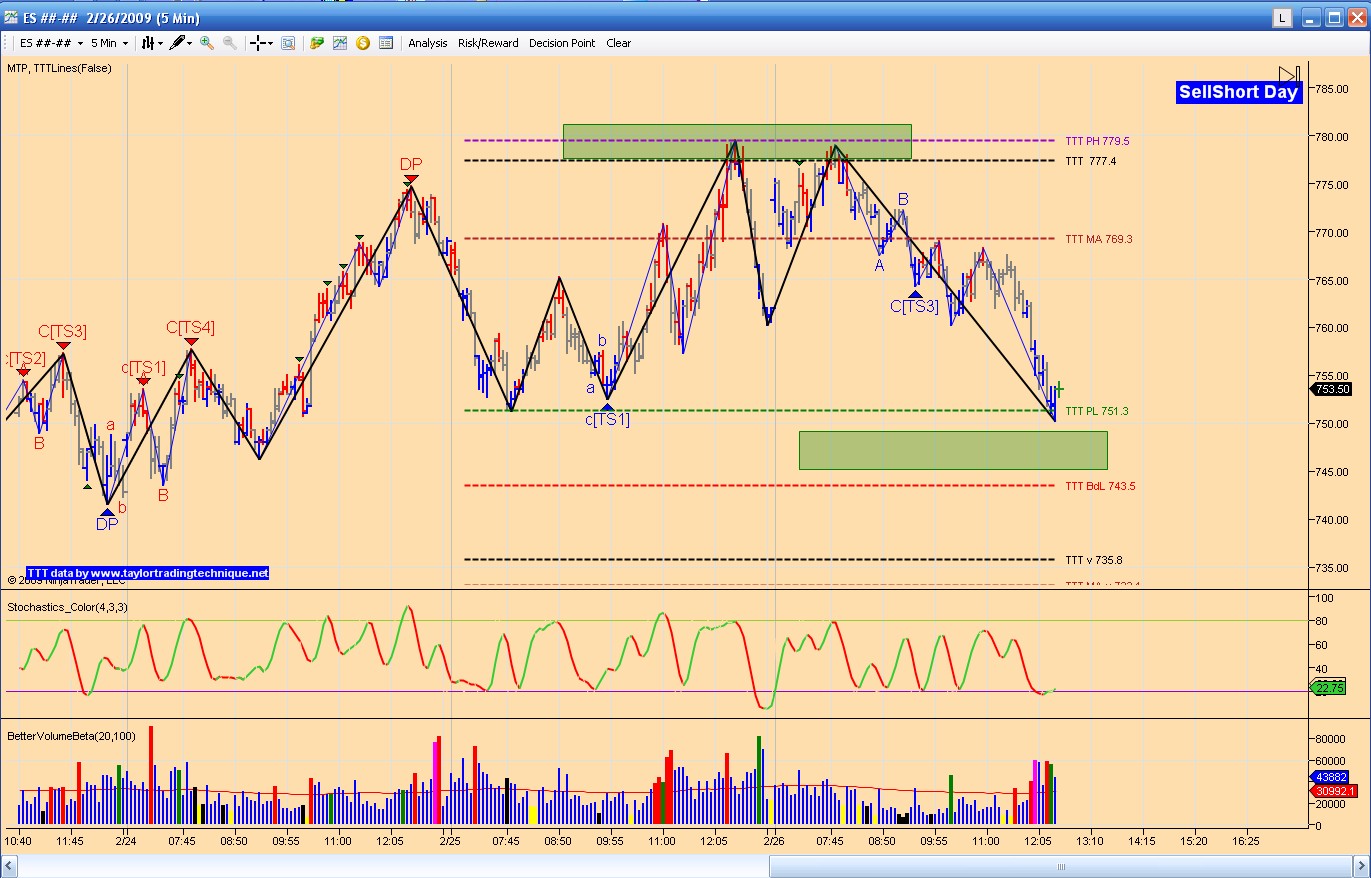
Today was a perfect SS day. We gaped up and failed to take out yesterday's high. This was also the 3 day rally projected area. We then crawled down all day to go test the previous low.
-
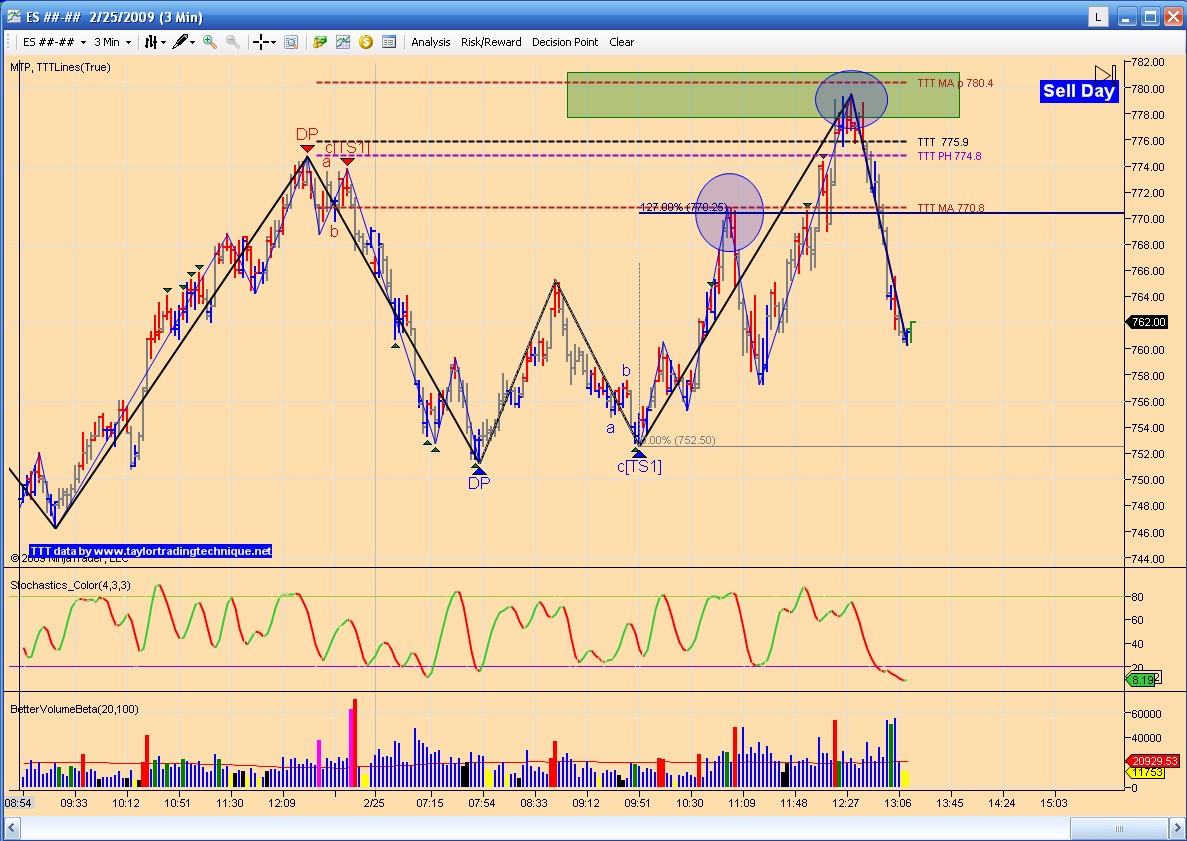
Hi All
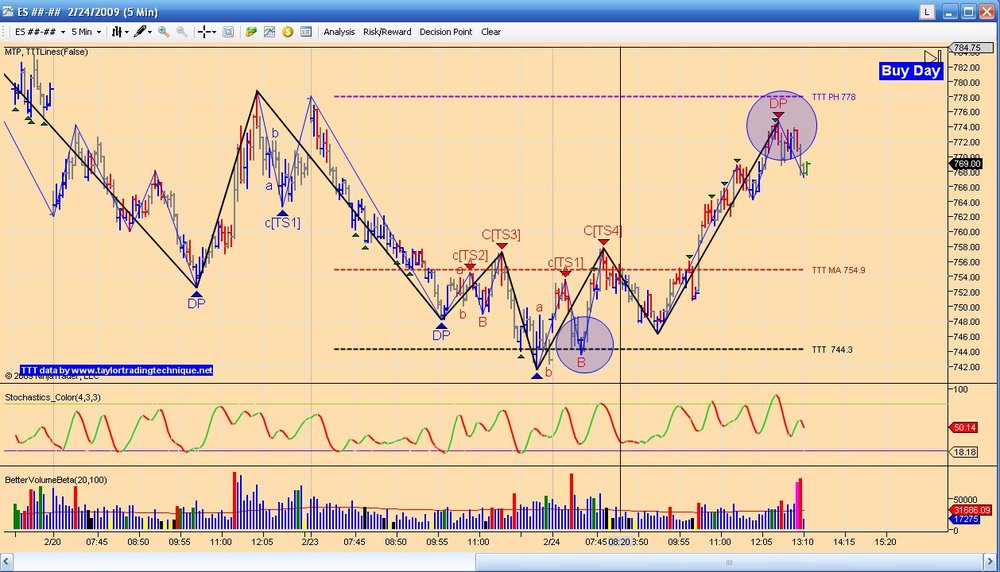
Today was a perfect example of a Sell (confusing) day, but the markets managed to make a higher high anyway. On ES 2 short trades were possible at the TTT MA levels and with good Fibs or DP

-
Not a bad Buy day for my Cycle. ES declined to the projected lows and then rallied all day to the previous day high.
It is so much easier to see these levels now with the Add-On software the take the numbers from the report and puts it right on the chart for you.
-
WHY?/RichboisOn a BUY day, a short can be taken on HIGH made FIRST. and unlike a sale day, we do not have to wait for a sell objective.
This is especially pertinent if a HIGH was made LAST on SS day, however what if a LOW was made LAST on SS day.?
When a Low was made last on SS day we could expect a Buy under or a Violation of the SS day low. Taylor uses the term Buy Under for Buy day Violation. I just find it additional confusion so I call them all Violations no matter which day it is.
In today's case That was to be expected since we had not achieved the full average decline on the SS day.

The Original Taylor Trading Technique Book Method
in General Trading
Posted
For those who follow the GBPUSD, here is a good example on how to trade a Buy Day.
GBPUSD had closed near the highs on Friday. We know that a Buy day means that we will get a decline from the SS day high. Market oppen and tried twice to get above the Previous Day High and Failed. That was the entry point to short.
At this point we need to worry about taking profits. As we can see on the attached chart TTT MA Decl, which is the average decline on Buy Day for the last 20 cycles, was at 1.5039, and the Previous Day Low at 1.5022. This would the place where the longs would do battle and the trade should normally end.
Now that we know that the Buy Day Low could be also in, Long positions could also be taken.
This was a good example of how we can go short on Buy Days and also where a long position could be taken at the BDL.