
Welcome to the new Traders Laboratory! Please bear with us as we finish the migration over the next few days. If you find any issues, want to leave feedback, get in touch with us, or offer suggestions please post to the Support forum here.


peterjerome
-
Content Count
89 -
Joined
-
Last visited
Posts posted by peterjerome
-
-
There is no easy way to make Money...small point. making the money is easy.....keeping it...now that's a whole different thing.
peter.
-
The jury is still out on this, so time will tell.Jason,...the jury is still out???
from your daily chart... in 2 yr., 2009 through 2010, you turned $20K into $160K...that's what, 700%? 350% annual ROI?
what am i missing?
WT? is the jury doing?
peter.
-
perhaps the retirees 'retiirement plan' was not well thought out.the change in role compounded with possible worries over health and financial issues. all this stress could contribute to a shorter life span.
i retired at 55 and began a very active lifestyle...surrounding myself with great friends i love.. couple that with no financial worries due to income from stock trading.....
it doesn't get much better than that!
peter.
-
Peter, I was really only kidding. I only had time to get to the f's in my list of indicators.MM,
i knew that!
i love sharing ideas...my biggest fear is that eventually everyone will figure out my methodology and there goes my edge. it's the "fallacy of composition"., like arriving early to get a good seat.
peter
-
Peter,I think you might improve results over a random flip of a coin if you look at the aroon oscilator before you consider the cci patterns. But, I would only do so if the chaiken monyflow index confirmed the darvas box break out. At that point I would make sure that price stayed within the donchian channels and watched for a fib retracement of a fisher transform signal.
MM
MM,
true enough...taking a random Long position when market is already headed north, and converse for a Short positon will significantly improve the odds. however, the whole point of the coin flip (as i understand it) was could you be successful with a random entry when using a 2-1 reward / risk.
peter.
-
Why not drop the charts and pick up a coin to decide whether to buy or sell? ...
this topic came up a few years back when i was on Woodies CCi site, so woodie put it to a test. go long / short on next bar open determined by coin flip. target = 10, stop =5. it was profitable. not rocket science...price is either going up or down, no?
peter
-
I take a look in guppy method and feel interest in it...if your interest is soley in guppy method, sorry i can't help you.
IF your interest is in calculating price targets, see the chart below for an easy, reliable, free methodology. technique uses Point & Figure charts.
peter.
-
Or, does it become a "Self Fulfilling Philosophy"?Or misery loves company...
-
They say that 95% of traders lose.Loustar1 offered to discuss those traders who win and how they manage to do it, why not discuss it?
Why do we always discuss the experience of unlucky traders instead of trying to get a bit of knowledge and luck of those who do know how to trade?
EXACTLY...
we generate the results we believe we deserve.
peter.
-
The title describes my trading experience. I currently seem to trade well for a month or two, making a set amount of money each day, and then one day I'll break all my rules -- take out stops, double-up losers, only counter-trend trade, completely refuse to be wrong -- and lose the equity that I had made..
sounds like you know exactly WHAT you are doing wrong....now, just STOP doing it.
it is within you to do that.
peter.
-
a drawdown is a drawdown...it's either open(stay in trade) or closed (exit trade)
peter.
-
turn $1000 to $10mil? Is that larry william?good guess, but no cigar.
-
...Hello and thanks for starting this topic.Not wanting to work hard in order to have their financial dreams leaves them in a mindset that makes them easy prey for the hucksters that promise riches beyond their wildest dreams with a few clicks of the mouse.
....
My question is this -- >> What EXACTLY are the 10% that win consistantly doing? -- And why aren't we talking about that?
amen Loustar. all great points.
i'd like to put your "riches beyond dreams" into a real perspective.
years back, in my search for the holy grail, i attended a presentation on a well know software system. over 100 "traders" attended.
the product developer showed how to turn $1,000 into over $10,000,000 using his product. the strategy was simple...buy and sell on signals and re-invested 100% of gains. (compounding the ROI). as the gains piled up, so did the number of shares purchased. at the end of the demonstration i asked him two questions... #1"how can you buy over 2x the average volume and not move the market? ...#2 what was the max open drawdown?
answer #1..."this is just an example..yada, yada, yada."
answer #2...40% drawdown.
i sat down, turned to the guy sitting next to me and asked "could you sleep at night with those DDs?" he said..."IF i'm GOING to make 10 million, i'm not going to worry about the DD.
thanks for sharing,
peter.
-
...The 10% who make it have paid the price in time (10,000 hours or more) and money....They have EARNED it.noego, you make sense to me. sounds like you walk the walk!
one thing i would add is "They'" have lost a bundle...more than once.
how about an informal poll of all those who make their living trading?
all forms, day, swing, position, investors, speculators, market makers, gamblers. hedge managers...
anybody out there?
-
Re: Why Do More Than 90% of Traders Lose? interesting thread.
so...if 90% are losing, 10% must be winning?
seems reasonable some of those 90 percenters are on this board sharing their secrets.
are there any ten-percenters here too?
if only there was a way to tell the difference.
perhaps we generate the results we think we deserve.
peter
-
I'm more concerned with profit as I'm developing my strategy than when I'm implementing my strategy. I don't see much sense in live trading a strategy that I'm really not sure about.interesting that many speak of their strategy as if it was the holy grail that needs no supervision. we have auto-pilot systems that are in contol of the takeoff, the flight itself, and the landing...all without aid of a pilot. what real purpose does the pilot serve? would anyone actually board a plane that was pilot-less?
i don't monitor the P&L column, but i do keep an eye on the price action...just in case unforseen turbulance develops. after many years of unsuccessful trading strategies, i am finally consistently in the black. that works for me...
good trading,
peter.
-
re "execute the strategy with precision & commitment, but keep your eye on the objective" ??The underlying thread of this thread seems to be more like
let the objective take care of itself, keep your eye on and execute the strategy with precision & commitment,
... one of the better ways to play most 'games'
i NEVER take my eye off the prize. i'l leave that to the autotraders.
peter.
-
The worst thing you can do is to try to make money trading.profit vs. strategy?....not a case of chicken or egg.
profit is the objective. strategy is your plan to secure objective.
execute the strategy with precision & commitment, but keep your eye on the objective.
or so it seems to me.
peter.
-
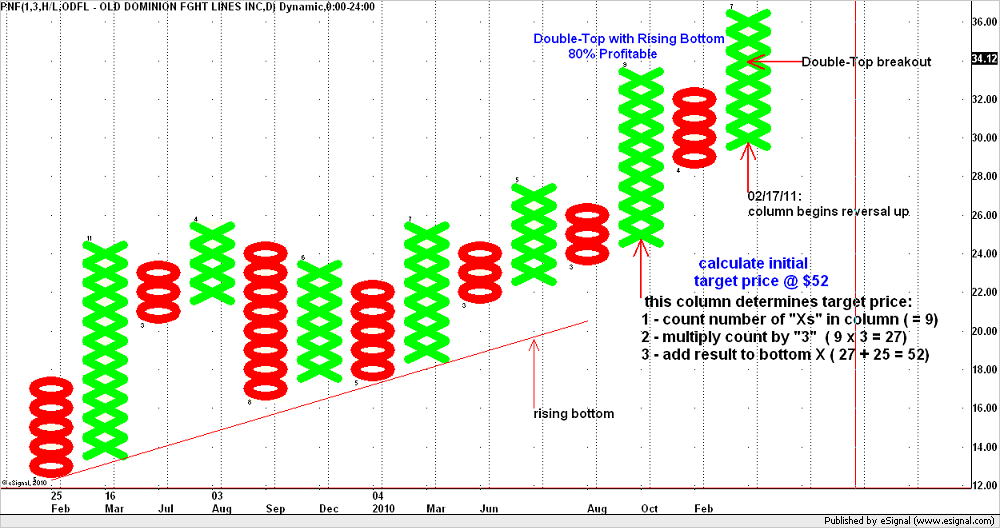
start with basket of good fundamentals,
look for PnF double-top breakouts.
peter
-
Thanks for the added clarification; I'll begin research on PnF charting. Also, Since it's on offer, I'll ask more questions:David
david,
here's a practical and useful explanation of using PnF to determine market direction. my entry strategy incorporates similar concepts.this is a powerful concept when used correctly. make it part of your 'system'...can save your behind....
Market Breadth: Point & Figure Internal Indicators
good trading,
peter.
-
:....3. I understand entry and exit can get complicate in explanations, but I'd like to hear more. I know you use bar charts. What time frames? What indicators?
FYI, this will probably lead to more questions...
David
david,
here's some additional detail on exit strategy. this is usefull for all position traders or investors.
#1 first clue, the weekly chart shows a lower HIGH and lower LOW
#2 price opens and closes below the LSMA-25. (25 period least square moving average)
#3 PnF chart shows a double bottom. (not a breakout, just the bottom)
LSMA is a version of Woodies CCI system. installed the LSMA into price pane. CCI is the only indicator in separate pane. i believe this MA is supported on other platforms.)
today i closed my long position in CAM and can re-deploy assets.
good trading,
peter
-
Thanks for the added clarification; I'll begin research on PnF charting. Also, Since it's on offer, I'll ask more questions:1. It's hard to tell by looking at current holdings, so what is average length of time you hold an asset? What is relative short time and relative long time? (Are your answers solid guesses on memory or tracked regularly?)
2. I see that you average a 5... ROI monthly. What percentage of positions get stopped out? It seems you're setting a target price, too. What percentage hit that target price? (Again-are your answers solid guesses on memory or tracked regularly?)
3. I understand entry and exit can get complicate in explanations, but I'd like to hear more. I know you use bar charts. What time frames? What indicators?
FYI, this will probably lead to more questions...
David
david,
i have 10yrs of ALL trades in a real-time folio. i can look at any past trade(chart) and determine exactly what went right or wrong...ie, weak entry, or bad exit strategy. this has helped tremendously to see exactly where i went wrong. over the years i've been able to correct most everything i was doing wrong. about 60% of trades are profitable. the ones that go against me are closed quickly, so losses are small compared to winners. you can see the current folio i posted has 8 positions. they are all profitable anywhere from 2% (recent trade) to 52% (10 mos). the average current gain for the entire folio is 19%. you can see the entry dates and prices from my last post. i've posted several times on my entry strategy. i don't use profit targets or fixed stops. i don't have a pre-determined time-frame for how long to hold an equity... i stay long until the primary trend reverses. for exit strategy, i watch the relative strength of equity compared to S&P500, watch the 'sector' for a sell signal and watch the primary trend for weakness. i track the average daily gains and eliminate those equities that 'are not pulling their weight' and replace with another candidate. some stocks will last only a week, some 9 mos. or anything in between.
search my user name..you can see earlier charts showing entry strategy. the ONLY indicator i use is CCI.this way i don't have 'paralysis of analysis).
fwiw...i traded for about 15 yr. (and lost a bundle...several times) before i started 'getting it'. my last post referred to an average 5% monthly(60% annual) gain for last 7 mos. this is AFTER i deduct ALL living expense...all life style costs, food, clothes, travel, vacations, cruising, housing, the 5% monthly gain is really an increase of net worth.
good trading,
peter
-
peterjerome,I've been actively trading for a little over a year now, and I caonsider myself a swingtrader. I still have an office job, so my posiitons usually last 3 days to one month, although I've gone both shorter and longer.
Questions:
1. What are your avg hold times?
2. Where can I learn more about PnF charts?
3. Other than the usual pitfalls of trading options, are there any other reasons buying calls as proxy for the asset?
Thanks for any help,
David
david,
#1 - i hold "until"... as long as it's profitable. here's the current folio showing entry dates:
CAM - 1000 on 05/27/10 @ $38
HAL - 1000 on 11/15/10 @ $36.66
ANDE - 1000 on 01/11/11 @38.92
UNH - 2000 (2 positions) 01/11/11 avg $39.66
TBL - 2000 on 01/18/11 @ $33.19
PM - 650 on 02/23/11 @ $61.80
ODFL - 2000(2 positions) 03/17/11 avg $34.27
IBN - 500 on 03/24/11 @ $47
since i started this methodology EVERY month for last 7 months is profitable.avg roi 5.1%
#2 there are tons of books on PnF available.
i have "Point & Figure Charting" by Thomas J. Dorsey.
Stockcharts.COM has pretty good PnF charting for free. check this page at stockcharts. it lists many indice that track various sectors, using a 'percentage' basis. e.g. how many stocks in the energy sector are on buy or sell signals? many sectors available. this gives great look at those sectors turning up or down. i use this as additional qualification for entry.
StockCharts.com - Free Charts - Symbol Search
#3...i'm not an options guy but the book has a chapter on this topic. the easiest option for going long would be an 'in the money"call when you have double-top breakout.
i have a methodology on trading that is based on finding candidates with PnF charts. i use standard bar charts for entry. also strategy for exit, but too complicated to go into here.
ask any question david.
good trading,
peter.
-
MM,
sounds like a good plan to me.
thanks for sharing.
peter.

Why Do More Than 90% of Traders Lose?
in Forex
Posted
OOPs...my bad:crap:
peter