Welcome to the new Traders Laboratory! Please bear with us as we finish the migration over the next few days. If you find any issues, want to leave feedback, get in touch with us, or offer suggestions please post to the Support forum here.

thrunner
-
Content Count
316 -
Joined
-
Last visited
Posts posted by thrunner
-
-
If you have a brokerage account with TS, the software is free if you do about 10 round turns of futures per month, just pay exchange fees of $30 to $100, depending what you are trading.
Multicharts and Ninjatrader are also good alternatives if you have a datafeed from a broker or third party. Ninjatrader is free for charting and simulation.
-
Fair Value, Program Trading, and the S&P Premium
Program Trading, Fair Value, Index Arbitrage Values - indexArb.com
What is Fair Value and what are Premium Execution Levels?The media also talks about Fair Value constantly and the "premium" or "spread" and certain execution levels. What are they talking about?
The "premium" (PREM) or "spread" is the difference between the most active S&P 500 Stock Index Futures Contract (the spoos) minus the actual S&P 500 Stock Index (cash). That difference, which usually ranges between $5.00 to $-5.00, and slowly decays or rises as we reach the S&P 500 Futures Contract expiration, is what program trading is based on. When the PREM difference rises to a certain execution level, "buy" programs kick in. Our large institutional clients then buy the stocks in the S&P 500 Stock Index on the New York Stock Exchange and sell the S&P 500 Stock Index Futures Contract against those positions on the Chicago Mercantile Exchange. When the PREM difference drops to a certain execution level, "sell" programs kick in and our clients do the exact opposite. These transactions have extremely low risks because of the abnormal market differences in the PREM as traders capture those few points of profit before the PREM returns to normal and/or Fair Value. This type of program trading is called index arbitrage and is very common. But it usually accounts for less than 10% of all program trading activity done each day.
-
{ James Sibbet's Demand Index Function }
{ Programmed by David Fenstemaker }
{ The Demand Index combines price and volume in }
{ such a way that it is often a leading indicator
( of price change. }


Inputs: Length (NumericSeries);

Vars : WtCRatio(1), VolRatio(1), VolAvg(Volume),
BuyP(1), SellP(1), Sign(+1), Return(0),
WghtClose(Close), AvgTR(High - Low),
Constant(1), BuyPres(1), SellPres(1),
TempDI(1), DMIndx(1);

If CurrentBar = 1 then
Begin
VolAvg = Average(Volume, Length);
End;

Return = 0 ;

WghtClose = (High + Low + Close + Close) * 0.25;
AvgTR = Average (Highest (High, 2) - Lowest ( Low, 2), Length);
VolAvg = ((VolAvg [1] * (Length - 1)) + Volume) / Length;

If WghtClose <> 0 and WghtClose[1] <> 0 and
AvgTR <> 0 and VolAvg <> 0 then
Begin
	WtCRatio = (WghtClose - WghtClose[1]) / MinList(WghtClose,WghtClose[1]) ;
VolRatio = Volume / VolAvg;
Constant = ((WghtClose * 3) /AvgTR) * AbsValue (WtCRatio);
If Constant > 88 then Constant = 88;
Constant = VolRatio / ExpValue (Constant);

If WtCRatio > 0 then
Begin
	BuyP = VolRatio;
	SellP = Constant;
End
Else
Begin
	BuyP = Constant;
	SellP = VolRatio;
End;

BuyPres = ((BuyPres [1] * (Length - 1)) + BuyP) / Length;
SellPres = ((SellPres [1] * (Length - 1)) + SellP) / Length;

TempDI = +1;

If SellPres > BuyPres then
Begin
	Sign = -1;
	If SellPres <> 0 then TempDI = BuyPres / SellPres;
End
Else
Begin
	Sign = +1;
	If BuyPres <> 0 then TempDI = SellPres / BuyPres;
End;

TempDI = TempDI * Sign;
If TempDI < 0 then
DMIndx = -1 - TempDI
else
DMIndx = +1 - TempDI ;

Return = DMIndx {* 100.0} ;

End;

DemandIndex = Return ;
{ James Sibbet's Demand Index Indicator } { Programmed by David Fenstemaker } { The Demand Index combines price and volume in } { such a way that it is often a leading ( indicator of price change. } Inputs: Length(5); Vars: DMIndx(0); DMIndx = DeMandIndex (Length) ; Plot1(DMIndx, "DMI") ; Plot2(0, "Zero") ; -
..I have updated my routers FIRMWARE in the meantime,
maybe you should consider this for your router too.
Well, but two weeks ago I was in trouble, because even a restart of my router
didn't worked out. After talking with my internet provider, who made it clear to me,
that the problem was on my side, I found the problem:
While my router thought, it was connected to the WAN via ppp0,
in fact it wasn't (I saw it within the routers logfile).
After connecting the router manually instead of auto after a restart,
its was internally within the right state again.
Since then, after setting it to auto mode again, it runs smooth again....
No one seem to have mentioned that you should reset the router and not just restart it. This usually involves pressing a small button in the back of the router with the tip of a pen or paper clip, for about 3 seconds. You will lose your initial setting and password. However it ensures that you are not using a corrupted or incorrect configuration, assuming you know how to properly set up your ISP with your router. There is also a matter of MAC address cloning with some cable ISPs that may require you to record the correct NIC MAC address which was assigned by the ISP initially to the original PC.
-
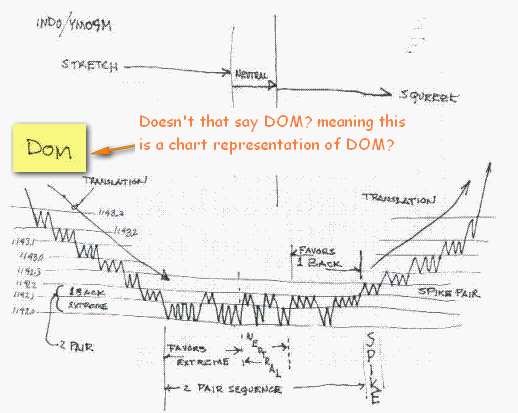
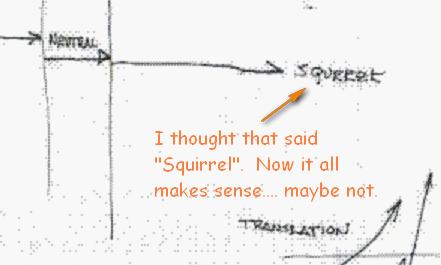
Doesn't that say DOM? meaning this is a (tick) chart representation of DOM? Which is the whole purpose of this thread.Considering the drawings (and the topic of the thread) represent what to look for on a Tic chart (or more specifically, the One Tic Range [OTR] chart), and not the DOM (aka Price Ladder), I doubt a genius level IQ is required.Attached, please find an OTR (Friday [EOD] 8-28-2009) from my display (Trade Navigator). The alternating Yellow and White sections represent a five minute bar.
HTH.
- Spydertrader
-
-
1-3 search this forum for more user experiences, each trader is different.
4. TS has a simulator that will work with strategy testing.
-
I am glad it worked out. Thanks for posting your results and good work. All credit should go to Bamboo and kirvist for writing the code.
Bonne chance.
-
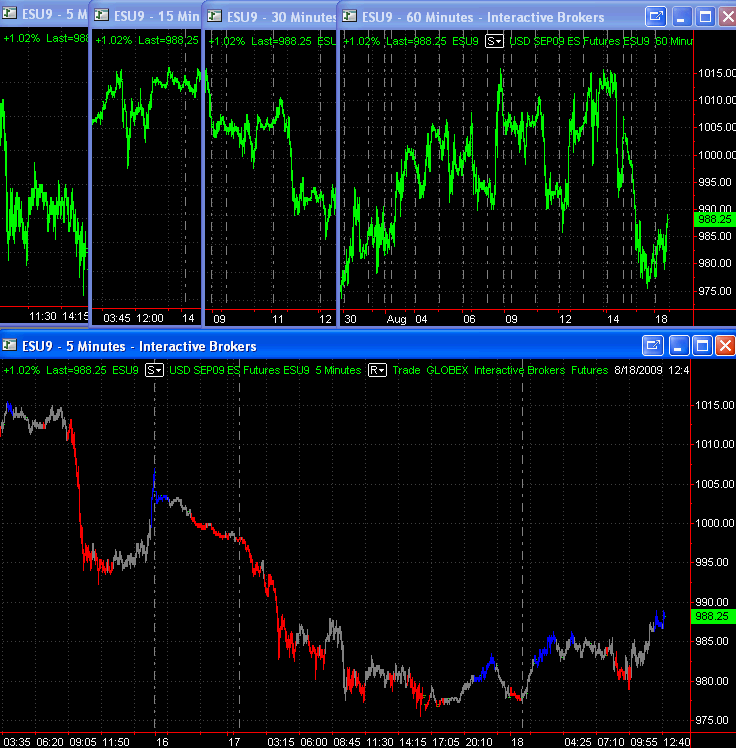
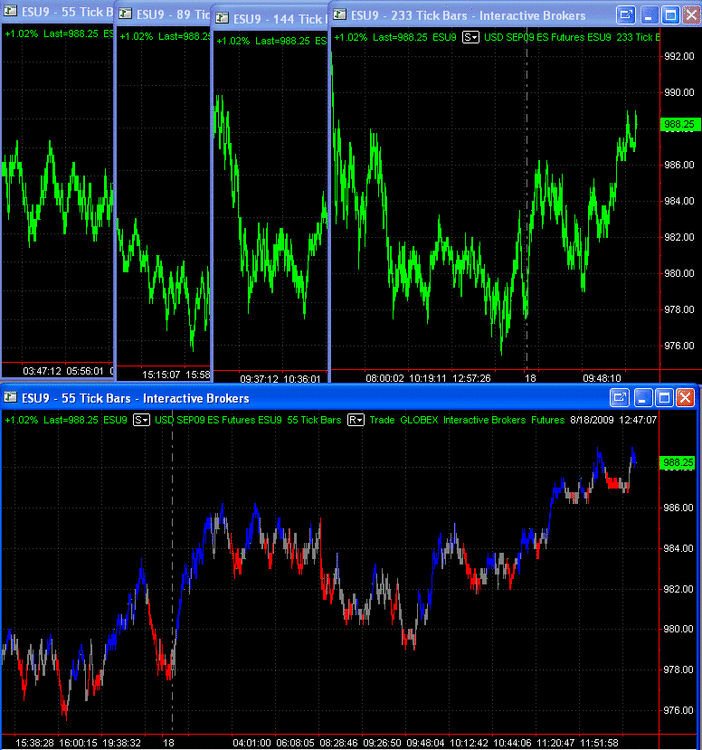
I don't think you installed ELC, ADE, TZU correctly. C: \ADE folder needs to be set up properly as well (use the ADE setup exe attached here, if you are not sure how to set up C: \ADE). I wasn't sure if this combination will work with MC, so I installed the indicators and set up the workspaces and it does work properly (see attached MC workspace pictures)....I use Multicharts 5.0.
Do you have an idea ?
.
Attached please find the MC indicators (pla format) and MC workspaces using IB (Interactivebroker data feed; you will need to change the symbols in order to match your data feed).
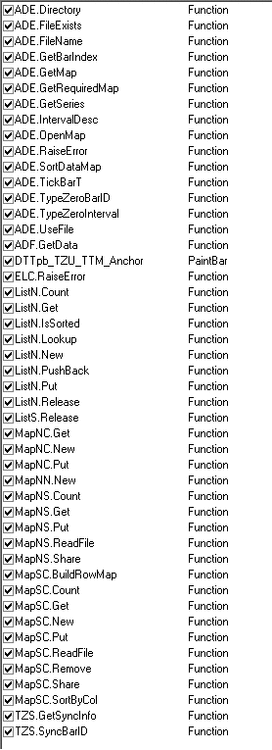
If you can't get the attached files to work then you may need to install the ELC (1.05), ADE (1.07) and TZU again (in that order). Many files are redundant and you don't have to compile over them (choose No to All when compiling). Make sure you have ELCollections.dll in your MC programs folder.
-
Sure. Actually post 30 above has the kirvist eld which has the ADF.GetData function. Here it is in code:
The attached eld is just the exported eld of kirvist's code using TS 8.06.2525.
*** What version of MC are you using? ***
It is possible that an ealier version of MC is unable to read the newer TS 8.6 (8.06.xxxx) elds (posted here with kirvist's eld above and this post) properly and is unable to compile the dependent functions (it could read it but the function names are incorrect). You may need MC 5.0 and above.
The older ADE, ELC, TZS elds were produced by TS 8.3 and below and are readable with MC 3, 4.
Inputs:
Class(StringSimple),
Sym(StringSimple),
Interval(NumericSimple),
BarID(NumericSimple),
SeriesName(StringSimple),
BarsBack(NumericSimple);

Vars:
SeriesID(0),
BarIndex(0);

SeriesID = ADE.GetSeries(Class, Sym, Interval, SeriesName);
BarIndex = ADE.GetBarIndex(Class, Sym, Interval, BarID);

if BarIndex > BarsBack then
ADF.GetData = ListN.Get(SeriesID, BarIndex - BarsBack)
else
ADF.GetData = 0;
-
In case you don't already have TypeZero Sync Library. It is attached in this post.
You should not have compile errors for the previous TTMpbTZU indicator after this TYpeZeroSync eld is compiled in MC.
After the TTMpbTZU indicator compiled properly, you can proceed to set up the 4 sender charts and the one receiver chart.
Read the above quote box again as it was written by Bamboo. As (3) stated, be sure the Interval input contains the correction ADE.TickBarT(BarInterval) function for both the sender and receiver indicators.
This works for TS and should also work for MC.
-
Here are some tips on making ADE, TZS, ELcollections working on MC, if there are MC users who have got this to work, please post.
TS SUPPORT :: View topic - ADE and Vista 64 bit.
Note that if you want to work with ADE and TypeZero bars (tick and volume bars), you almost certainly need to install the TypeZero Sync library as well, since it will allow you to correctly synchronize data between different charts.Here are the instructions for using the TZS framework. Please read and follow them carefully, since you must set things up correctly in order for the framework to work properly.
1. Set up each chart that you want to synchronize so that the first bar on the chart is at the start of a session. This just means that the range should be set with Days/Months/Years Back or with First Date, rather than with Bars Back. Don't ever use the Bars Back range setting with the TypeZero Sync framework!!!
2. Apply the "! TZS Setup Sync" indicator to each chart involved in synchronization (both sender and receiver). Check the "Prompt for Format" box and make sure that the Interval input is set correctly -- e.g. it should be ADE.TickBarV(BarInterval) for tick bars using trade volume, and ADE.VolBarV(BarInterval) for volume bars using trade volume. The indicator is named with a ! at the start to ensure that it comes first in the indicator list. Indicators that use TypeZero Sync should always be named so that they come after the "! TZS Setup Sync" indicator.
3. Apply the indicator that saves data to the higher-interval chart. To save OHLCV data, use the "TZU Save OHLCV" indicator. Again, make sure the Interval input contains the appropriate TypeZero interval function for the chart.
4. Apply the indicator that consumes the higher-interval data to the lower-interval chart. Check the "Prompt for Format" box and enter the appropriate function calls for ThisInterval and ThatInterval. ThisInterval refers to the interval for the current chart, and ThatInterval refers to the higher interval. You can always pass BarInterval to the function used for ThisInterval (e.g. ADE.VolBarV(BarInterval)), but you will need to specify the correct interval for the higher interval (e.g. ADE.VolBarV(5000)).
-
_lateral[1] not declared and used only once.
This will verify in TS and compile in MC with "_lateral[1] and" commented out.
-
-
If you insist ...I am really sorry to insist, but:You should be in the TS forum, but I realized that you might not have access because you are using MC .. Kirvist is the author, although he might as well be working for TTM given the difficulties in setting up this indicator
 kirvist
19 Posts
Posted - 08/12/2009 16:25:11
Ale' TTM Trend anchors indicator for ticks
For minutes: https://www.tradestation.com/Discussions/Topic.aspx?Topic_ID=92189
That's my setup for indicator. I hope sameone can do better.
Setup
1.You need to instal ADE pack.(https://www.tradestation.com/Discussions/Topic.aspx?Result=1&Topic_ID=33398&Page=1)
2.Open new chart window and insert indicator "TZU Save OHLCV".
3.Copy chart window and paste as many times as you need timeframes. Adjust charts Ticks, lets say 55tick,89tick,144tick,233,377,610,987, etc.
4.Download PAINTBAR INDICATOR "TTMPB_TREND_TZU.TXT.ELD" and install.
5.Open new chart window, choose tickframe to trade (lets it be 55tick) and insert PaintBar Indicator "DTTpb_TZU_TTM_Anchor".
6.You can input 4 tickframes as Intervals. You need input ticks chart on which loading
PaintBar Indicator "DTTpb_TZU_TTM_Anchor".
7. PaintBar Indicator "DTTpb_TZU_TTM_Anchor" atatched as .ELD
8.Enjoy.Attachment:DATA/20090812161521TTMPB_TREND_TZU.TXT.ELD 46995 bytes
Attachment:DATA/20090812162406DTTpb_TZU_TTM_Anchor.txt 6733 bytes
-
When I compile the code, I have an error message: ADF.GetData: Unknown Function ?You are probably missing ELcollections. Tams has kindly provided some links here: http://www.traderslaboratory.com/forums/f46/ade-all-data-everywhere-easylanguage-5934.html#post66122
Anyone using ADE, TZU, ELCollections should know that none of these are supported, not by TS, not by MC and no longer by the author/trader Bamboo on the TS forum. You are really on your own. If you can't handle that, you should take Tam's advice and purchase the TTM version and hopefully they can provide support.
-
You should put your code in the code box so it doesn't run on (use the green spinning gear icon in the message reply box).I am attaching some screenshots and will try to post the code later. Thanks to Blu Ray and Tams. I really appreciate it.This indicator repaints and is also known as the 'self deception' indicator:
04-29-2009, 01:54 PM #5 (permalink)ronm
Junior Member
Join Date: Apr 2009
Posts: 1 Snake & Snake Force: An Exercise In Self-Deception
On the internet, I found a blog written in Russian about Snake and Snake Force. Of course I couldn't read it, but it was entitled something like "Self-Deception Indicators". After studying both, I can't think of a better sound-byte description for the both... so don't get mesmerized by the Snake.
Both of these indicators "repaint", what this means is that both can "change their mind" on signals after you have taken action based on the signal. This "repainting" it the reason the signals look soooo good on historic actions.
If you really like Snake, I suggest you use a "Linear Weighted Moving Average" in "Typical Mode" instead because this is what Snake is based on.
Snake was a total waste of time. Don't go there.
Ron M
-
Japanese knotweed - Wikipedia, the free encyclopedia
In Japanese, the name is "itadori" (usually written in katakana). There are also regional names, and it is sometimes confused with sorrel.Japanese Knotweed is a commercial source of resveratrol supplements. Hu Zhang root extract is a traditional Chinese medicinal treatment.
You can grow your own, they grow like weed ... they are weed.
-
Click on a chart and press Ctrl-Shift-D (same as view data windows), then save the data as text file which will have OHLC Uvol, DvolI know esignal gives historical data, but I dont want to subscribe anything.I use tradestation, where abouts could I get the raw data.
I want to put it on an excel sheet.
Alternatively use the excel link download package:
https://www.tradestation.com/Discussions/Topic.aspx?Topic_ID=61180
Here is a demonstration that illustrates how EasyLanguage can use its DLL interface to communicate with Microsoft Excel®. ELExcel.dll is one of the DLL coding demonstrations we provide to illustrate how the EasyLanguage interface to DLL's works. Unlike previous demonstrations, use of this DLL does not require any coding on the "Excel side". Instead, all action is controlled by EasyLanguage.
Separate "wrapper functions" are provided that demonstrate the TradeStation to DLL interface by:
1.) Initializing the Excel application for interaction with EasyLanguage.
2.) Designating a specific Excel worksheet as the one to be used for a series of other EasyLanguage commands.
3.) Placing values of various data types (numbers, strings, Boolean values) into Excel cells.
4.) Retrieving values of various data types from Excel cells.
5.) Setting the cell background color and font color to be used in an Excel cell.
6.) Clearing values and formatting from a specific Excel cell or from an entire Excel worksheet.
-
Most of these question are answered in NT forum:
You can use 1440 m as daily. The historical data is supplied by NT and not by Zenfire. There doesn't seem to be any error correction done by the NT servers. You have to merge your own continuous contract.
-
Will do. Do you know if TradeStation offers any sort of API that would allow me to download historical data, say I wanted to build my own database based on my own criteria.There is currently no market data API available in the TradeStation platform. You can however, download a lot of data and export as text or CSV.
What you are looking to do is fairly simple, using daily data, and a lot of studies have been done (see Steenbarger). You can open a Tradestation account with or w/o their brokerage acount. Alternatively, if you are just testing the waters, download a 30 day trial copy of Multicharts from TSSupport, which is a TS clone, and just use the free Yahoo EOD daily data.
As someone had pointed out in the other forum to your question, you can do all of these in MS Excel as well, which is what Steenbarger did with a lot of this studies.
-
Unfortunately that is slightly incorrect. The NT "Direct" version that is free is only free if you opened an account and funded such account with a NT affiliated broker. The Direct version will let you trade on the chart and DOM without the functionality of a strategy or ATM (advance trade management).Just a small addition to Tams' post above: You can trade live with the free version of Ninja, but you won't have access to the ATM function ...The 'free' version of NT you get from NT will not let you live trade with any broker, although you could still chart and trade in simulation mode with no expiration.
-
-
Each judge usually asks Donald Trump in a beauty contest. In the market, each judge usually asks Goldman Sachs.In 1936,... Each judge knows that he's a player in an fabulously complex game of psych and double-psych, an infinite regress of figuring out what the other guy is thinking you're thinking he's thinking you're thinking he's thinking, and so on and so on ...-- Don Luskin
The Time Element - Tape Reading and Market Tactics, by Humphrey H. O'Neil (1931)Humphrey H. O'Neil introduced 'The Time Element' to me. This is an obliteration of the price-structure due to the inability of the traders to act fast enough to support or resist a sudden panic or boom and its following movements. He states that "humans need time for the return of reason following such shocks. How long did it take you to get over the the emotional effects of the car crash?" ...
11 to 14 months, so said Coppock.


Free Software ( Trading / Charting / Analysis )
in Tools of the Trade
Posted · Edited by thrunner
Tradeproject is free, uses IB data. 32bit, 64bit versions available. Looks like it is capable of live trading with IB.
Ninjatrader is free for charting, simulation and development; various data sources. Live trading is not free.
NexTick is free for charting, uses free Yahoo historical data and limited intraday data.