
Welcome to the new Traders Laboratory! Please bear with us as we finish the migration over the next few days. If you find any issues, want to leave feedback, get in touch with us, or offer suggestions please post to the Support forum here.


patrader
-
Content Count
287 -
Joined
-
Last visited
Posts posted by patrader
-
-
I would like to hear comments from others how they handle pt3 and fanning out. What strategies do you use?Very often I trade pt3 with all the correct “tell tale signs” i.e increasing volume only to be stopped out
I have attached an example , you can see the frst pt3 on increasing black volume and it was an ftt. Two bars later was the “correct” pt3.
Suggest you take vienna's advice and annotate laterals plus what jack calls bookmarks.Just these two annotations would have given you more insight.The green pt 2 bar's high came just short of the slow down container's rtl that you have annotated.Would also suggest that you leave the slow down rtl extended to the right until it is broken on increasing black volume.It is not unusual for the market to find resistance at a slower down rtl and go sideways(lateral) or have slight retrace to pt 3(depends on mode and context of the market).If you had the extended slow down rtl in place then your first pt3/ftt bar would have tested both the rtl and bookmark on its high.Also two bars before this pt3/ftt bar the low of that bar created a boundary(matches low of bar before the pt2 which is start of lateral) on the bottom of the lateral.The market luvs to setup these traps on both sides of the market right before another dom move(the "correct" pt 3 as you call it).Many times the market will use a combo of a lateral with a slight retrace(which is also called a fbo of the lateral) right before the pt 3.With more monitoring experience you can learn to anticipate this.Now look closely at the volume pane.After the pt 2 there is no increasing red volume.Each price move down is on decreased volume.This is a major heads up that this move is non dom.hth
-
Here's something that took me a long long time to understand...That you don't find in the "textbook"I deleted the last bar BTW.
I am long...
We just had BO...but also we had a VE and a FTT....and no point 3 up yet....
So what do we do? Do we reverse...we did notice the FTT.... Our point 3 up might take us far far up...... (actually it did, 40 pips or so and I am still long..)
In my opinion always do what we see last... we saw the FTT so reverse..(we have to make profit no) and the point 3 up might come later which we would also trade. The FTT where we should reverse can be ignored...but that would be completely conscious...knowing a point 3 up will come. If you give up on the FTT you have to be ready to take some heat...and know a pt3 may come... If you take the FTT while the bar is forming...and you took the point 3 up (which came pretty fast after that) you would have almost no loss, depending on how quickly one would see things.
I can't tell how often this went wrong.. I just kept holding (we had BO...BO=hold)....
Sure of course..BO means hold.. but FTT after that means reverse!!!! The most recent thing counts so always have the channels in place because we might get FTT quickly.. (Hell..sometimes we have PT3, BO and FTT in one bar!!!) Often I did not notice the FTT....didn't have the channel lines in place etc.etc.. So we trade the FTT...no matter if we just had BO or not...FTT is FTT. The point 3 up later on might be another FTT and might take an hour to form!!!!
Posting this because I struggled with it a lot. All it requires is to have all trendlines in place and to notice things. Wrong or no channels means mistakes.
regards,
Ivo
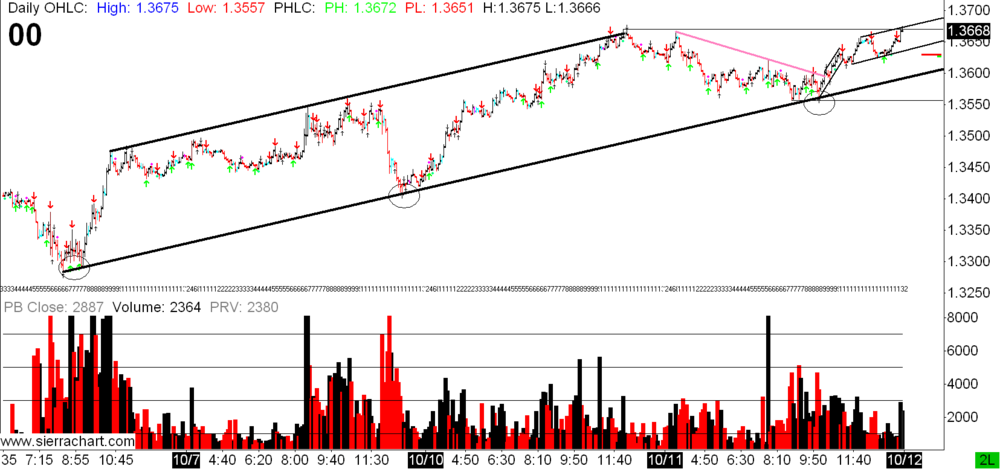
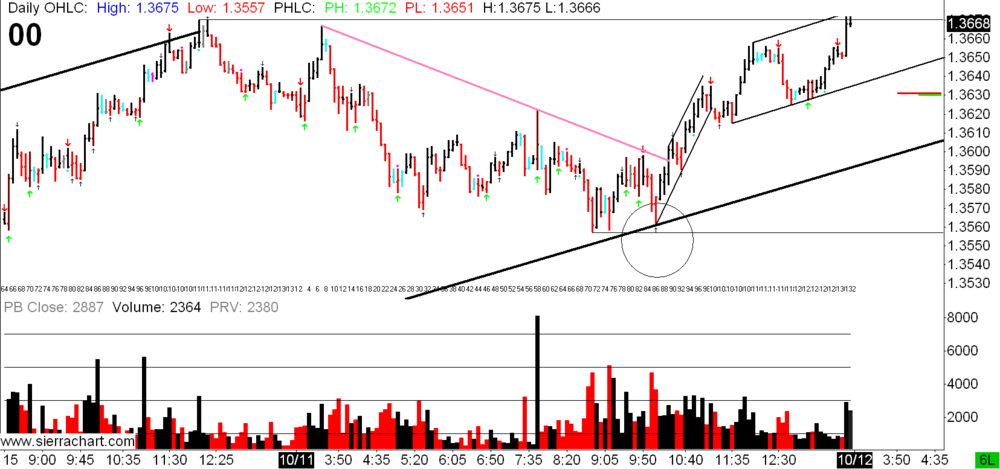
First post is 10-6-11 thru 10-11-11 with the carryover RTL(slow up container) in place from 10-10-11.Second post shows the RTL(slow up container) bounce and completion of the non dom pink container on a test of the bm(see circle highlite).hth
-
In the spirit of "refinement", which two bar cases(http://www.traderslaboratory.com/forums/attachments/34/11926d1246812953-price-volume-relationship-tentapes.jpg) does the market sometimes combine the ibgs with the second bar of the two bar case? Why do ibgs's show up at so many "turning" points(pt 2,3 and ftt's) in the trading day? What effect or non effect do ibgs's have on laterals? Why did spydertrader say "An IBGS Bar (on increasing Volume) which breaks through the Lateral boundaries is the variety I use to 'kill off' the Laterals"(Forums - Iterative Refinement? How does increasing or decreasing volume play a role in reading ibgs's?
-
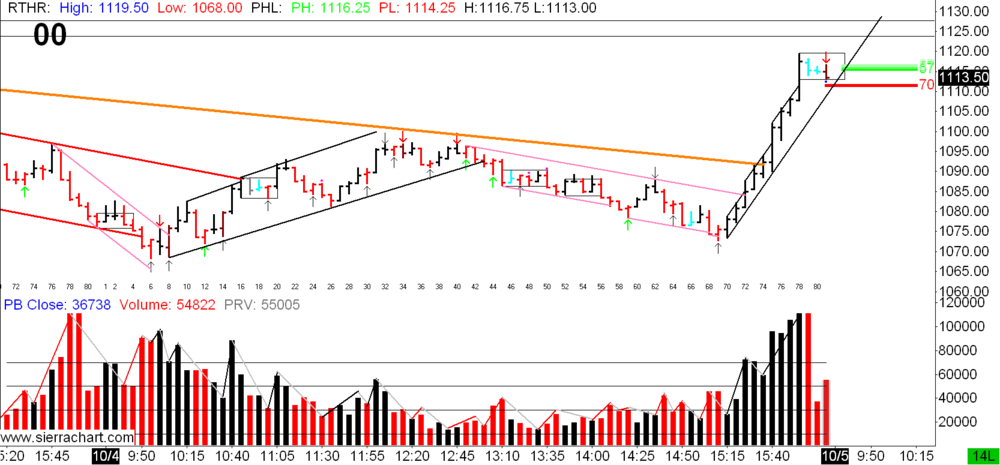
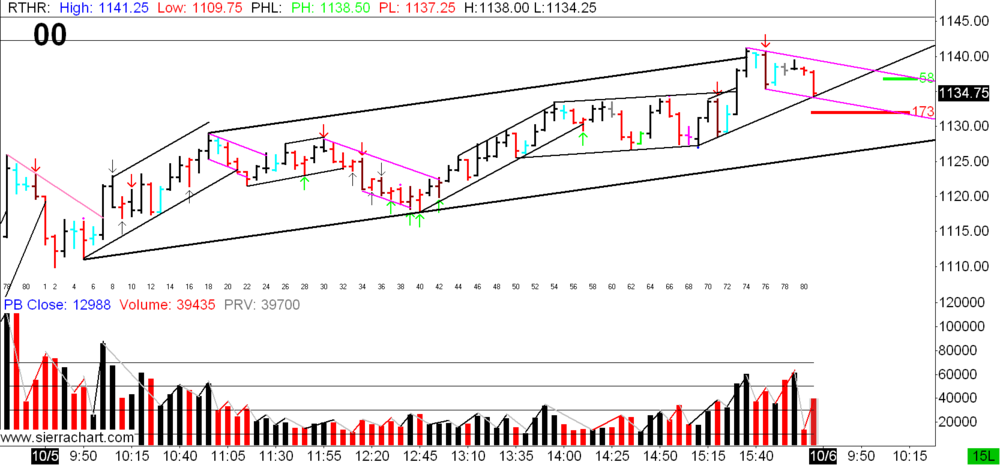
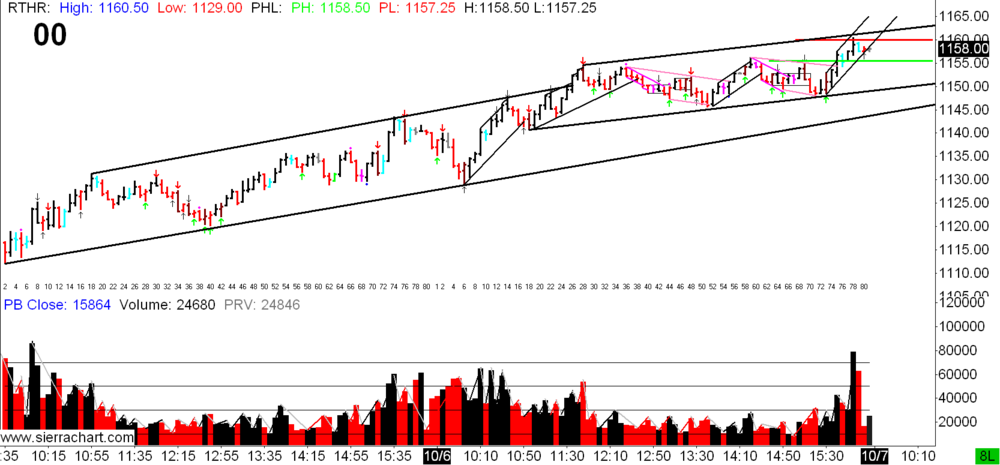
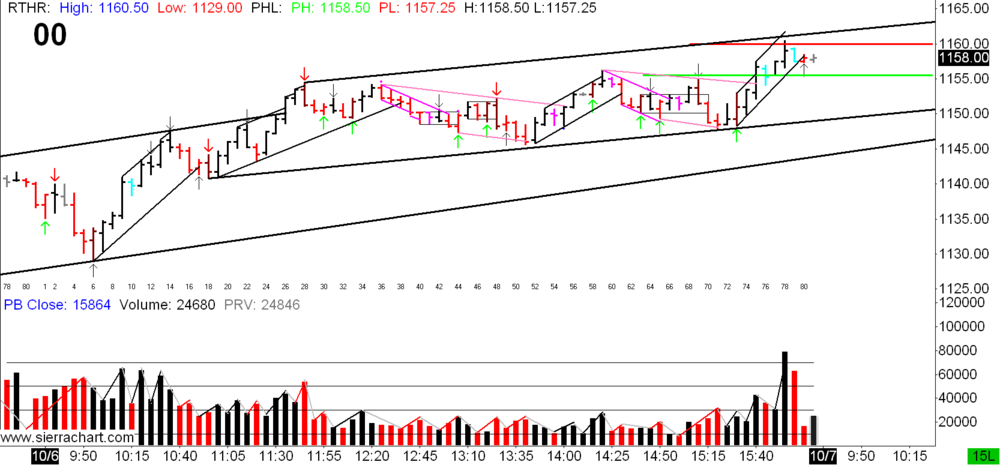
10-7-11 degapped rth ES.For those interested the following are auto generated to help read the market.Green up and Red down arrows = increasing volume ibgs.Black up and down arrows = decreasing volume ibgs.Pink dot(on top of bars)=down stitch.Dark blue dot(on bottom of bars) = up stitch.Lite blue colored bar=sym bar.Lite green colored bar = decreasing volume ftp with bar close above open.Pink colored bar = decreasing volume fbp with bar close below open.Gray colored bars are all other ftp's or fbp's or eh's.hth
-
here's the rest of the week.hth
-
here's a couple of days worth and 10-6-11.hth
-
Have a look at Spyder's Bar by Bar,On bar 1, he speaks about increasing black volume and the price closes inside the previous bar, so a short is initiated. That black bar should be a red bar since the close is lower than the open, why is it black?
http://www.elitetrader.com/vb/attachment.php?s=&postid=2059121
-
Stop trading.Step away from the keyboard.Get your financial house in order.Take the time to learn to read the market.Learn to anticipate the market "turns" in all market conditions.The market will be here when you have done the work.hth
-
down container at bookmark(horizontal black line extended to right from pt 2)

-
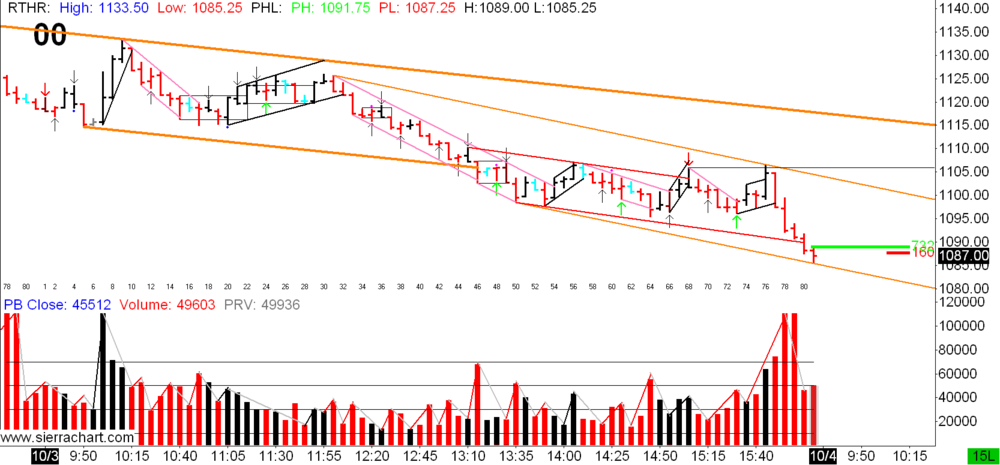
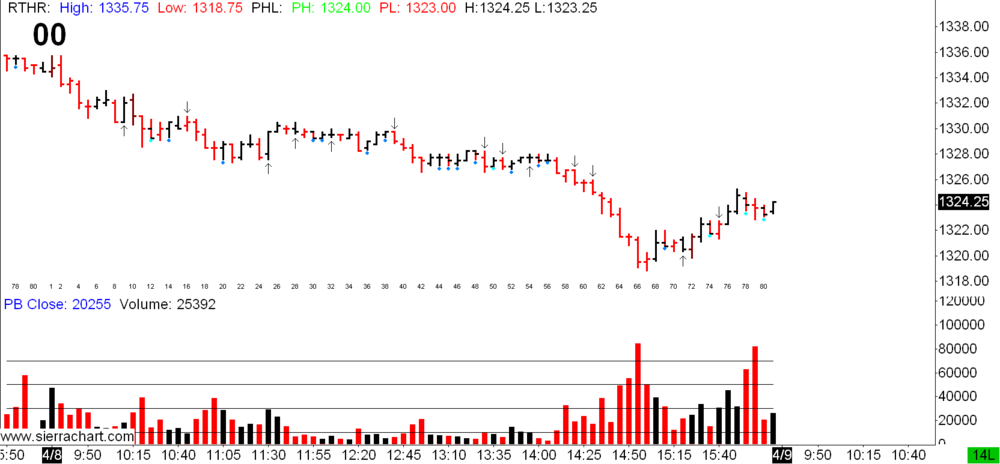
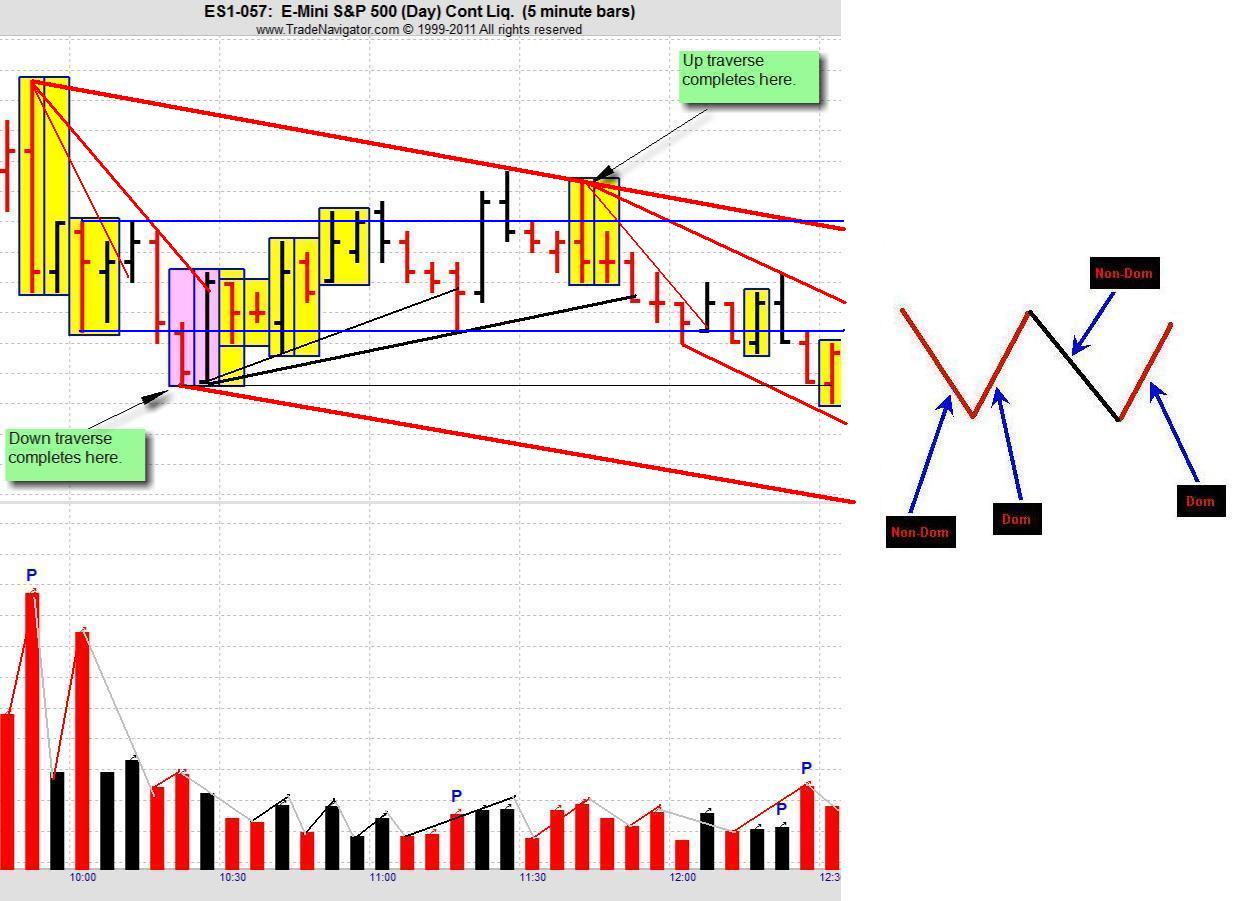
I thought this might be a fun sequence to bring up for discussion. I have it on "good authority" that this snippet represents a Traverse. For context, this is a non-dominant traverse of a down channel. We have a complete skinny cycle up to 1105, then a down tape followed by an up tape. Would you have seen it as such? Why or why not?Did your "good authority" also mention that the snippet may represent a lateral(thanks to cnms2 for posting chart with sym lateral highlited) traverse? The sym lateral created a non-dom boundary on bar 6 and every time the bulls tried to breakout of the lateral they failed.Bar 19 not only failed to breakout of the skinny up container's rtl but also bounced off the bottom of the sym lateral.Pace dropped off which many times leads to the sequences "stretching out"(faster fractals become visible).Maybe friday's(4-8-11) chart starting with bar 11 may be interesting to discuss.hth
-
a diagram would be nice...please see highlites on price and volume panes and the sequence that follows which completes the faster container nested within the slower container.hth
-
I'm stuck. Today, March 23, at 14:50, the 2 min YM began a run up that lasted for about 8 minutes. At the same time volume was decreasing. This was indicative of a black non dom retrace in a red channel, but it was a dom move in a black channel. Therefore, this would suggest I was on the wrong fractal. But if there is another larger red fractal that makes sense of this, I can't find it. What am I missing? Any explanation of this would be helpful to me. TIA."Decreasing black Volume represents either a retrace of a down channel or lateral movement in an up channel"(see comments by spydertrader on page 598 in ET).Hmm, dbv can be lateral movement in an UP trend.But what about where price goes up on dbv in an UP trend? When the market reaches Pt 3(usually in a slower container that is being build)sometimes high pace acceleration occurs soon after.This shows up in the volume pane as a large increasing black volume bar in an up trend.The market is building a faster container to attempt to traverse to the LTL of the slower container.As the market continues to build the faster container after the large volume bar the market sometimes trends up on dbv until it reaches it's pt 2 of the faster container.The amount of upward price movement varies but usually there is alot of overlap.Once the market reaches it's pt 2 of this faster container it continues to build the container until completion.hth
-
Hi patrader,Are you referring to the same chart in gucci's #2718 post ? If so, bar 58, which should be at 2:20 pm (EST) - it is showing dbv and not bo of the dark blue channel. So I am not sure which chart are you referring to or the time on the chart is not on EST ?
TQ.
Don't you just luv(not) this form of communication.In frenchfry's #2757 post there is a chart that shows a portion of gucci's larger chart from #2718 post.Frenchfry was so kind to put bar numbers on his chart post.My comments about bar numbers refer to bars on frenchfry's chart with matching numbers.Vienna was nice enough to post a chart (#2781)that highlites the bars in question.Use gucci's chart for bigger picture (slower containers) and frenchfry's for more detail on the last slower down container and the faster containers nested within it.hth
-
I must be missing something? Please see attached...BTW, this bar-by-bar stuff is super helpful- thanks!!!Good eye.Actually my comments apply to the next bar (bar 48).hth
-
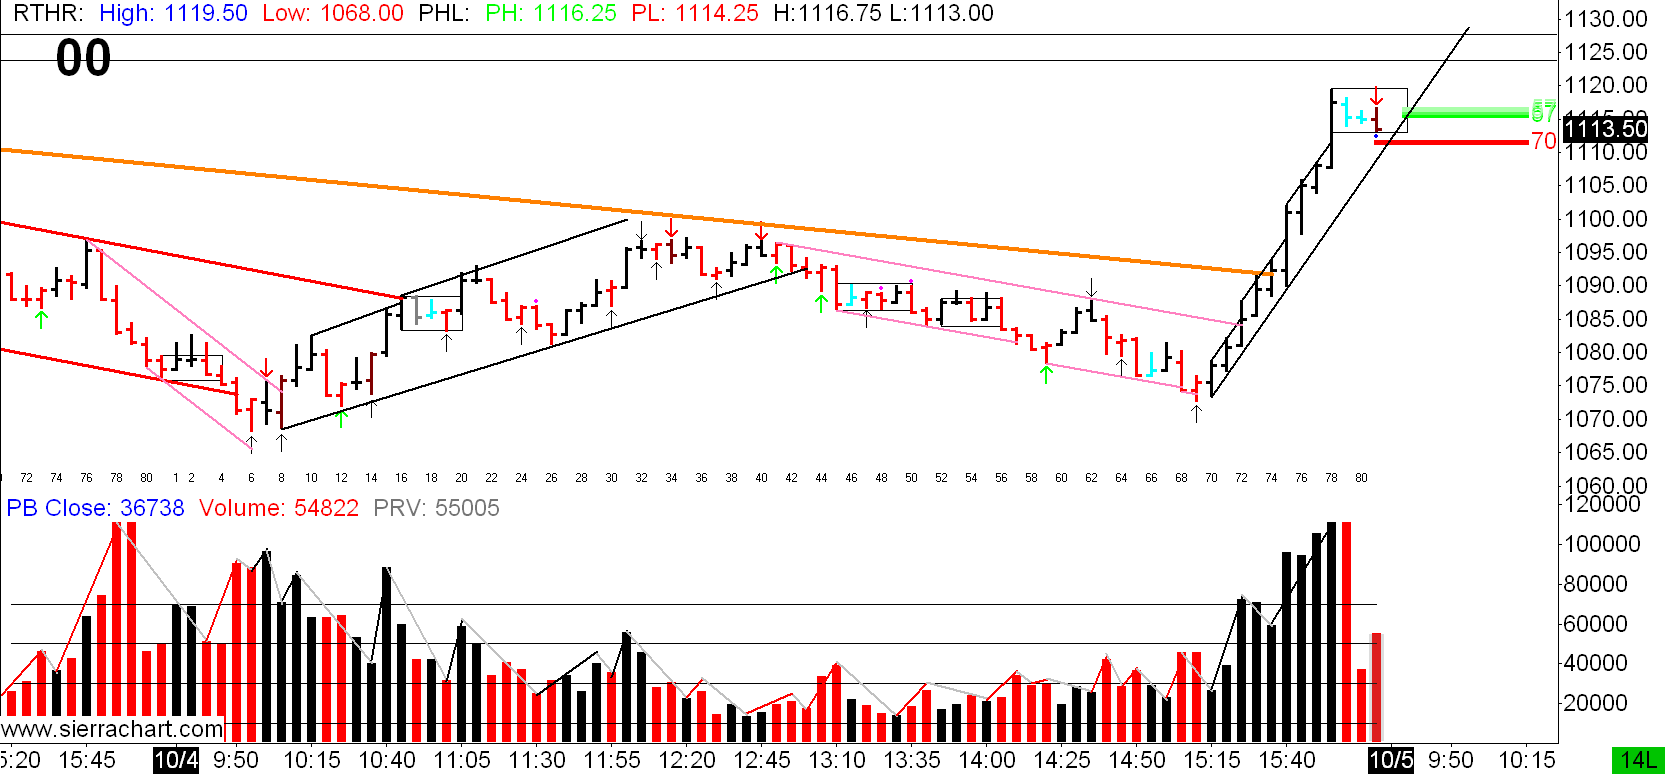
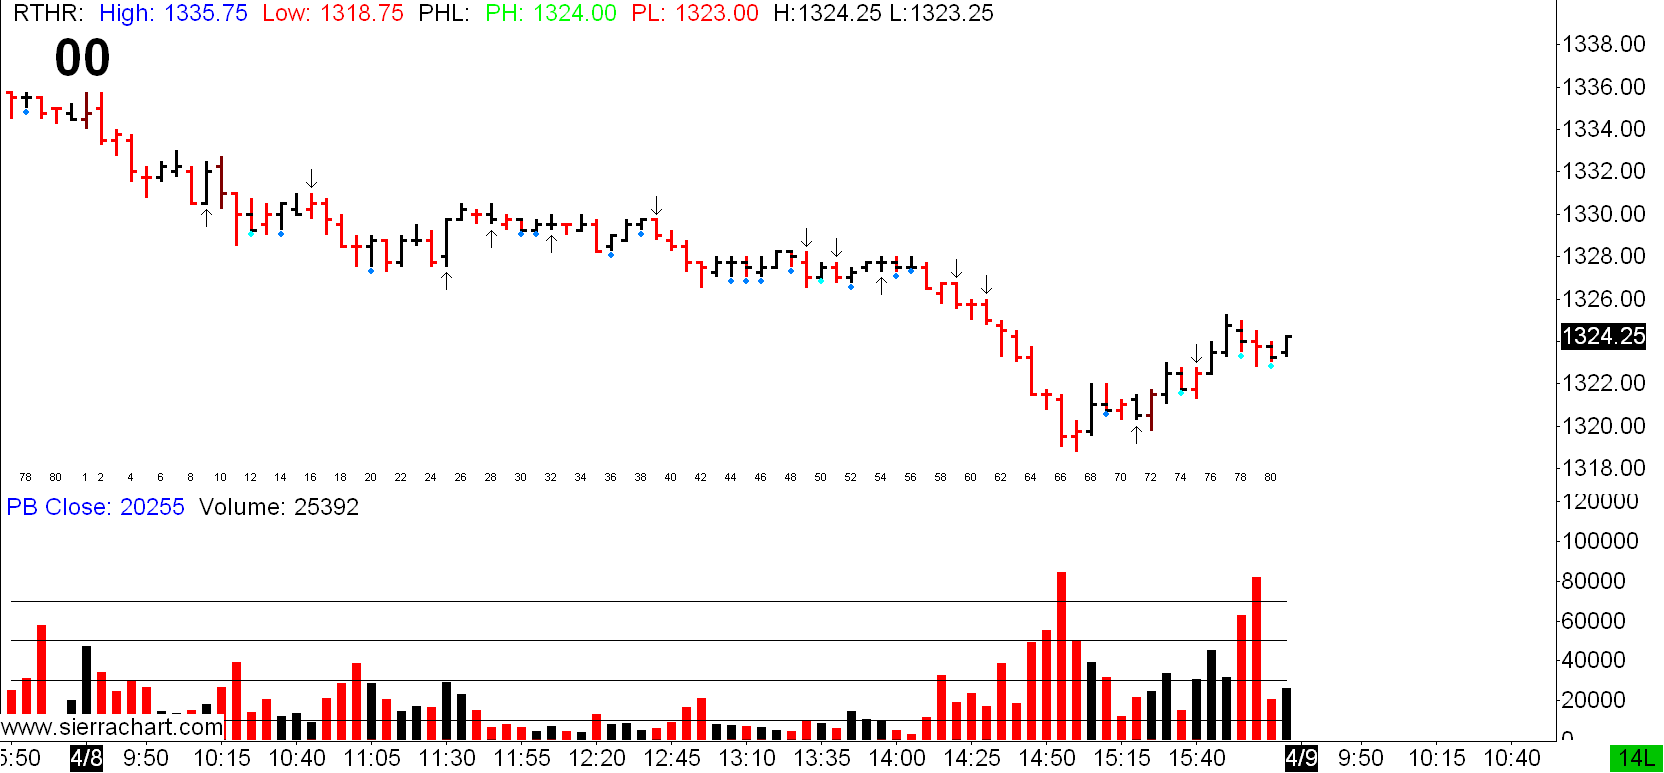
Looking at this, how would you have known that any bar after bar 68 would/could NOT be the BO of the thick red down container? Or maybe it was?The answers are somewhere within:
a) Order of events
b) Peaks and throughs
c) Lateral
d) Fractal nesting of containers
e) Gaussians
In THIS example I was "confident" that we would end up the way it is right now. However trading it with real money I would probably had been whipsawed.
By now maybe some of you already start to see how they would know that they know what must come next. I hope to join you soon.

Good luck.
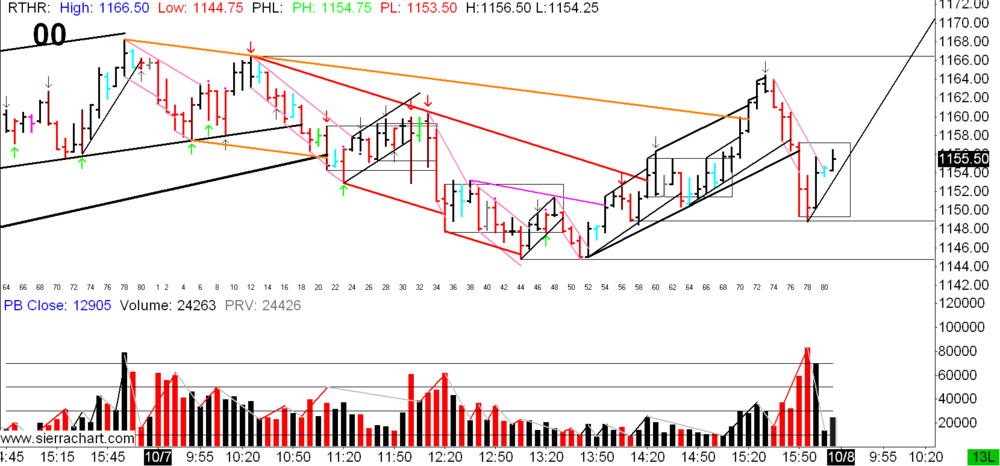
Review the chart in gucci's #2718 post(page 272).Pay close attention to the dark blue up container's tls,dark red down container's tls and the thicker light green container's tls(at the extreme top and bottom of the chart).The thicker light green container is the slowest container that the market is building with the dark blue and dark red containers.On bar 58 the market bo of the dark blue up containers rtl on irv.What ensued was a faster down container that after pt 3(bar 62) ve'ed the ltl(bar 65).When the market builds one thing(dark blue up container) it usually builds another thing(possible larger slower down container) in the opposite direction.So if a trader is anticipating a larger slower down container being build they would read the ve at bar 65 was a possible pt 2 of the larger slower down container.When the market moves from pt 2 to pt 3(in a larger slower down container) it many times moves left to right in a lateral and/or slightly sideways up.Monitoring for a overall pace dropoff in a non-dom is very important .Look at the pace levels in the previous dark blue up container.Now look at the pace levels in this container so far.See the large dropoff in pace in this non-dom move.Notice the lateral that started on bar 65.See the non-dom sequence that played out starting on bar 68 and ending on bar 76 with the ibgs at the top of the lateral.On bar 77 the market confirmed(by making a LL) that the high of bar 76 was the pt 3 of the slower down container the market was building.This is where you fan your rtl to contain the price action(see gucci's red down container's rtl).Check out the irv on bar 77 and the prv irv on bar 78 that is just forming.After pt 3 in a down container the market always has irv.Once the market broke out of the bookmark(bar 65 swing low or pt 2) on bar 77 on irv,the next step is to monitor what happens during the traverse to the ltl of the slower down container.Look for sequence completion of the faster and slower down container being build.Next monitor for a signal for change that leads to a retrace back to the rtl.Then at some point a rtl bo on ibv will occur that begins building another dark blue slower up container to complete building the thicker light green slowest container.Wash,rinse,repeat.hth
-
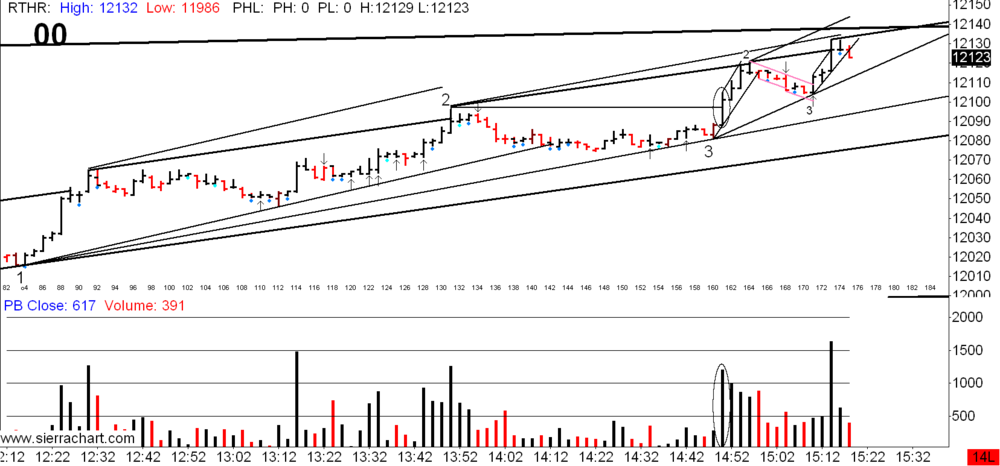
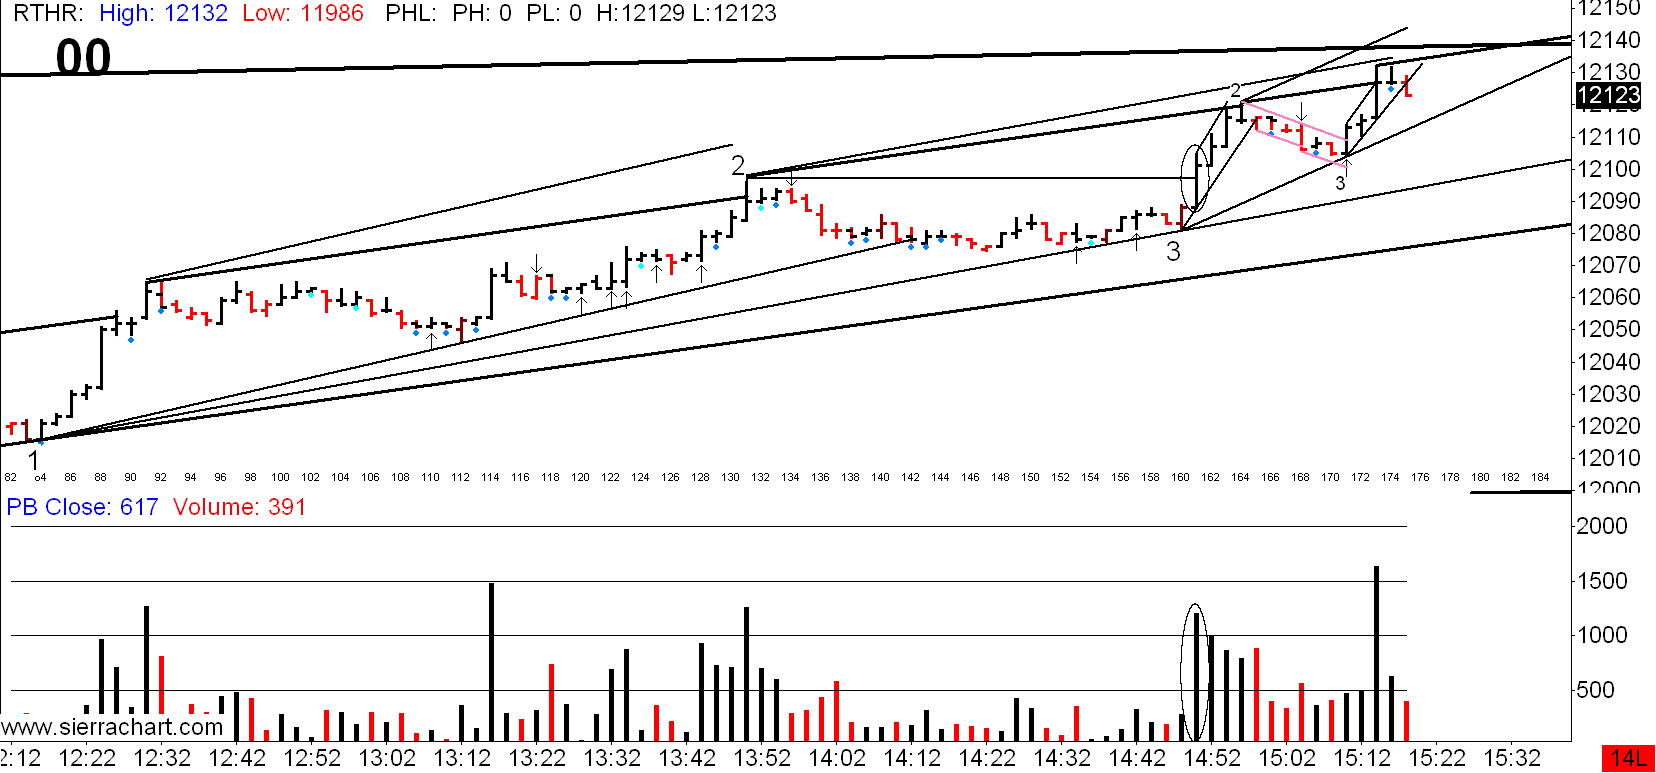
A few bars later we have two times the same situation and are now at the third possible FBOs.Any clues if this will end up the same way (or different) like the other three times? Is this situation any different?
P.S. While I ask, I also try to find answers on the chart myself.
Clues.Bar 49 ve of ltl.Bar 50 drv.Bar 51 bar close(bounce off rtl).bar 55 ibgs on ibv(new pt 3).Bar 56 fails to reach ltl after pt 3 on dbv.bar 57 ibgs(signal for change).Bar 58 strong prv irv to rtl.Also track the different container sequences(faster,medium and slow) and review the context that this container is being build in.hth
-
Now it is clear. But would you have seen it in real time? What were the clues?Check out the prv after price breaks thru the bookmark and heads up to the ltl.This is exactly what you had been anticipating and the market is traversing the container on strong ibv after pt 3(like clockwork).Now you watch for what happens at the ltl for it tells you what to anticipate next.hth
-
This looks better!? Any clues?Prv shows ibv just as anticipated.I would have already drawn in my bookmark(horizontal line extending right from bar 43 swing high(pt 2).This would be the first possible resistance level and min sequence completion point.I would be watching closely each bar's close,pace levels and whether price could first get thru the bookmark and then get to the ltl of the up container.hth
-
Well... could be an FBO!?Bar 46 is near bar close(prv almost complete) and the market has failed to break out of the rtl.Notice that bar 46 is an ibgs.All you need is ibv to confirm pt 3.This is where i would be looking closely at the next bar's prv(especially in the first minute of the bar).Now depending on what resolution you trade you would have either held thru that non-dom(pt2 to pt3) or be looking to enter long.I would have probably anticipated the trap at the rtl and entered at the first sign of the ibgs.Unless you have monitoring down cold i would not recommend intrabar entries.hth
-
What hints do you see now?Trying to trade intrabar with coarse only tools can be troublesome especially if still learning to annotate and monitor.Wait for bar close.hth
-
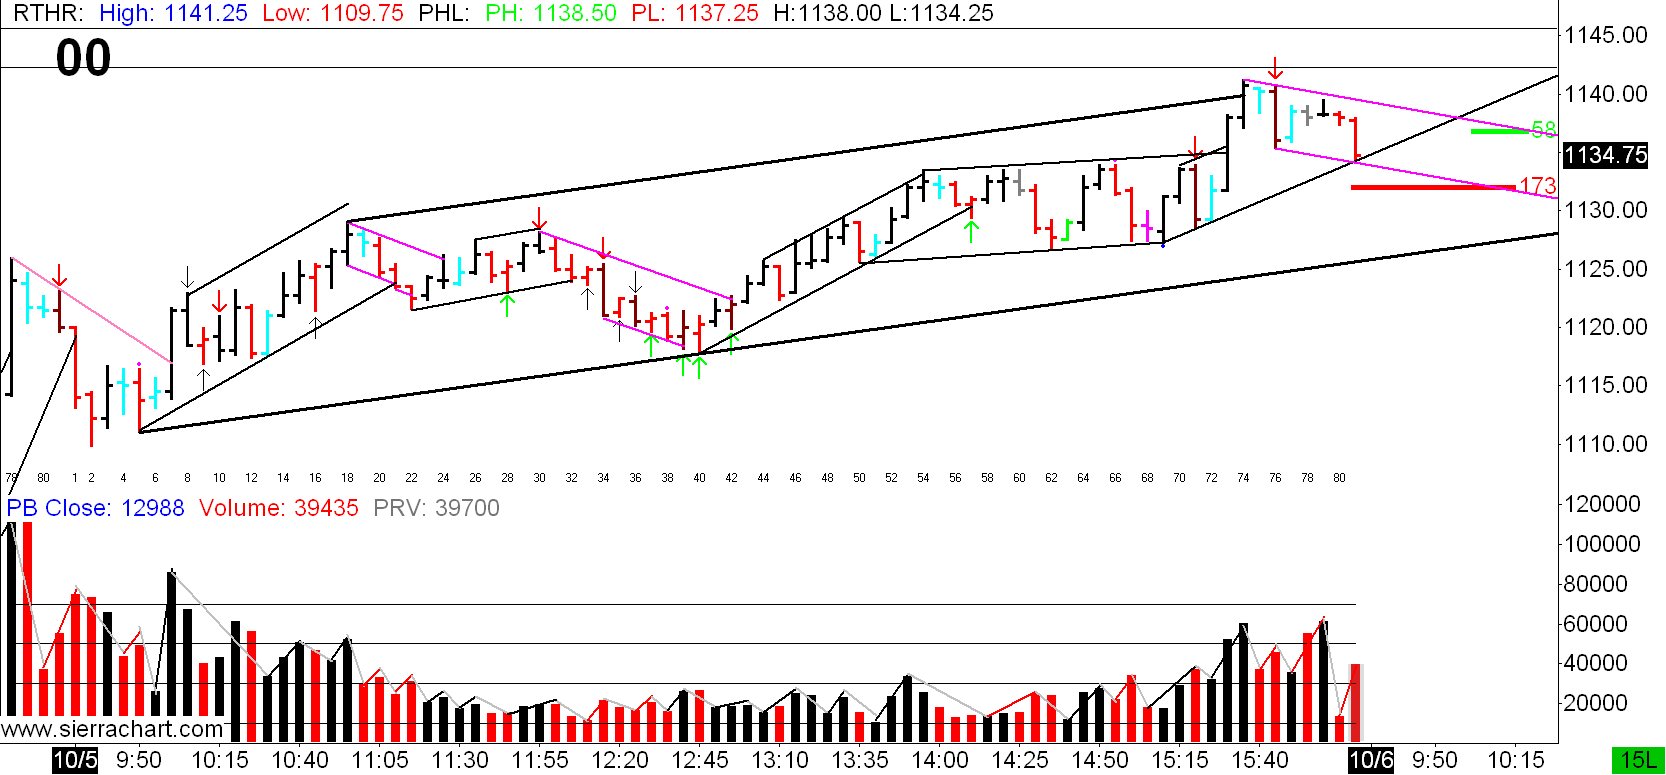
First,bar 39 failed to reach the ltl(ftt) in the down container after pt 3(bar 38).Then bars 40 and 41 retraced back to the rtl of the down container on dbv(like clockwork).Bar 42 broke out on ibv and ve'ed the up container's ltl creating a new pt 2 of up container.Bar 43 ve'ed again but on dbv (creating another new pt 2 location).This is a jokari window so anticipate change.Sure enough it comes on bar 44 with drv.The market is moving from pt 2 to pt 3 in the up container(thicker green container).Bar 45 retraces back to the up container's rtl on drv.This is just what to anticipate in a retrace of an up container.Now your watching for the pt 3 to be created in the up container.Once price has retraced back to the up container's rtl it's time to watch closely for a fbo and then ibv.Many times the market will use an ibgs(setting up a bear trap) at the rtl to fail to break out.This is where i would be looking at the 2m ym for more detail and info.hthFBO or not... which "signs" would tell us that we probably have an FBO?What do you see? Are there any hints of?
-
Here's a suggestion on how to speed up the process of reviewing the jhm journals in ET.First make a list of all the posters in the first futures journal(http://www.elitetrader.com/vb/showthread.php?s=&threadid=83604&perpage=6&pagenumber=1) except Spydertrader.Then go to the home page on ET and click on your "inbox".Then click on "edit ignore list".Put all the usernames in the ignore list except Spydertrader.Now review the first futures journal skipping quickly over the finer tools sections(starts around pg 450). Then move on to the iterative refinement journal(http://www.elitetrader.com/vb/showthread.php?s=&threadid=113310&perpage=6&pagenumber=1) and add to the ignore list any additional usernames.Do all the drills in the journals.Then reread both journals again this time reviewing the finer tools.hth
-
My view of the day, corrected after RTH in pink and grey to see the turns and forks better. Still many errors and I will need to do a detailed differentiation on the turns and forks.I have a question - in order to stay in the same fractals, is there a way or particular thing to keep in mind at all times e.g.
1. I originally annotated that the 2R retracement (bar 21 to 32) ended on bar 32 but reviewed later to see that it should end at bar 26
2. bar 61 to 65 revealed a faster fractal gaussians, at that point in time, my mind was telling me my B2B from bar 56 to 60 MIGHT be a 2B retracement being completed , and the final 2R move is on the way with a BO r2r bar 65. The only signal I see was volume was low. So in order not to jump a fractal and maintain the outlook that bars 61 to 65 is but a faster fractal, what must one do when monitoring the volume and gaussian pane ?
TQIA
Many times the market will move from pt 2 to pt 3 of a container using a lateral.The market created a boundary on bar 63 creating a sym lateral that started on bar 60.Also volume (pace) levels decreased in the sym lateral showing non-dominance.Once the market creates a lateral a trader anticipates pt 3 and dominance(ibv) returning to complete the sequence.hth
-
Thanks cnms2, for the clarification.Vienna, if I may add, I had mistaken the blue container sequence completion at 13:25 in the chart referred to in that post . Gucci's precise annotation showed the sequence completion at 13:50. I had also failed to see the VE after the point 3 of the blue container which should have alerted me that the sequence is yet uncompleted. After the final sequence completion, a new R2R would have to have the pt 2 outside the previous blue container.
TQ for the question.
I keep a copy pasted to one of my monitors of CP4(http://www.traderslaboratory.com/forums/attachments/34/12221d1247803502-price-volume-relationship-clean_page_4.jpg).Notice the post FTT consideration comment "Region for pt2 of forming channel:1.after FTT and 2.To the right of the RTL".It's amazing how much is contained in this one little document.I believe that a lot could be obtained by further discussion about CP4(in particular post FTT considerations in Regions for pt3 including the Region for revised pt 3 of old channel).hth


The Price / Volume Relationship
in Technical Analysis
Posted · Edited by patrader
pay attention to spydertrader's drawings! Excellent advice.I have drawn in some of the more important carryover container info on the attached post.This is why it's so important to have the carryover rtl's extended to the right of your screens(degapping very helpful also) and to use different levels of thickness to show which container each rtl applies to.I also circled the pt 2's of the different container levels that have been previously annotated by spyder.Notice that spyder uses a thicker larger number 2 for the traverse level PT 2.hth