
Welcome to the new Traders Laboratory! Please bear with us as we finish the migration over the next few days. If you find any issues, want to leave feedback, get in touch with us, or offer suggestions please post to the Support forum here.


patrader
-
Content Count
287 -
Joined
-
Last visited
Posts posted by patrader
-
-
B2B2R2B and R2R2B2R.Reference materals are forestgaussians.pdf (http://www.traderslaboratory.com/forums/e-mini-futures-trading-laboratory/5920-ideal-volume-channel-up-down-4.html#post66298)posted by spydertrader in Ideal Volume in Channel UP/Down(post #32) and Avi 8 post #2195 in this thread http://www.traderslaboratory.com/forums/technical-analysis/6320-price-volume-relationship-275.html
-
Sequences sequences sequences!!
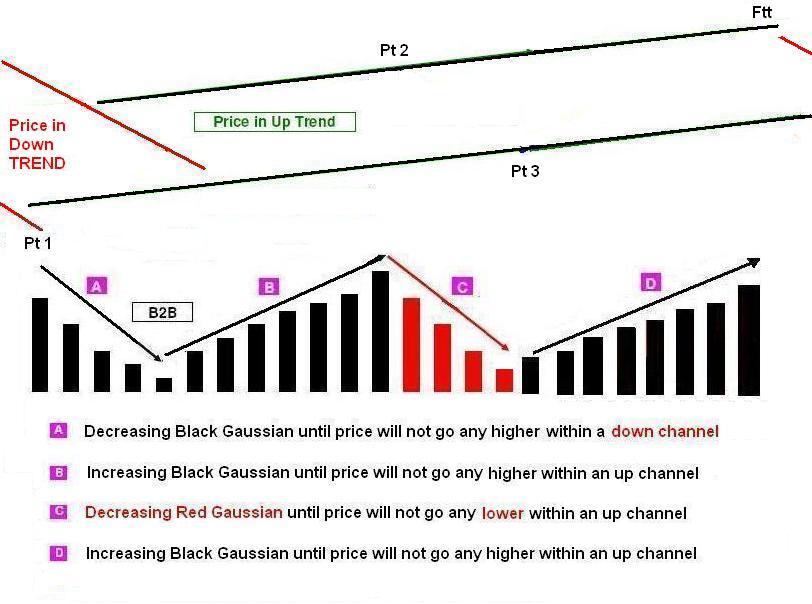
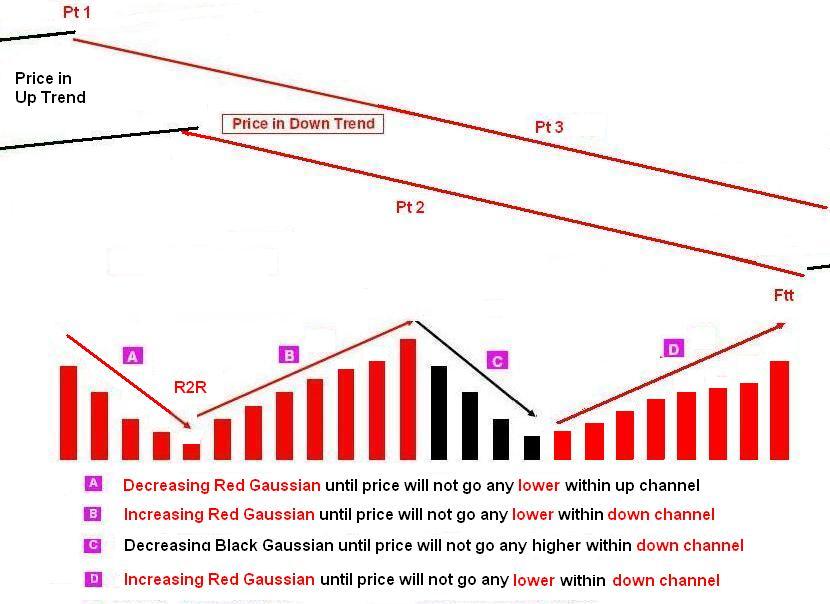
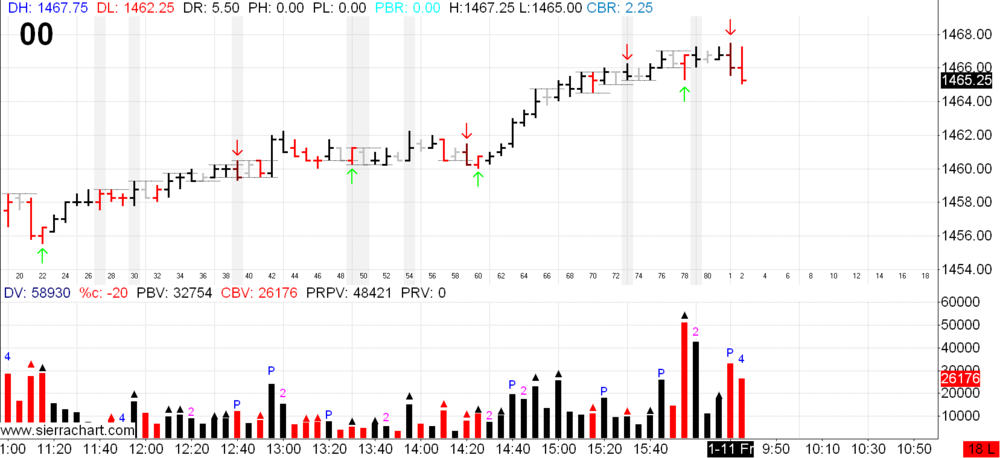
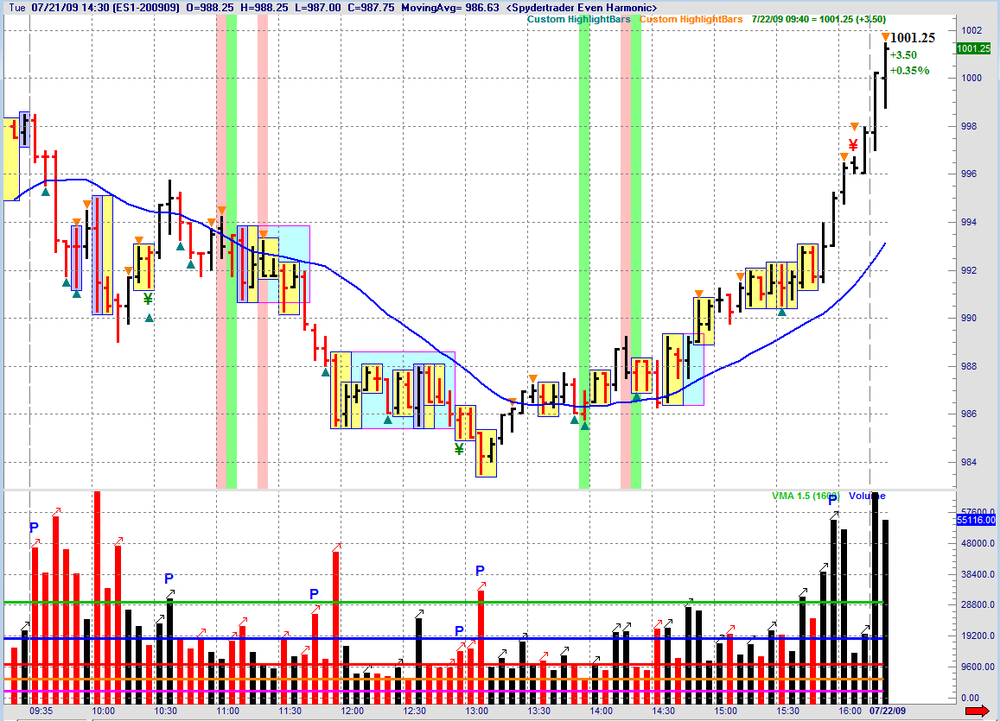
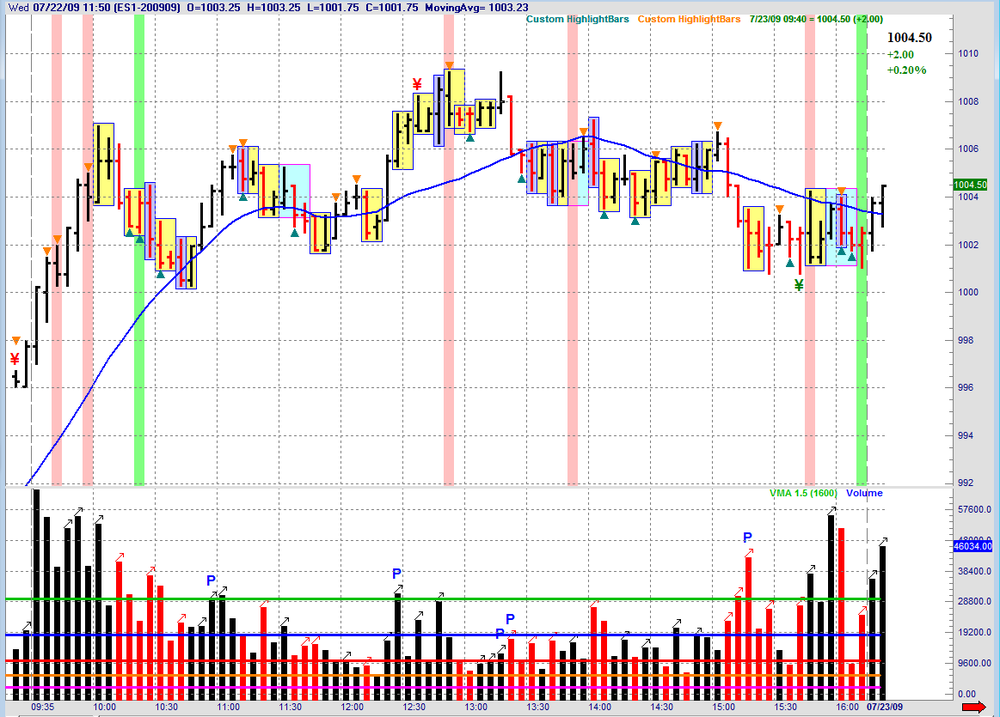
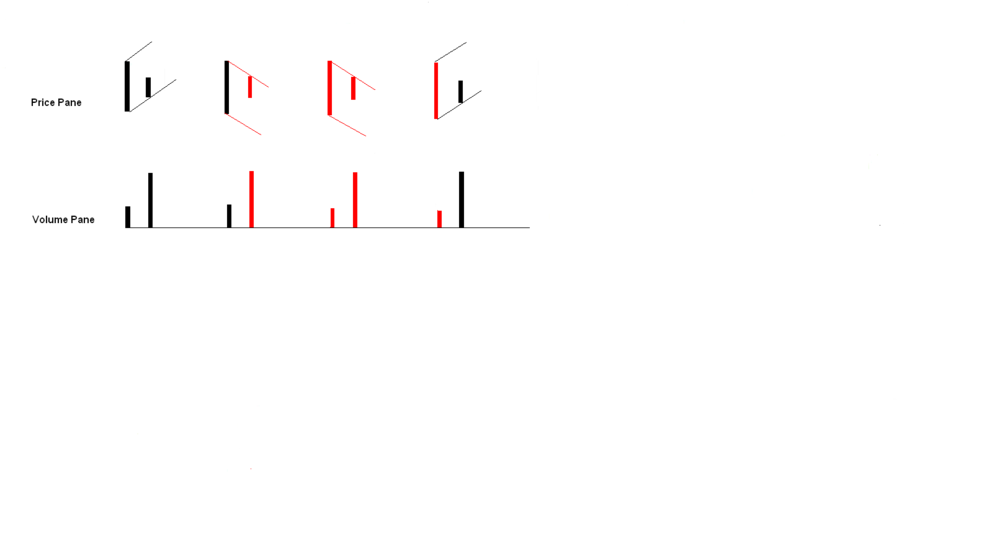
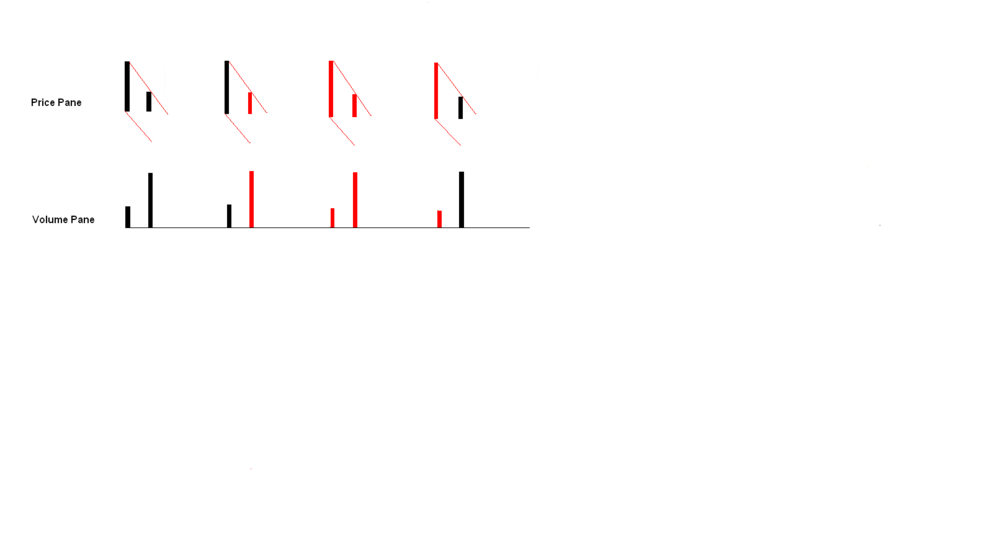
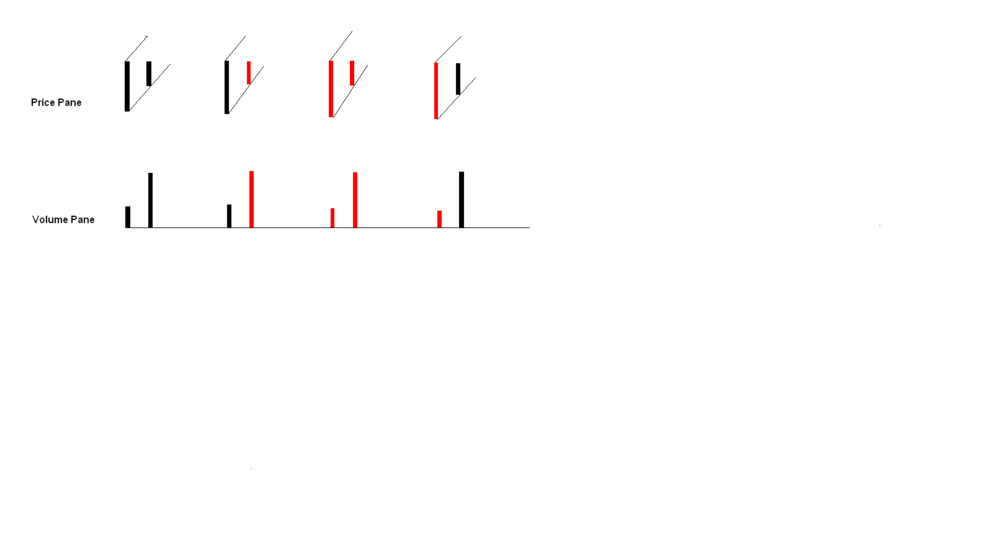
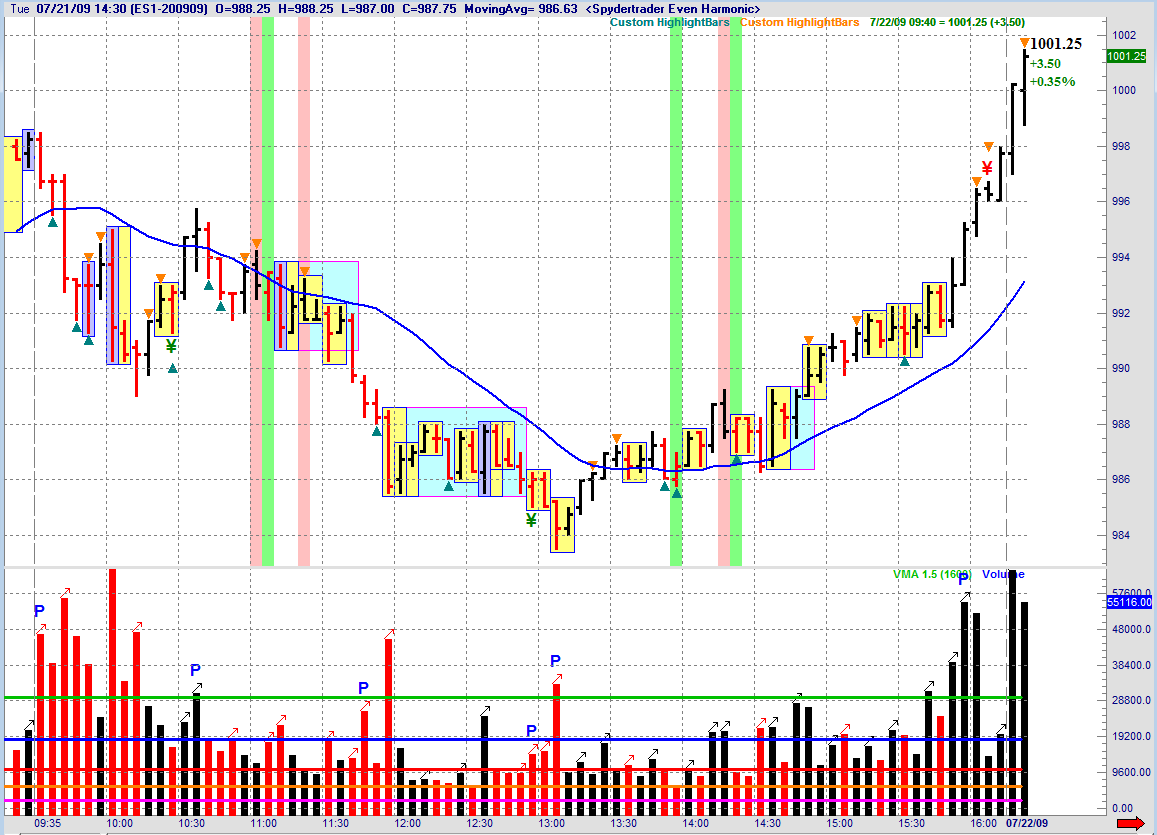
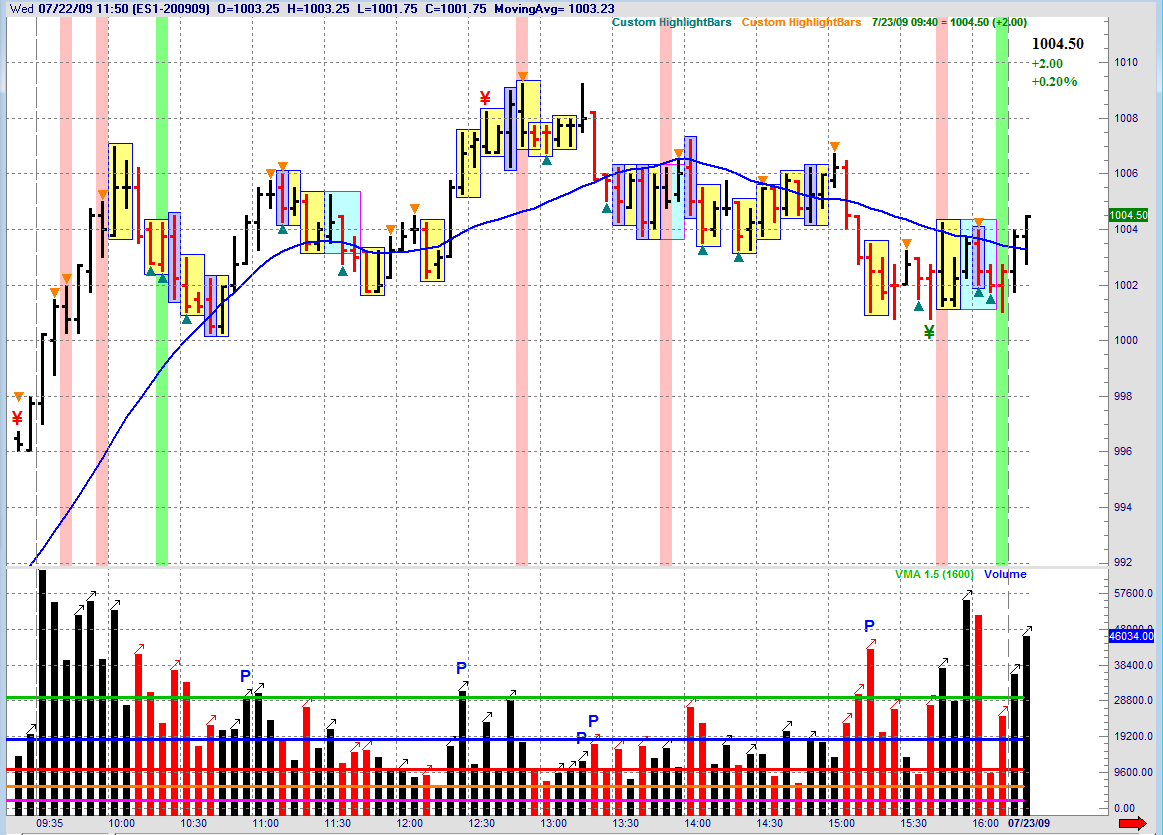
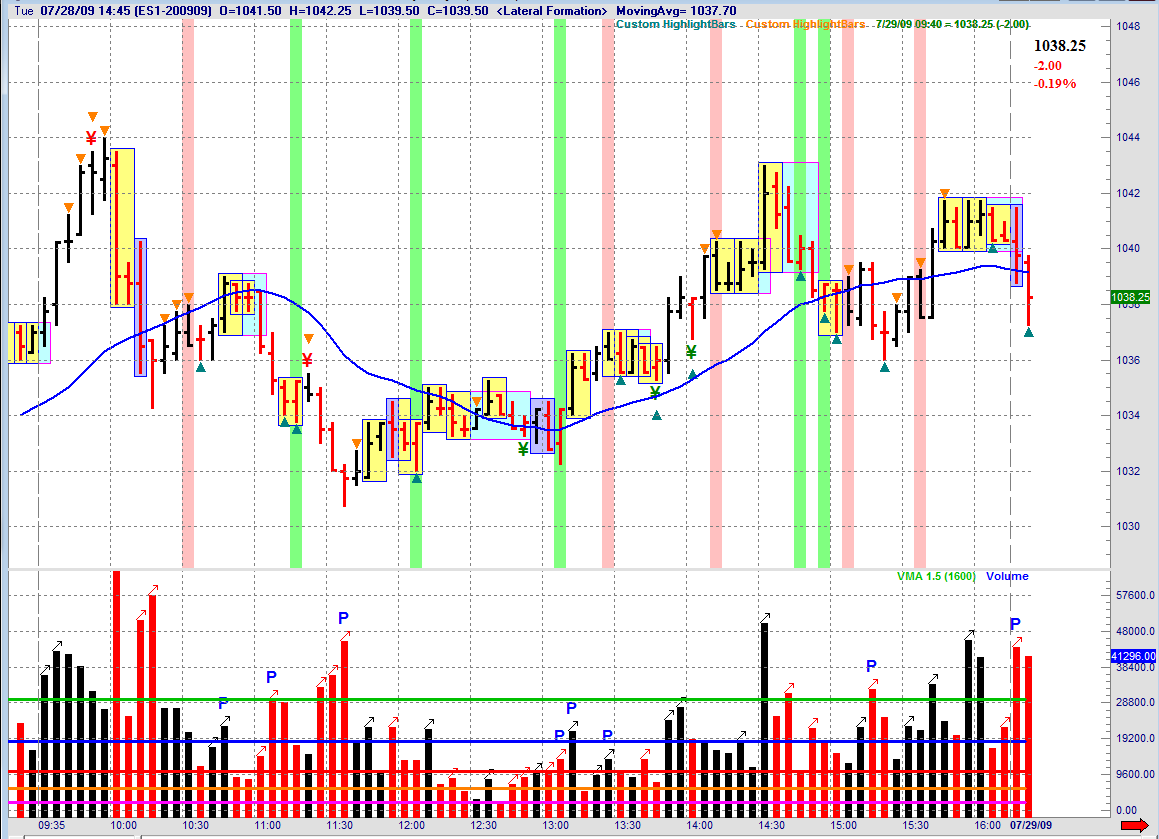
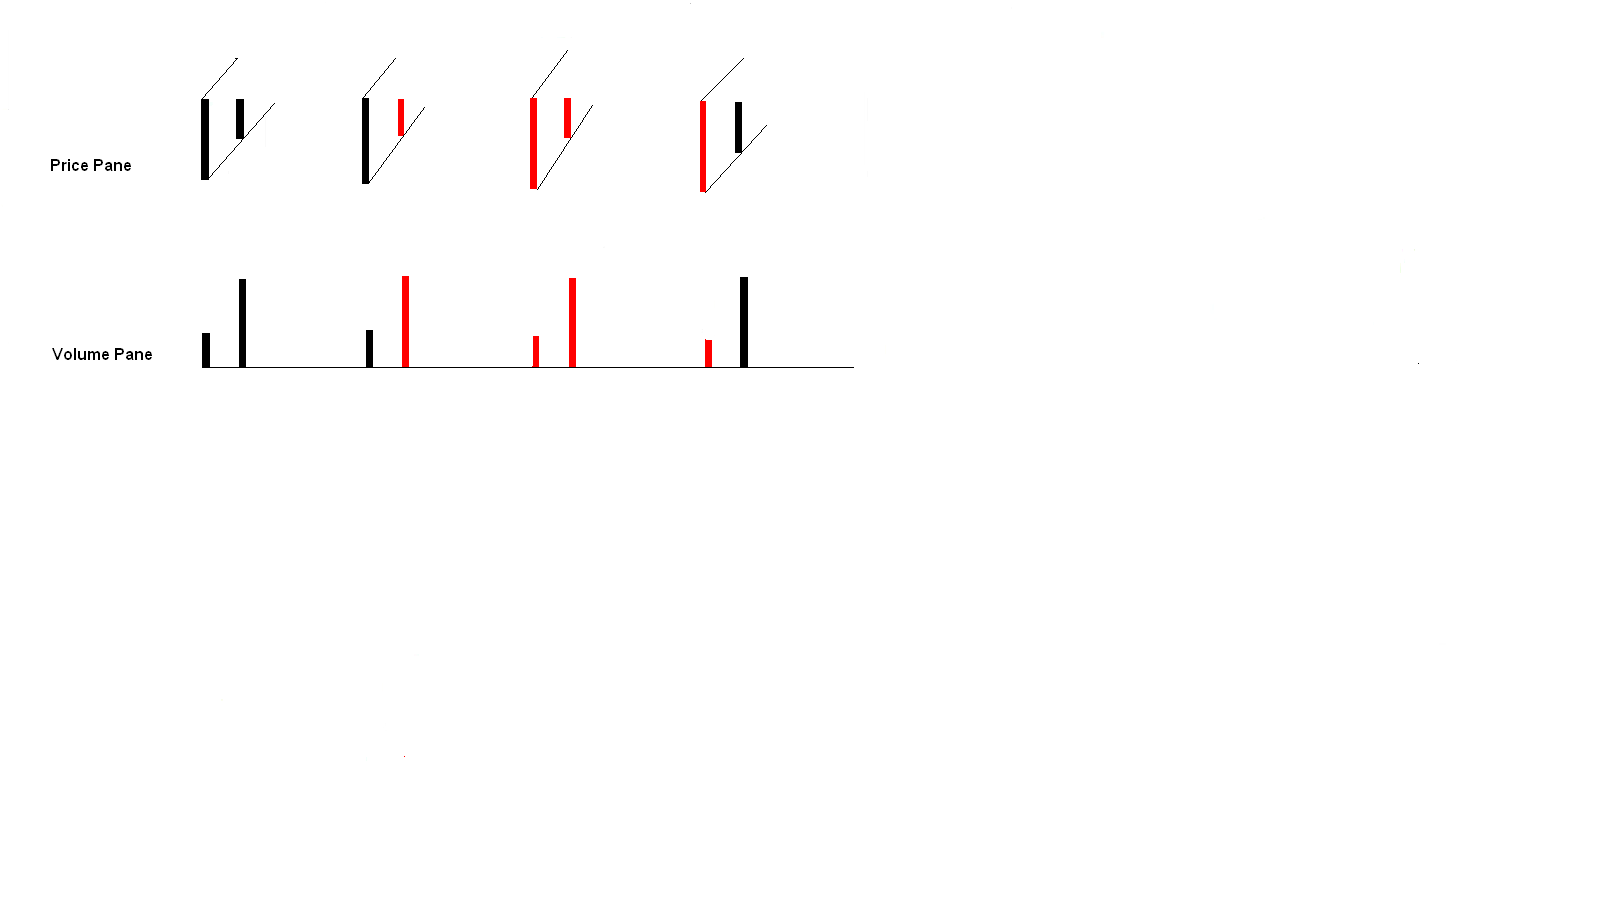
Sure thing. Let's start by taking a look at today's (6-22) S & P 500 E-Mini (The ES) using a five minute chart. Thinking fractally, we want to locate the Volume Sequences which the market displays all day, every day in every market. By describing these Volume Sequences using Volume Color (Black for Up and Red for Down), a trader should expect to see R 2 R 2 B 2 R (for a down trend) and B 2 B 2 R 2 B for an Up Trend. Again, thinking fractally, the market should provide these sequences on each and every trading fractal.An example of a very fast fractal:

An example of a slightly less fast fractal:
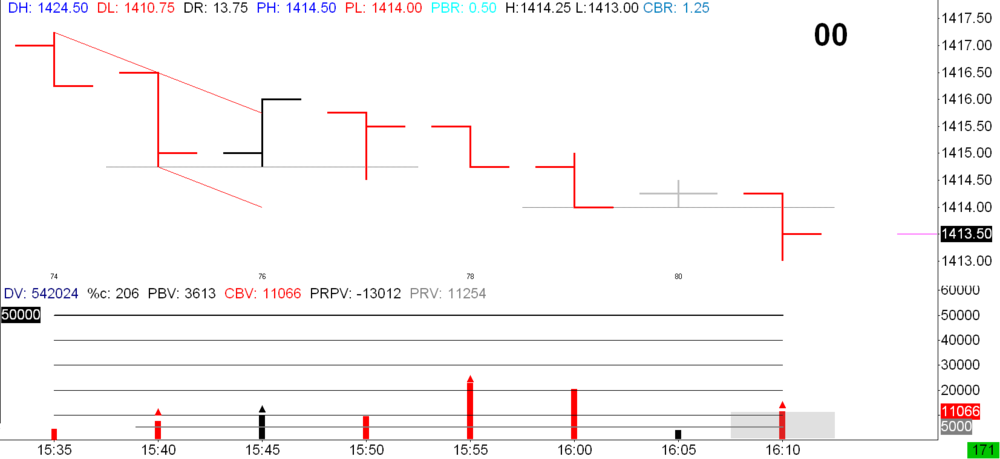
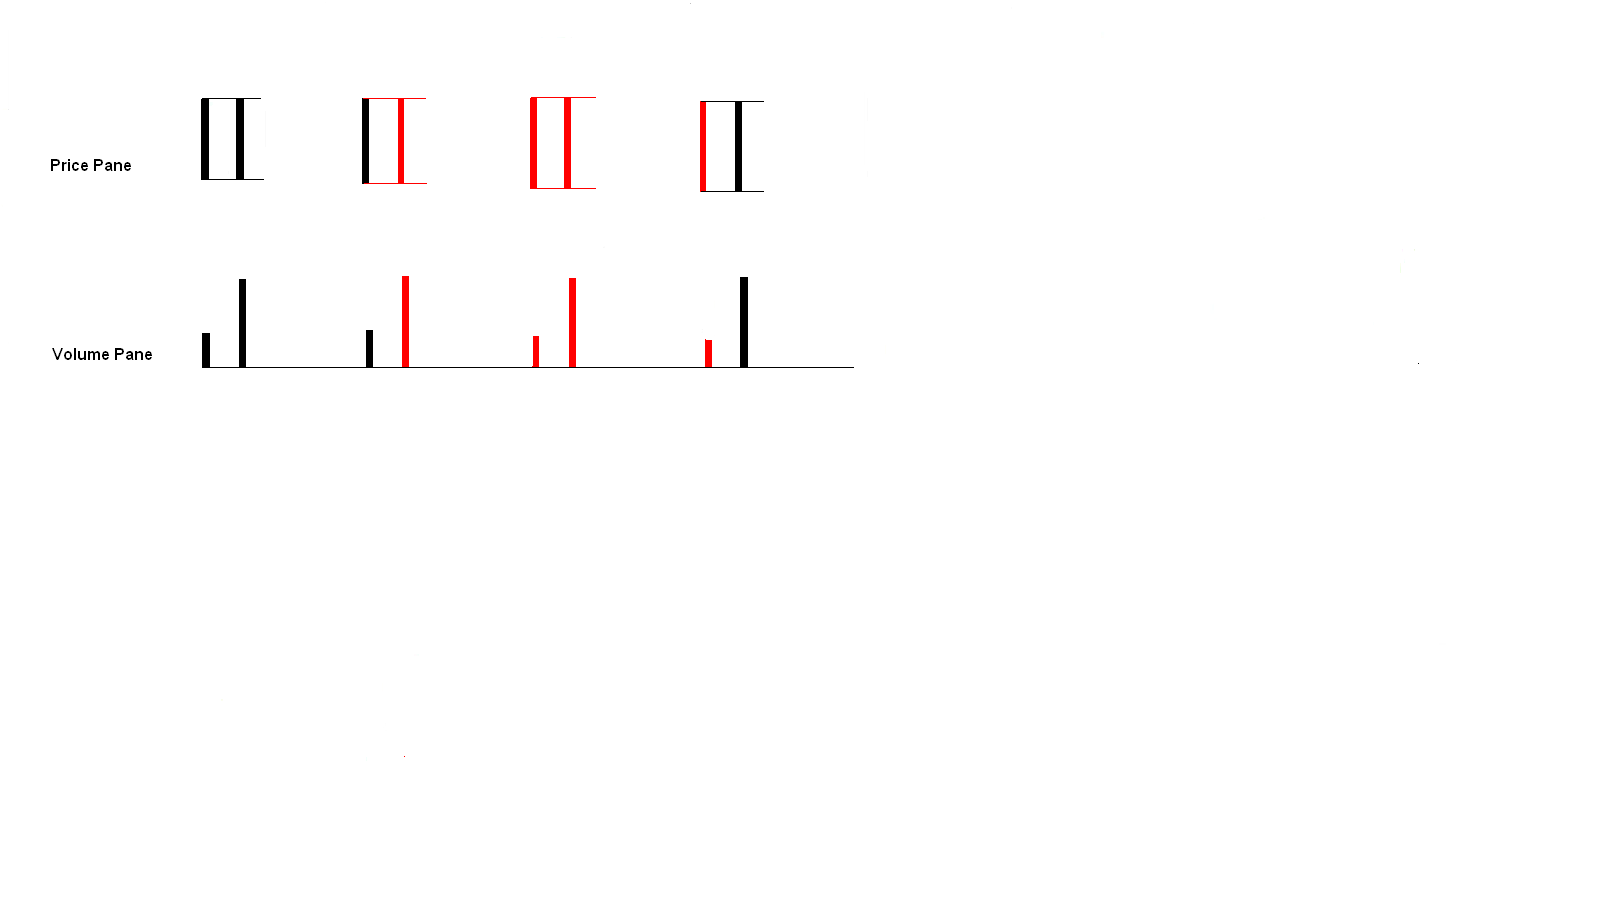
An example of a slow fractal:
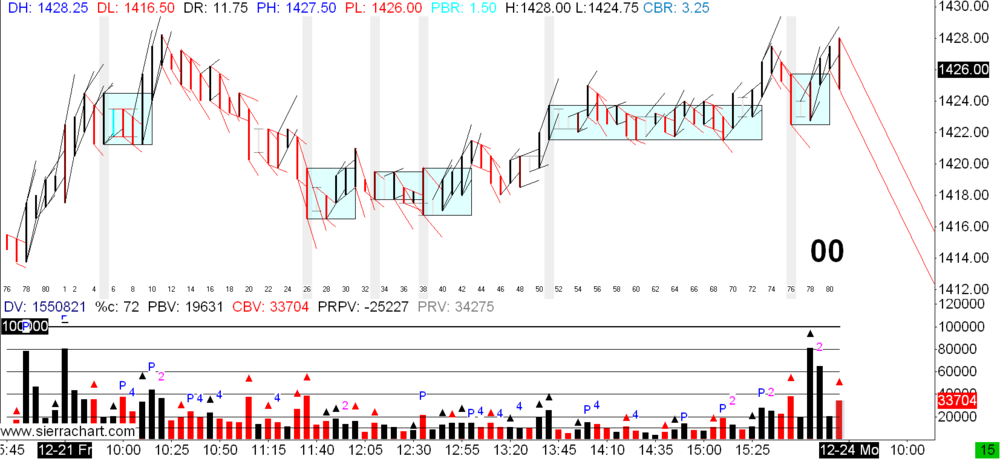
An example of the slowest fractal:
As you can see, irrespective of the chosen fractal, the market provides the same exact sequences. Combine these fractals, and a trader can 'see' that which must complete.
Learning to thoroughly and properly 'contain' Price and Volume in order to more easily see these sequences represents the first step toward profitability.
HTH.
- Spydertrader
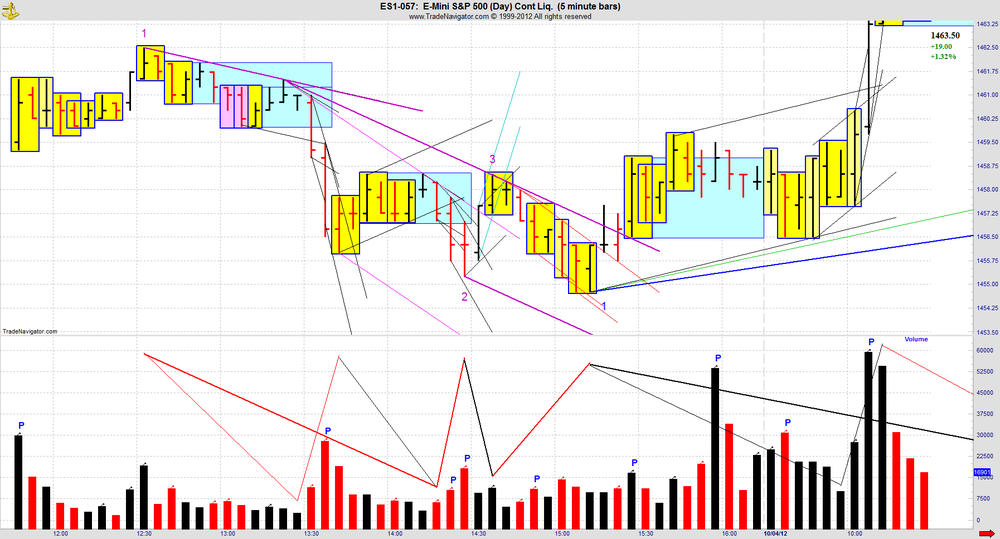
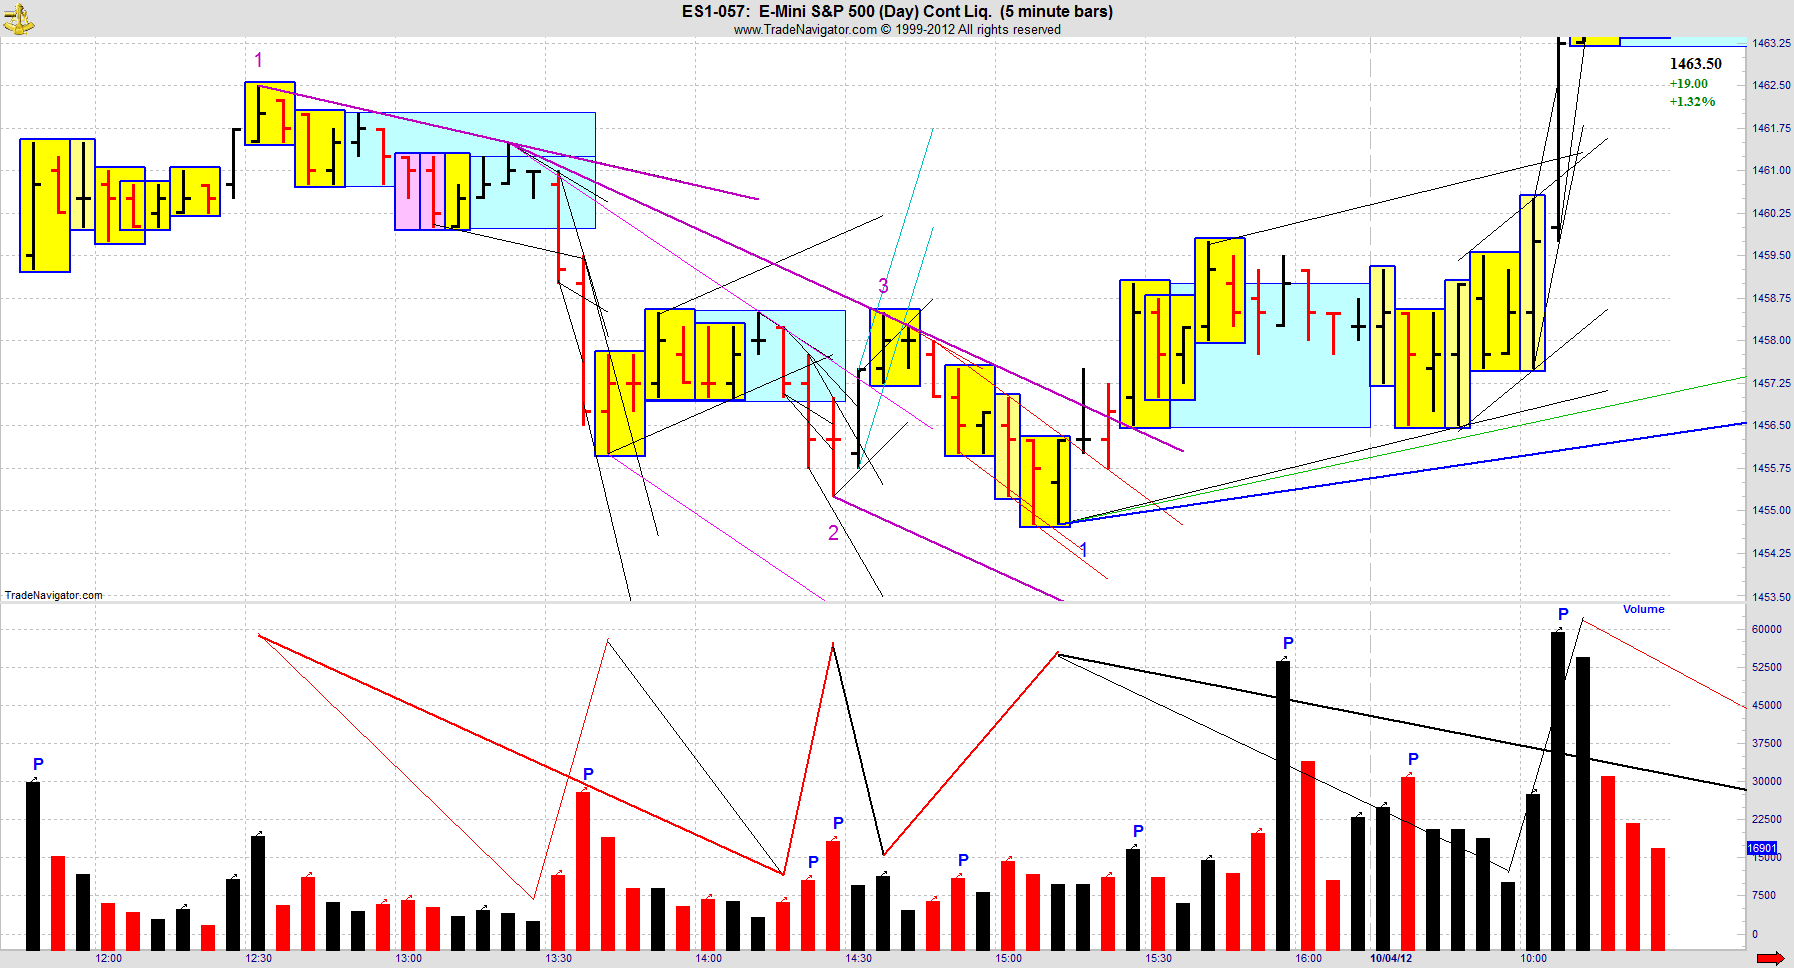
Interestingly enough what i believe is the best examples by spydertrader of sequences are not in this thread but a short lived earlier thread(Open and Free Discussion on Volume).It appears that the fractal encased by thicker purple trendlines in the 10-3-2012 chart by jbarnby corresponds to the slow fractal example.hth
-
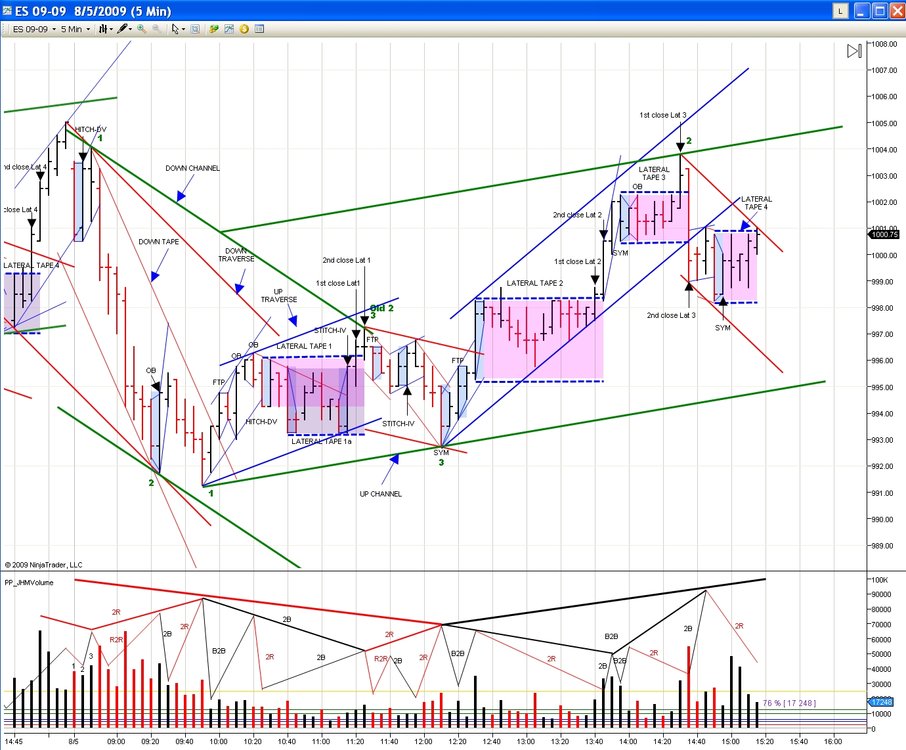
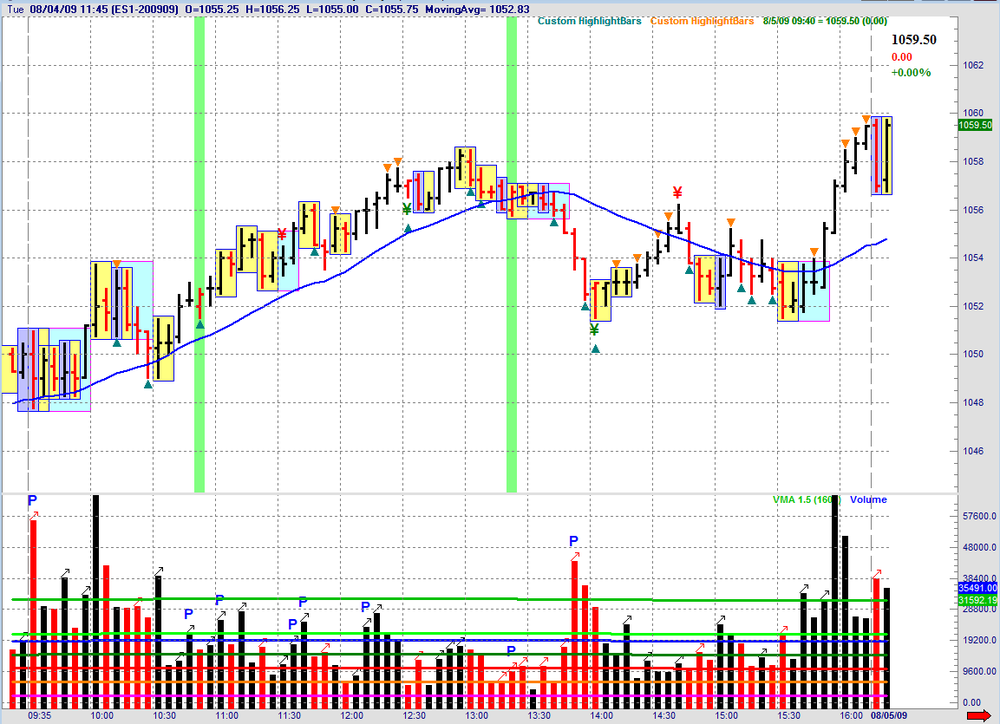
Spyder,I have a question about the attached snippet. Specifically, the 1310 bar on 08/5 (highlighted in yellow). From time to time I run across an area such as this, where I am unable to ftt the bar on any fractal. The gaussians support that this area completes the 2-3 movement, but is that possible with the ve? I'm very familiar with the valuable discussion between Romanus and PointeOne on this topic.
Does such an event tell me that I have taped the area incorrectly? What am I missing here?
.
While the event which you describe may indeed point to errors in annotation technique, in this specific example, no errors exist (with respect to the area under discussion).Either, you do not see something which provides the FTT or you do not see a contextual difference which indicates the possibility an environment exists which has the ability to obscure that which you expect to see.
- Spydertrader
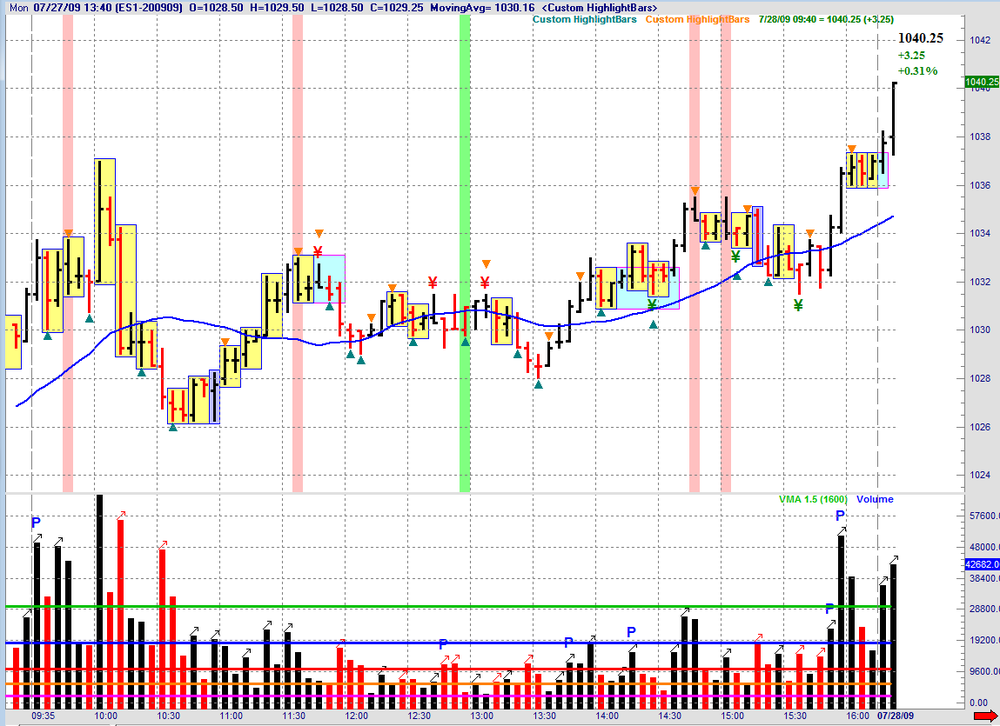
After review, and comparing the 1310 bar from 08/05 to a few others, I notice that volume accelerates in this area in a fashion similar to what we used to call Peak Volume. Seems I recall that PV would frequently mask an FTT on a VE of the tape.Jbarnby,just came across this in the thread and want to thank you for posting this big time.What a huge AH HA.I have attached a chart with volume of the same day so the PEAK VOLUME (which is not labeled on that chart but should have been with a P) can be seen on that bar (keep in mind its the 12:10 bar on that chart due to the labeling of time being off by one hour).hth
-
[/u] As to whether or not an I.B.G.S. on increasing Volume does or does not terminate a lateral. Does it?- Spydertrader
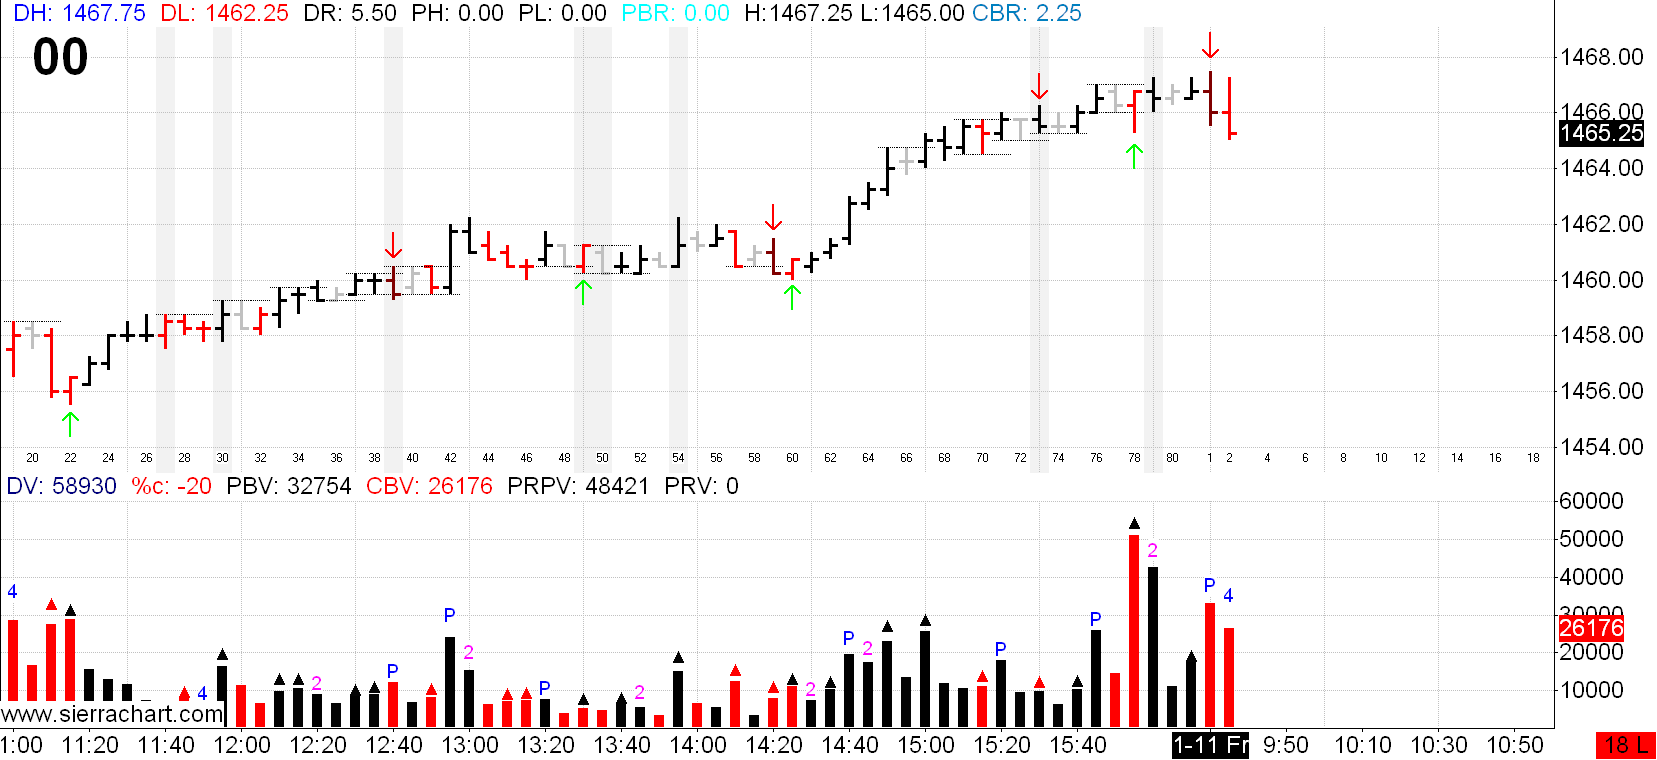
Continuing the refinement of possible ways a lateral formation are terminated (killed) i have found that ibgs's on increasing volume where the ibgs breaks outside the boundary of the lateral does kill it (no matter where the close of the bar).Ibgs's on increasing volume where the high/low are fully inside the lateral boundaries do not kill it.Ibgs's on decreasing volume do not kill a lateral.OB's(outside bars) also follow the same rules as ibgs's when the ob is also an ibgs.hth
-
The lateral formation continues until terminated with two closes outside the Lateral boundaries (created from the High / Low of Bar 1) - except where the 'two closes' form a 'flaw.' In such a case, we require a 'third' close outside the lateral boundary in order to have reached 'termination' of the previous lateral.Here is my latest refinement of ways a lateral can be "killed" (with enlightment from jbarnby).
The lateral formation continues until terminated with two closes outside the Lateral boundaries (created from the High / Low of Bar 1) - except where the 'two closes' form a 'flaw' (internal formation) and the second bar of this internal is on DECREASING VOLUME.In such a case, we require a 'third' close outside the lateral boundary in order to have reached 'termination' of the previous lateral.If the second bar of the internal formation is on INCREASING VOLUME then the lateral is terminated (killed) and does not require the "third" close outside the lateral boundary.hth
-
The question sounds simple enough but it's really a bit more complicated than i can fully explain here.jbarnby,thanks again for your comments.I have many questions but will keep it to one question at a time.Hopefully they're not too complicated to answer here.10-3-2012 at 14:30 est i believe the market completed a down tape fractal (where you placed directly below this bar a purple "2"). Would this be correct?

-
I've had a lot of success with this method. While I'm grateful to spyder for his insights and guidance, most of my success came through self-discovery, using the basics described in this and other threads. I will upload a couple of recent Traverses in hopes that it might encourage others. Success will only come after you achieve complete understanding of how to build containers correctly and manage fractal nesting,Jbarnby,thank you for posting your charts.10-3-2012 at 14:30 est i believe the market completed a down tape putting it at PT 2 of the down traverse.Then two black bars later you put the traverse level PT 3 and annotated a thicker traverse rtl.In this case there was a break of the down tape rtl on ibv on 14:40 est.I believe this increasing black volume bar coupled with the final push down on irv created the traverse fractal.Would this be correct? If in this exact same situation with the only difference being neither 14:35 or 14:40 est were on ibv would the market still create a down traverse or would the fractal stay a down tape (just be fanned)? Tia

-
Such is the nature of this journey, right?
 by starting with a known entity in order to see the exact same event, but in the opposite direction.
- Spydertrader
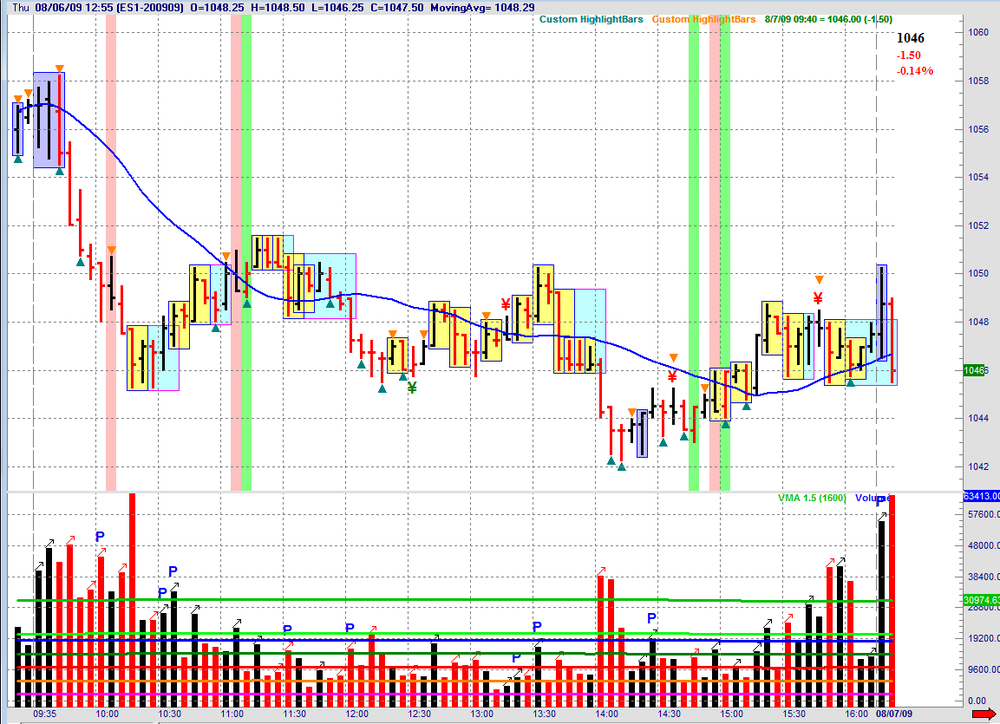
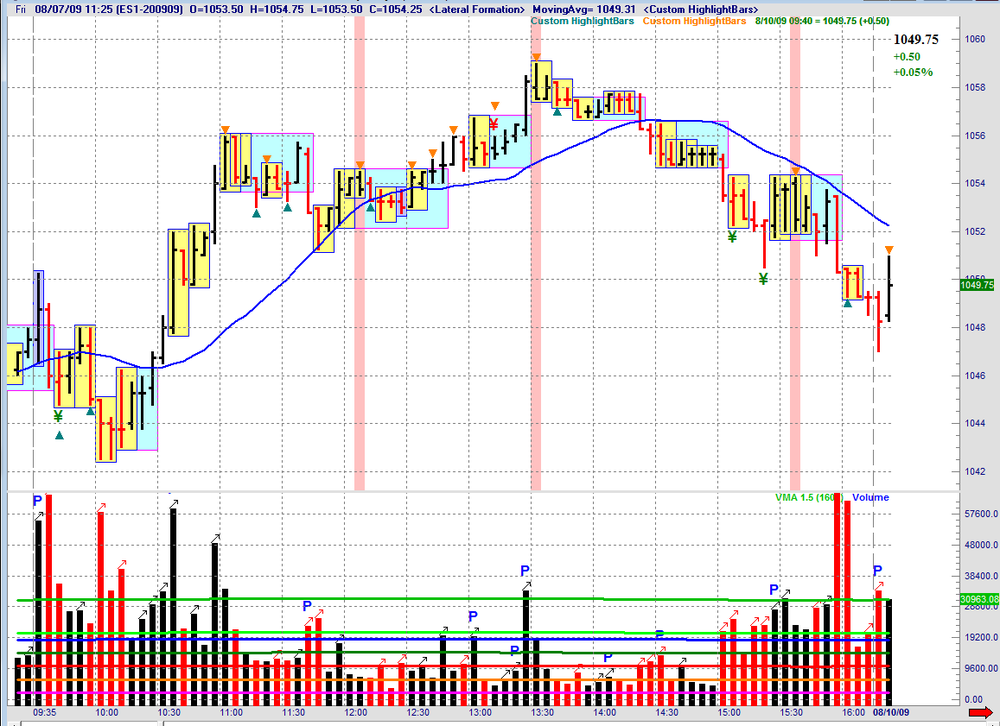
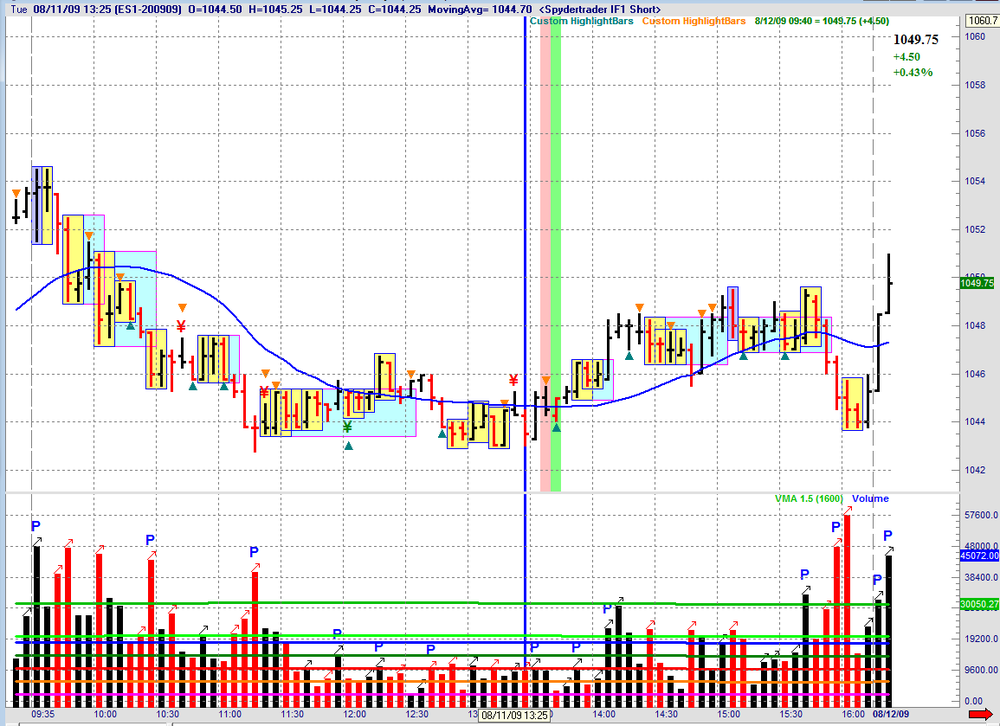
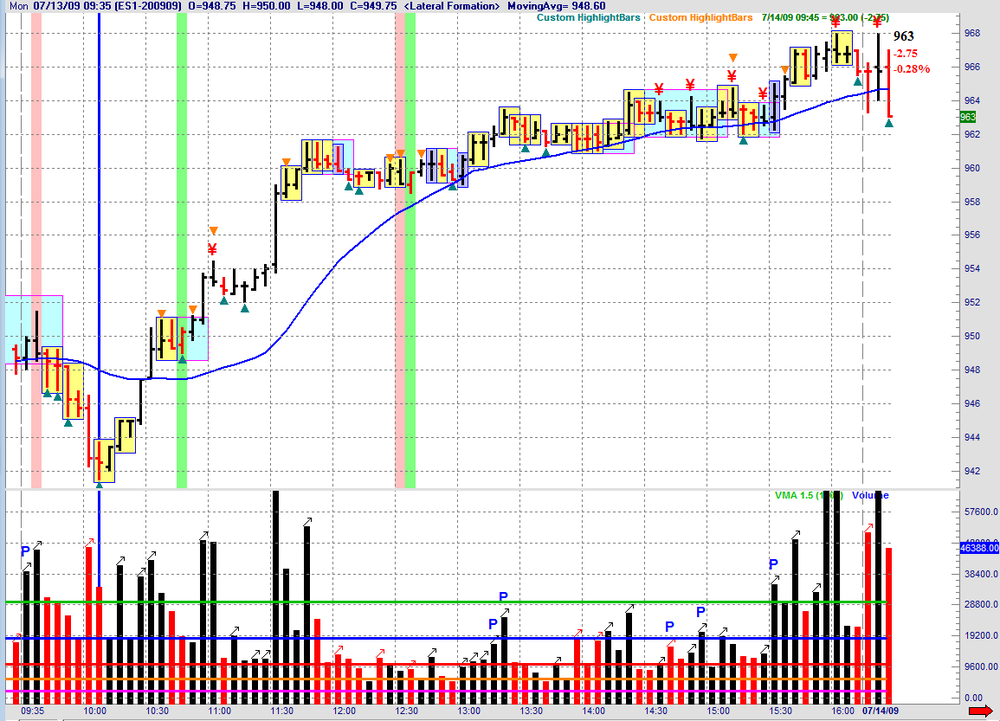
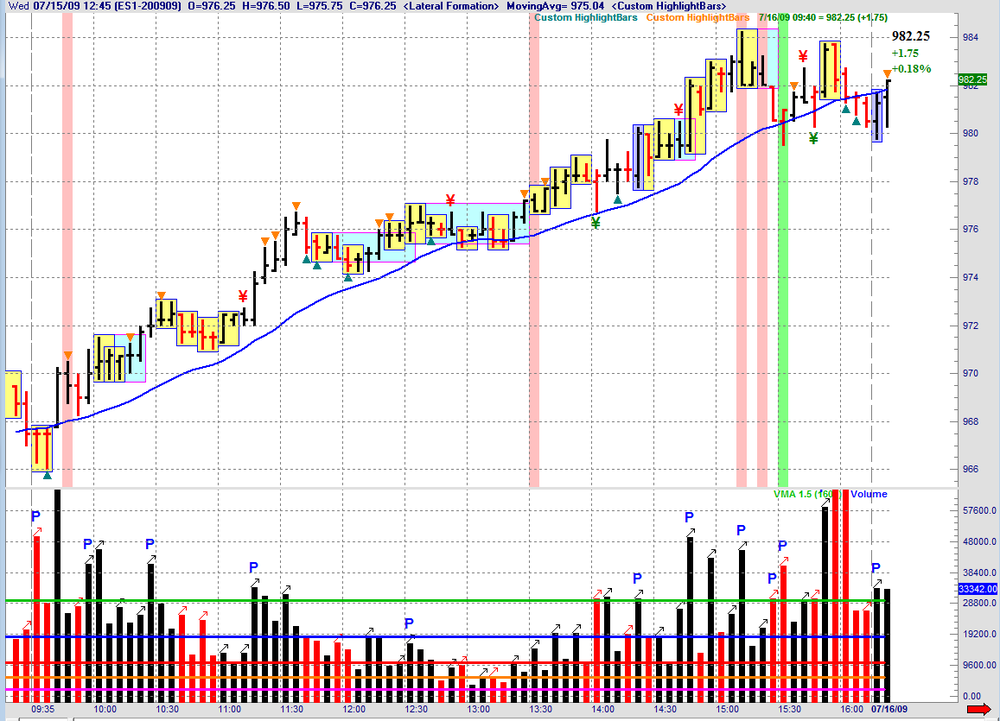
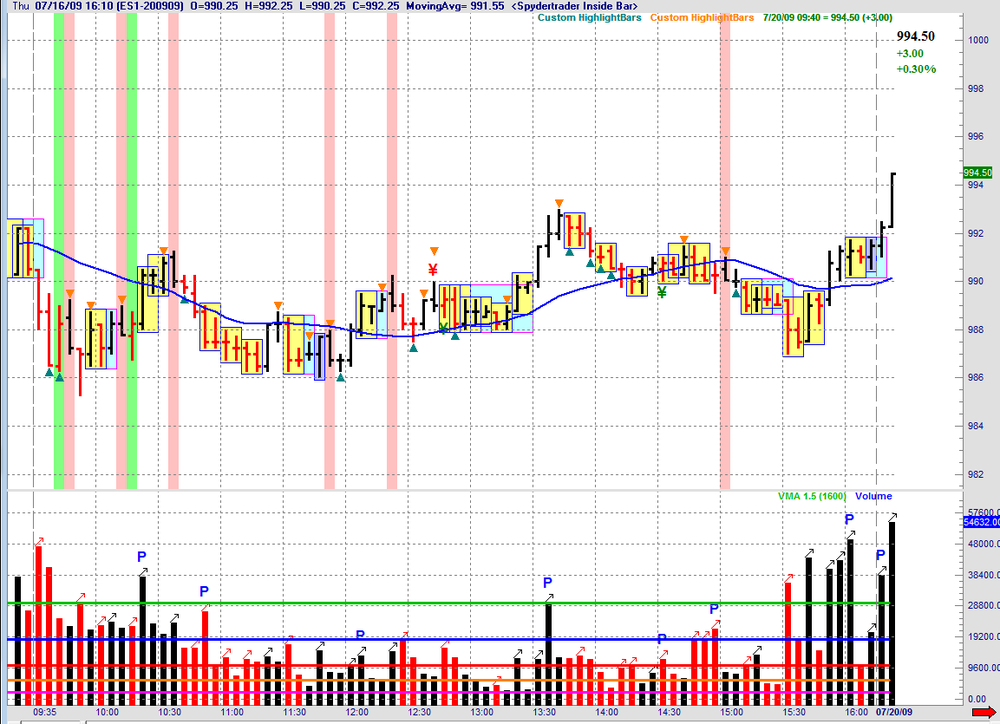
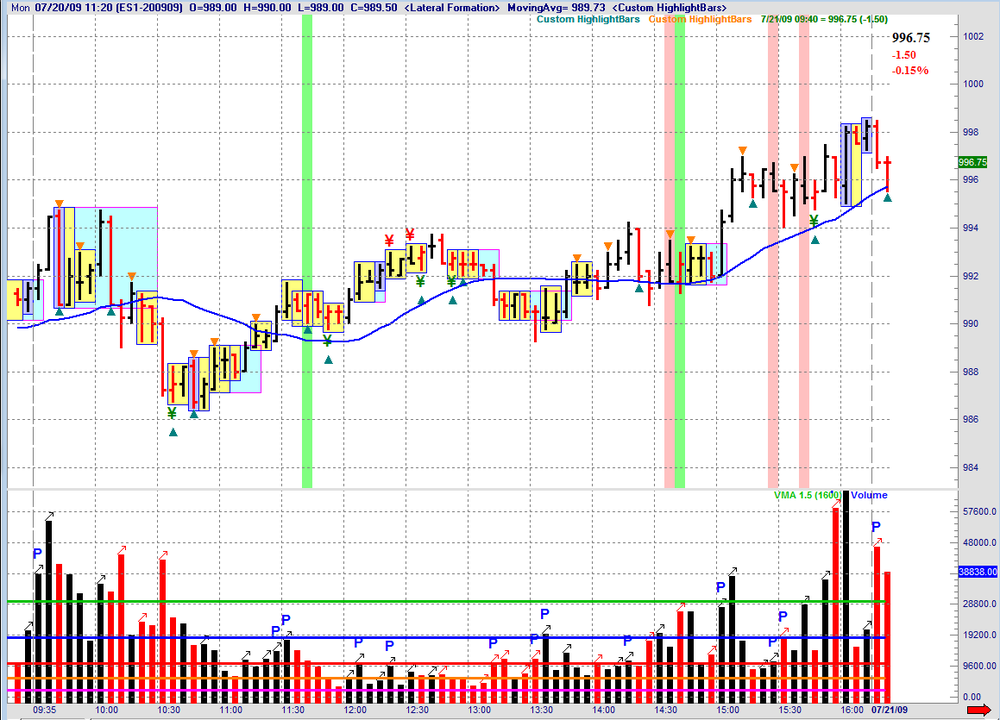
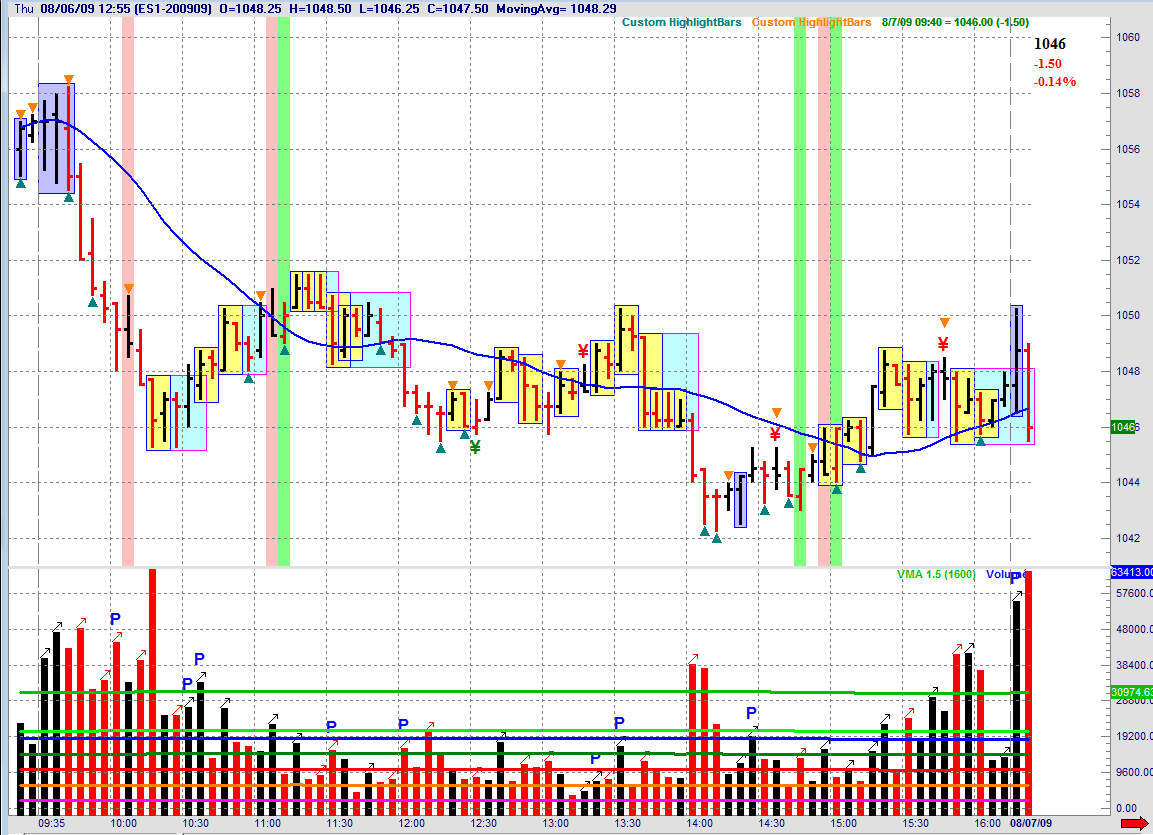
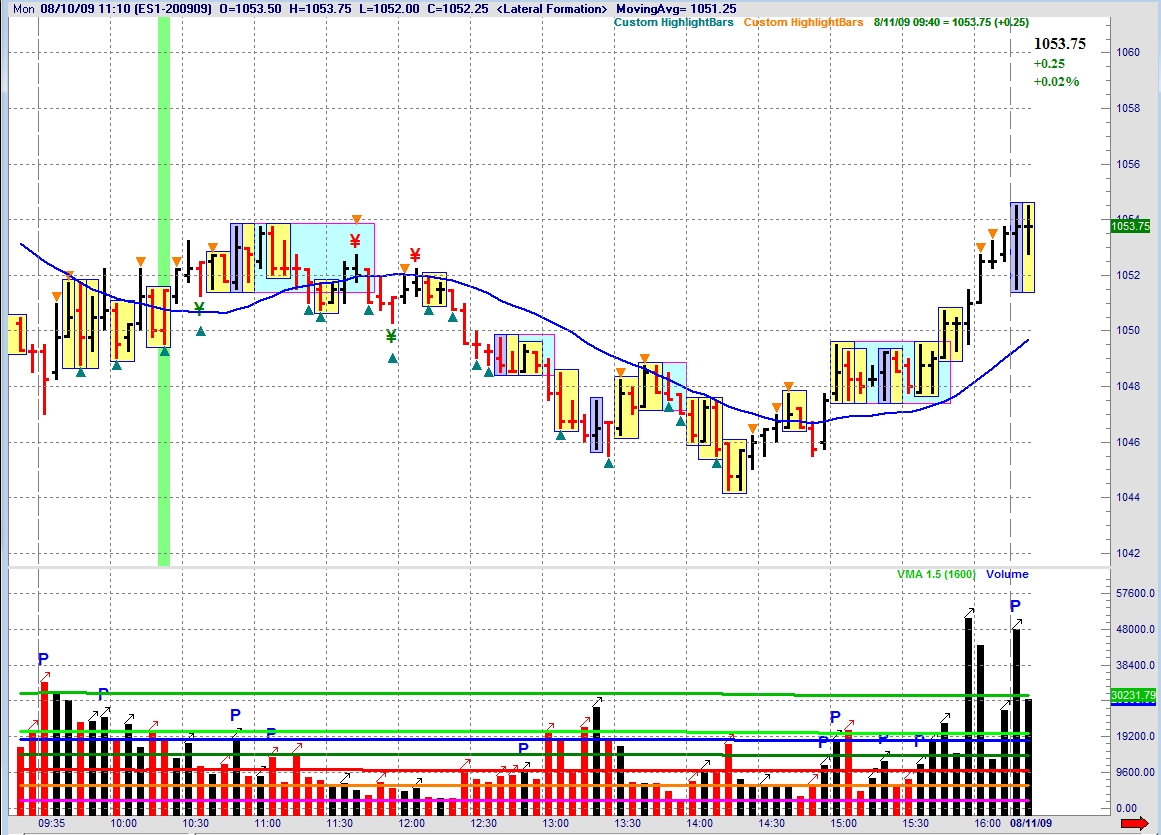
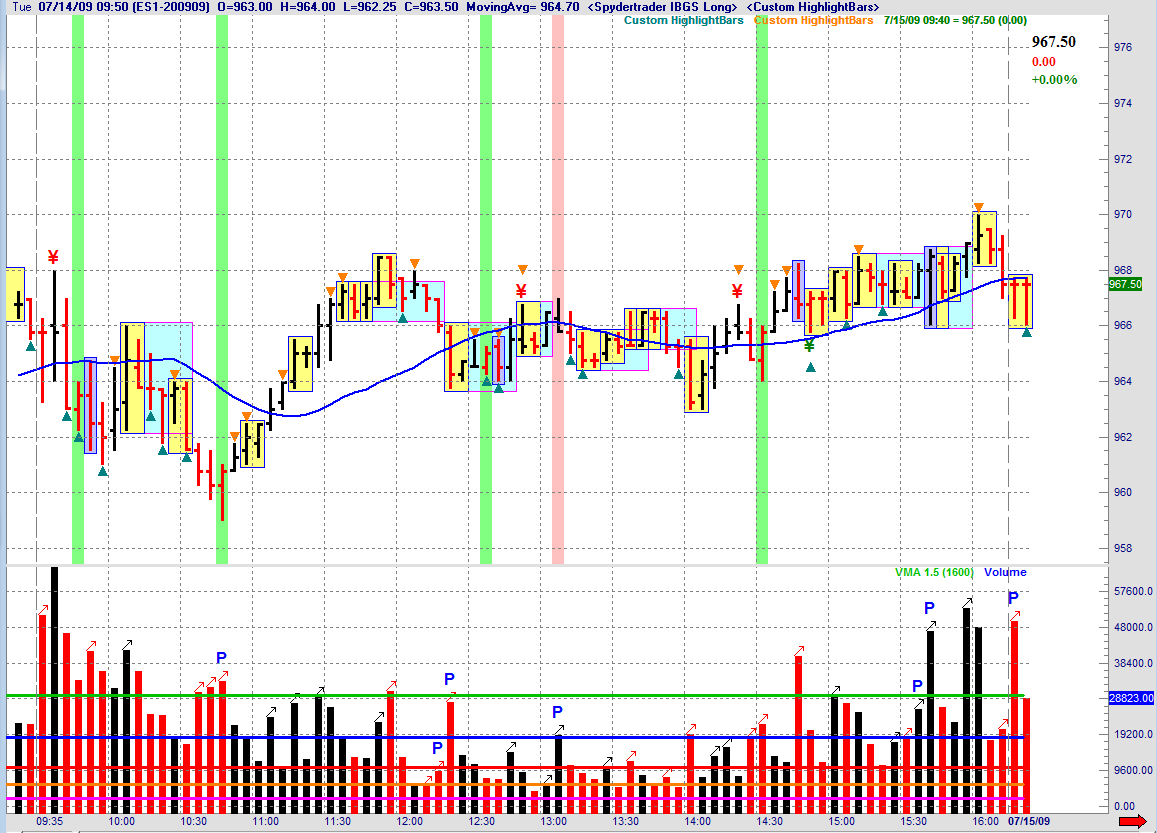
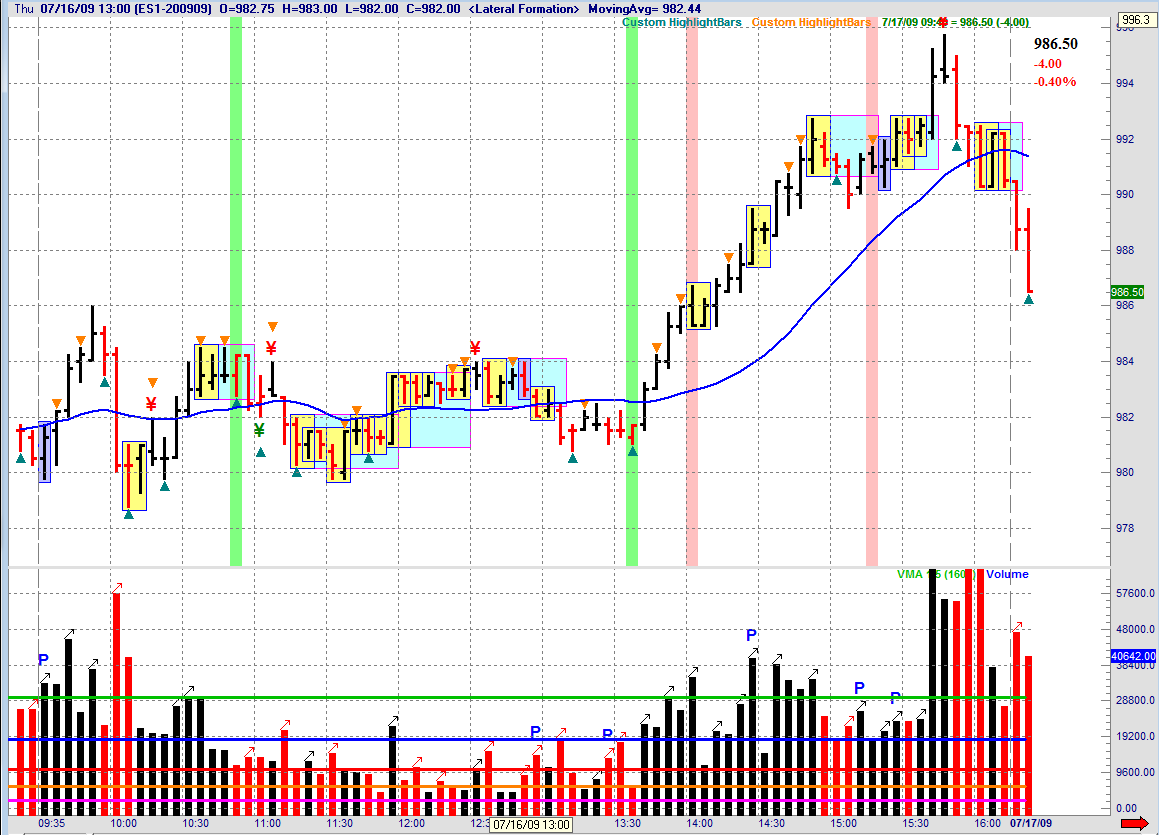
Jbarnby,thank you for that frank reply.You are so correct about the nature of this journey.I think spydertrader had a few reasons for posting this channel drill.One is the huge difference in the amount of days it takes the market to complete "the exact same event" and the hope this would be a wake up call for those learning this method.I believe these "events" spydertrader is referring to are channel fractals.The first event (beginning with 10:10 AM on 7-13-2009 and continuing through until 15:30 PM on 8-5-2009) i think is an up channel fractal event.The second event(15:30 PM Bar on 8-5-2009, move forward until 13:30 PM on 8-11-2009) a down channel fractal.Could it be said that "It doesn't appear you need my help at all" ? Tia
-
1-10-13 with volume included for comparison.hth
-
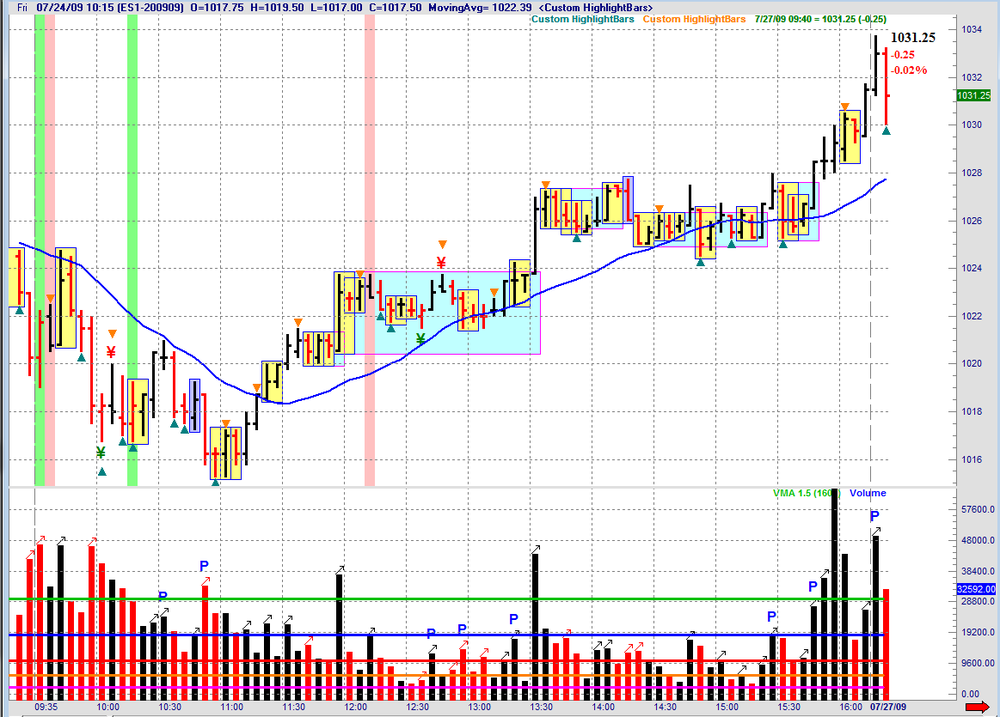
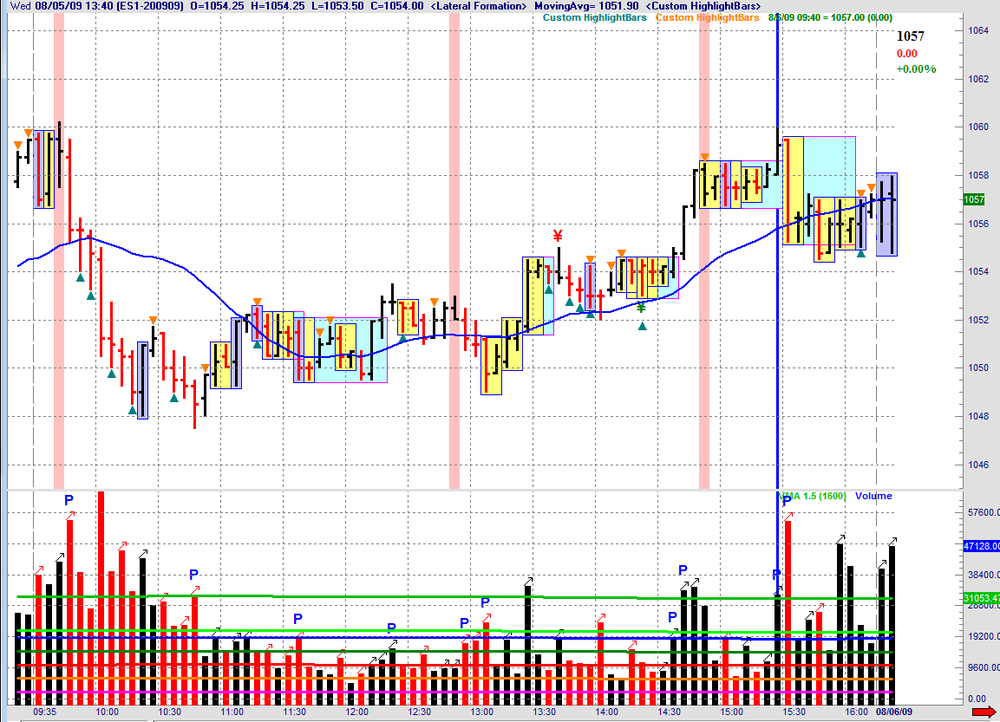
Second known entity charts.Thick dark blue vertical lines are start and finish.hth


-
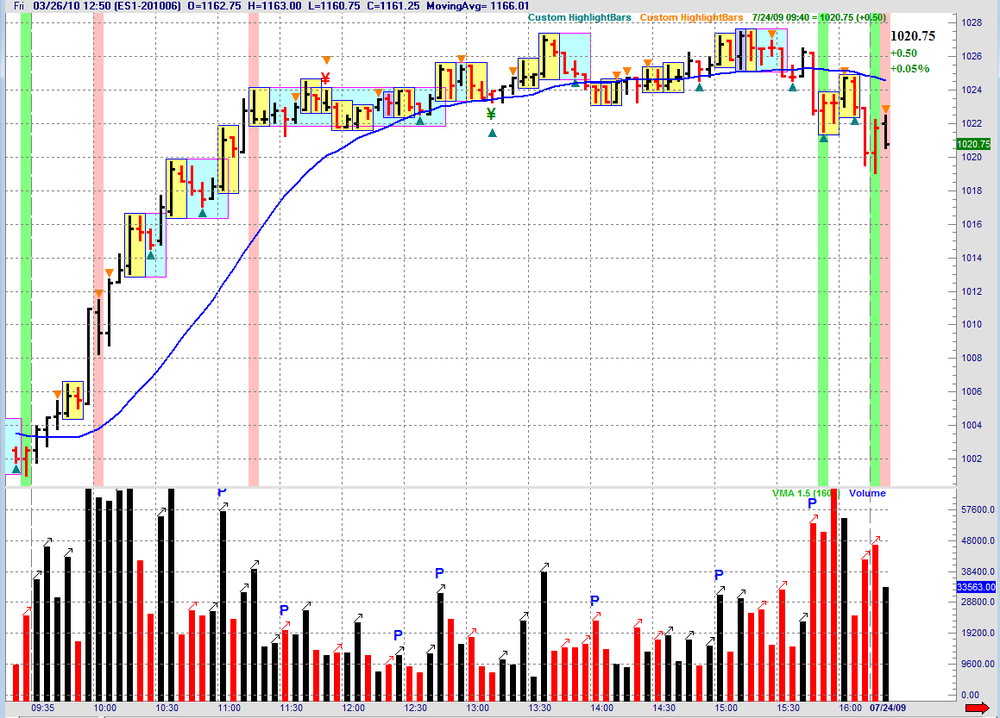
First 18 day known entity.Thick dark blue vertical lines are start and finish.hth


-
Spyder gave us a channel drill.So I am writing to suggest to others; those who may have most of the puzzle pieces but are still missing some critical element....work the channel drill until you find the answers. Once you find the solutions the charts will become crystal clear almost overnight. http://www.traderslaboratory.com/forums/technical-analysis/6320-price-volume-relationship-93.html#post76623John
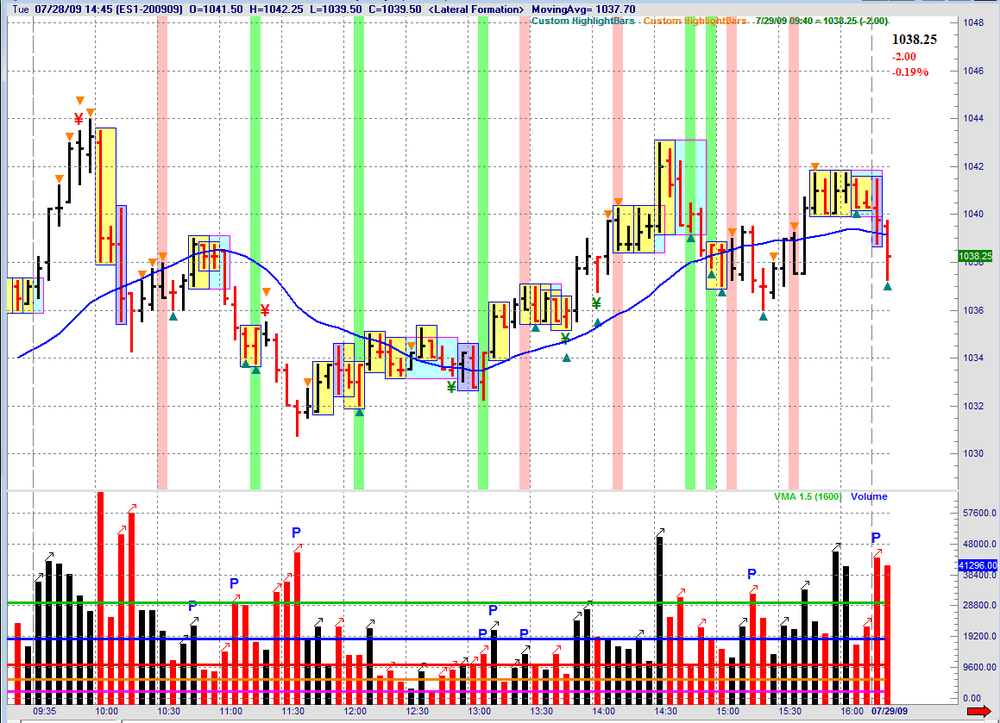
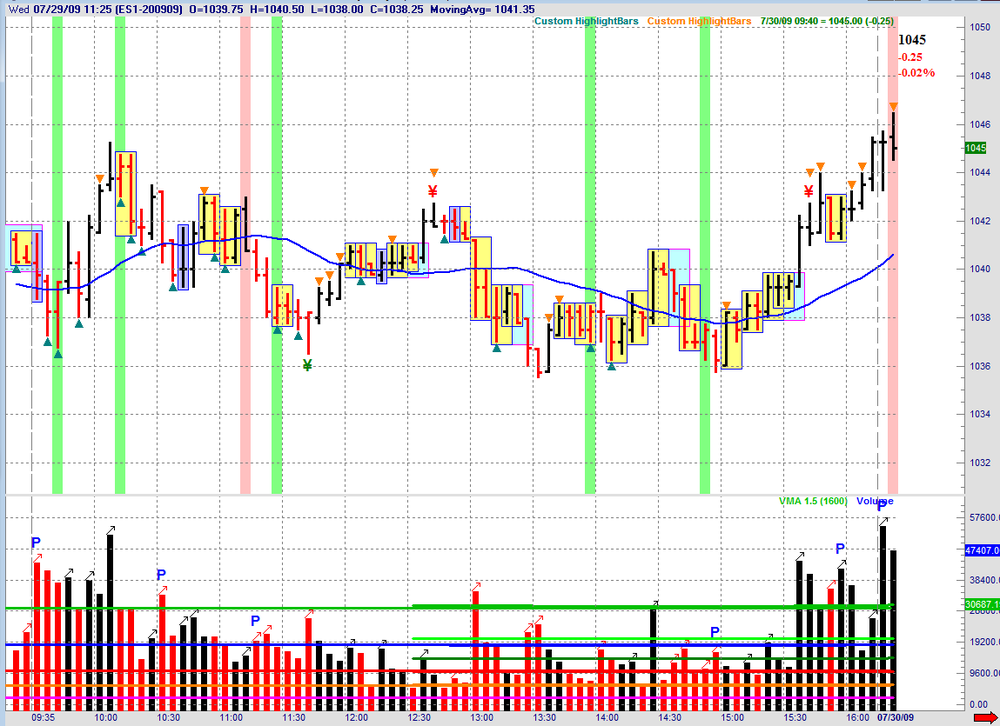
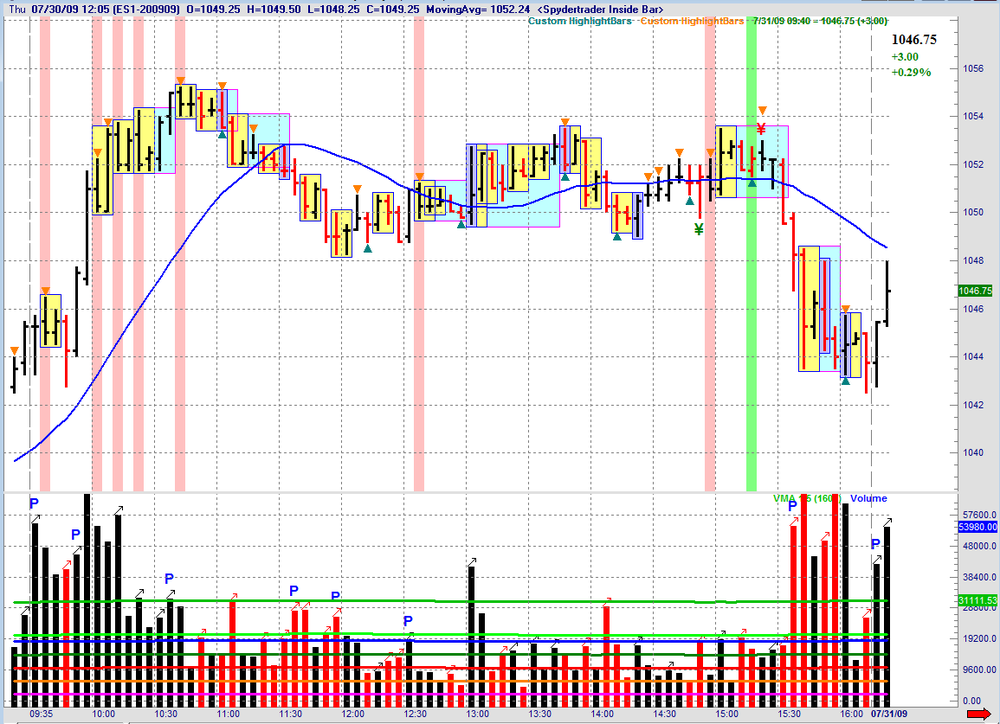
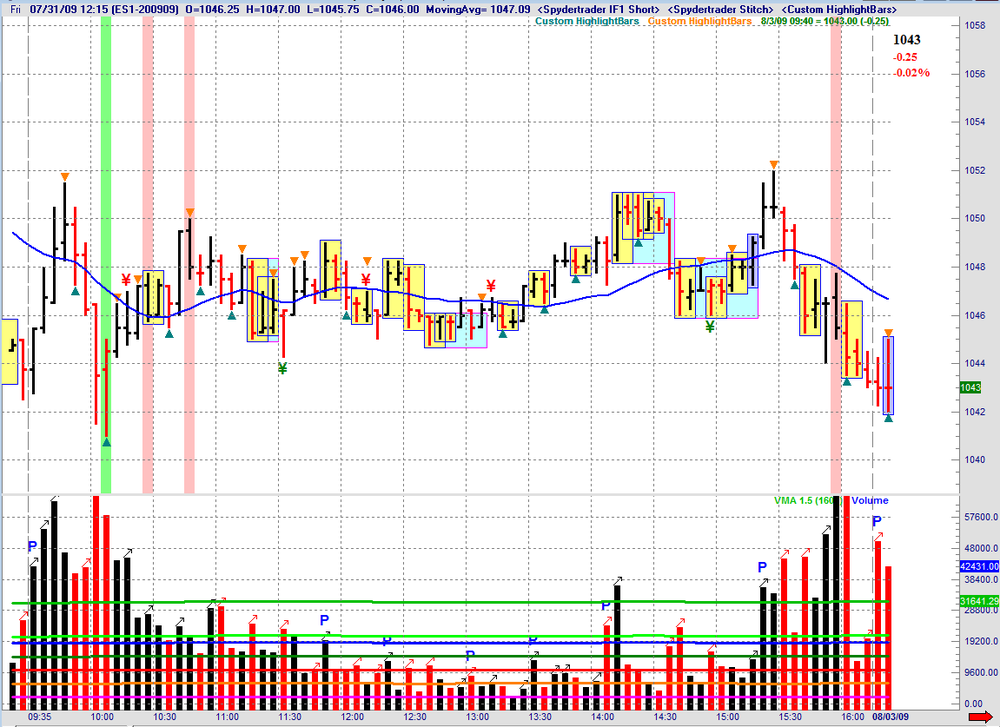
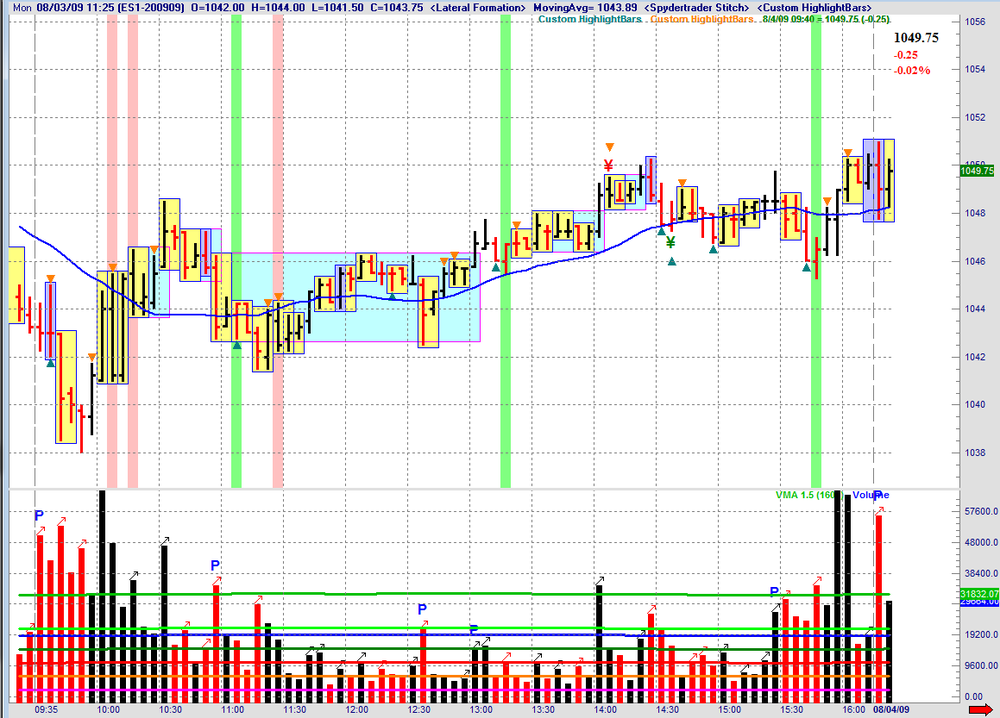
A trader can easily learn to differentiate the various tapes, traverses and channels formed by the market, as well as the sequences of Price and Volume which landmark these specific events, by starting with a known entity - one which exhibits certainty as defined by the market itself. Beginning with 10:10 AM on 7-13-2009, and continuing through until 15:30 PM on 8-5-2009 the market has provided just such an event. In addition, beginning with the very same 15:30 PM Bar on 8-5-2009, move forward until 13:30 PM on 8-11-2009 in order to see the exact same event, but in the opposite direction.This Channel Drill requires the trader to construct their charts in such a fashion that one knows with 100% certainty the end has arrived for both entities described above. Whatever solution works for one part of a chart, must work for all charts in the time frames mentioned.
- Spydertrader
Click link, scroll down to "slow download" for the free download.First known entity lasts for 18 days.Second known entity for 4 days.Hmm.Thought i would repost this information for anyone who missed them and encourage discussion as we work thru this daunting task.hth
-
Jbarnby, thanks for your comments and posts.In the attached chart from post #3708 the 12:05 est bar (see lite blue arrow pointing to this bar) appears to be the lateral formation kill bar.Two bars out of lateral formation does kill a lateral formation but the exception is when the second bar out forms a flaw (internal formation).I believe that is a fbp(internal formation) but i did notice the second bar is increasing black volume.Hmm.Could you enlighten me as to what killed that lateral formation and am i reading that correct that the lateral formation was killed on that bar.Tia

-
This is what I have for 8th_9th and 10th Jan 2013.Done in real time.
If anyone can care to comment on if I am wrong (and if so where and why ?)
or correct, I'd be grateful.
Thx
PS 2nd chart is a better view of today 10th.
Filtertip i may be wrong but compared to my charts looks like your missing the first hour of 5m bars.hth
-
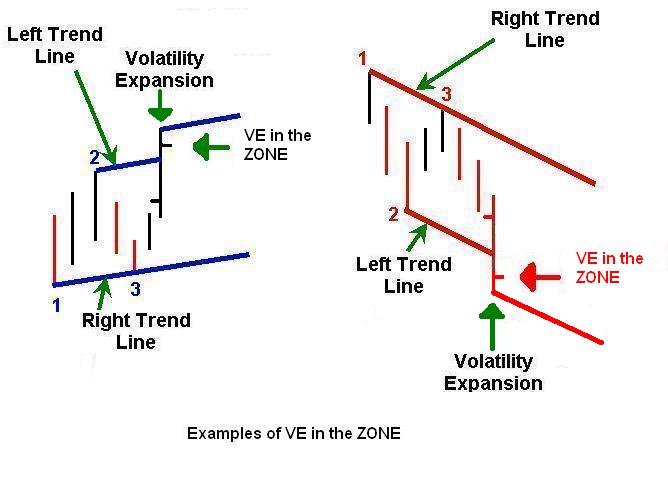
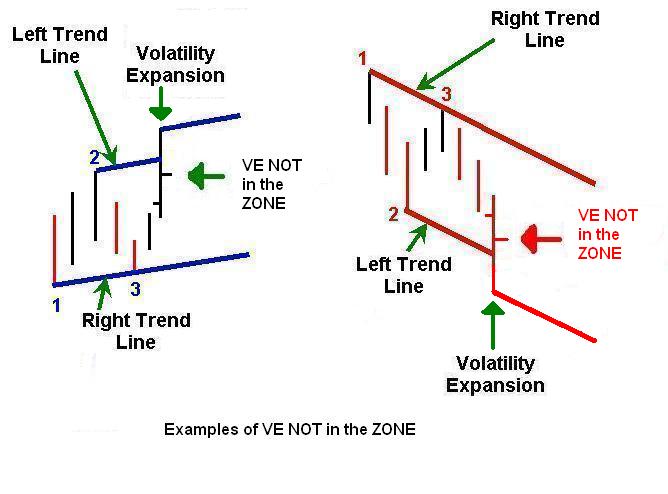
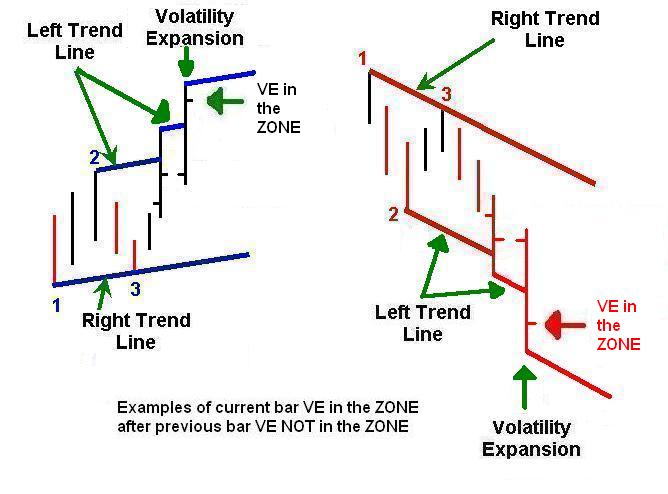
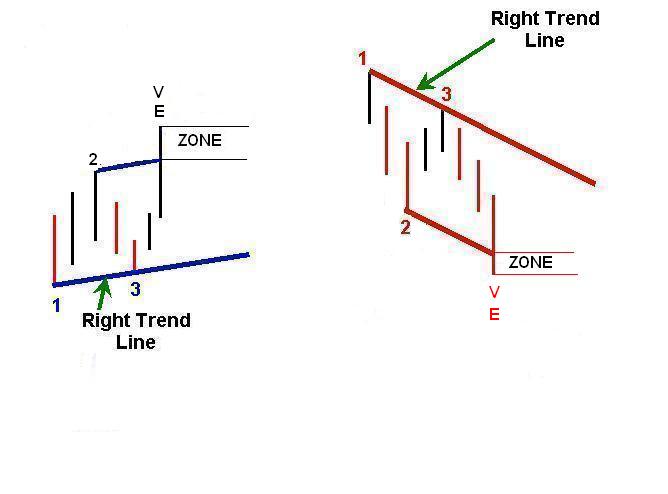
Examples of VE in the Zone,VE NOT in the Zone and current bar VE in the ZONE after previous bar VE NOT in the ZONE.hth
-
VE – Volatility Expansion(see attached) – ‘pushing out’ of the Left Trend Line refinement starts with the "zone" in this case the thicker trendline container's "zone"(see attached).Market needs a close on or beyond the ltl on the v.e. bar at bar close to be in the "zone"(see attached).hth


-
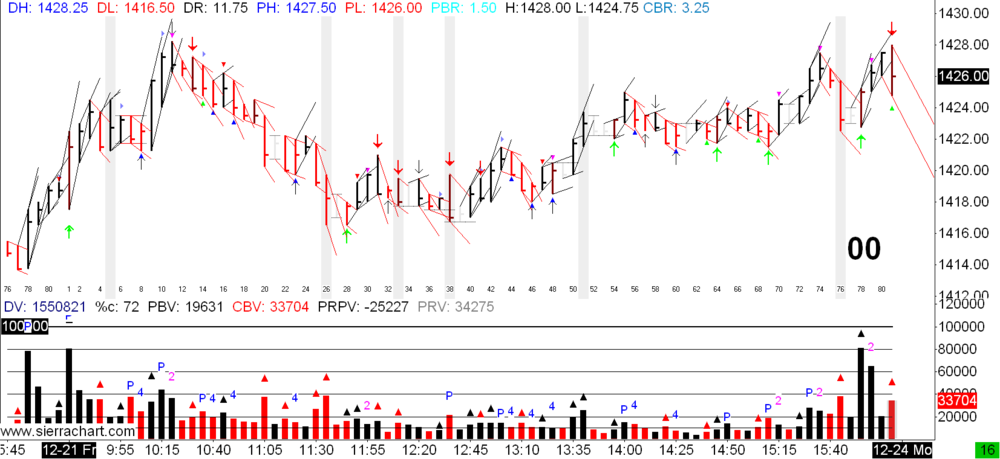
Internal formations with increasing volume on second bar annotated.Ftp's and fbp's are annotated accordingly no matter what the second bar color.Sym's and eh's the annotation varies depending on color of second bar.hth

-
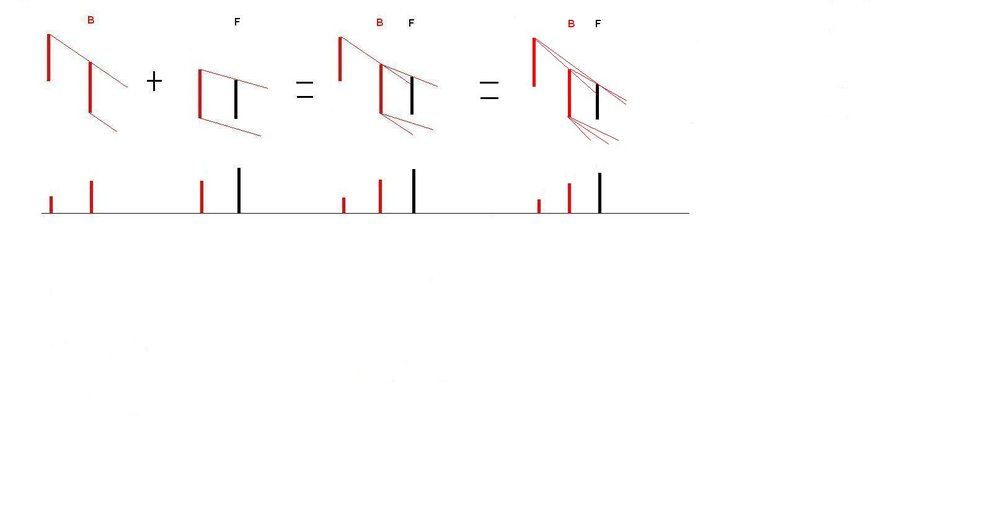
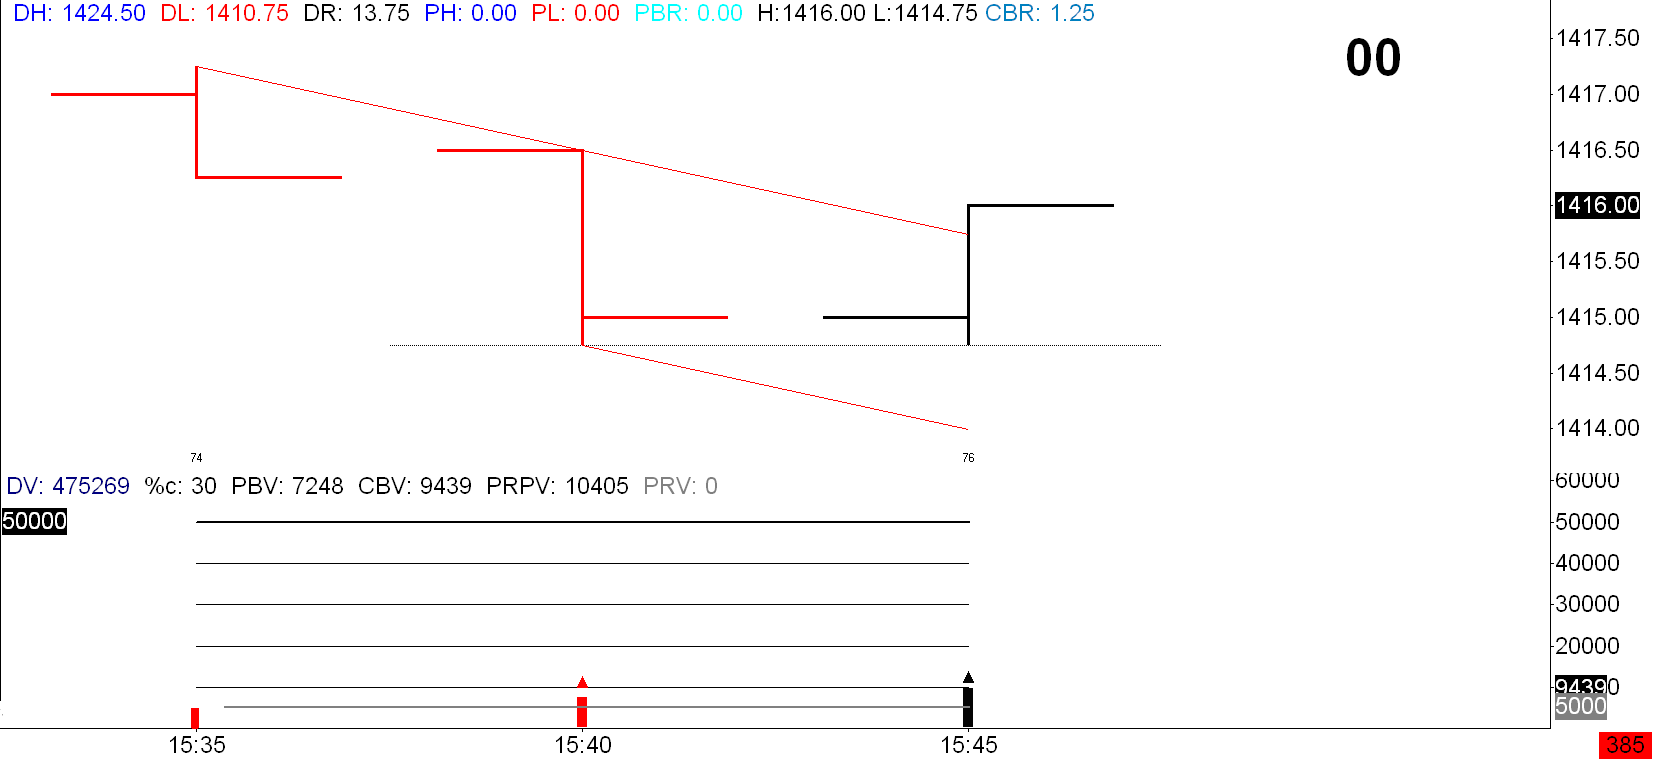
Attached is my annotation for bar 74-76 on 12-26-12 ES.I have broken the three bars down into pieces how i would annotate it.The first 2 bars form a case B which i annotate.Then the last 2 bars form a case F(fbp) which i annotate.Notice how the fbp is annotated with downward sloping trendlines even though the second bar of the fbp is a black bar.This is a purely mechanical annotation simply because its a case F(fbp).The second bar of the case F can be either red or black and the annotation is the same.Next i show the annotations of each case combined.Finally i show a "merged" version of the two cases together.So how does this benefit us to annotate the cases? Can each annotation give us insight into the market's latest movement.How does the annotation of internal formations fit into all this? Notice if you only annotate the case B(see attachment) a trader may misinterpret the close outside the case B's rtl on increasing black volume as a change in trend.If the case F is annotated there is no close outside the rtl because you use the top of the fbp to annotate the rtl.The market would need at least another bar to close outside the case F's rtl.I have found annotating the cases combined with the overall read of the trend to be indispensable.The purpose of posting all the different combinations of cases was in the hope others may find value thru the refinement of annotating the cases.hth

-
The attached picture shows my another opinion.SK0 in post #3668 you stated that "if I know 1st bar is XR,I do not need to consider prior bar (& the annotation). I know sentiment change occurs when 2nd bar is of any type of Inside Bar of Increasing Volume,Black or Red." See the attached three bars from 12-26-12 ES.Bar 74/75 is XR (case B) on Increasing red volume.Bar 75/76 is "Inside bar" (fbp) on Increasing black volume.Market then continued down(see second attachment).Could you please comment on this example?

-
Here is a simple suggestion on how to "see" and practice annotating the 2 bar cases.In your charting platform turn off the open and close of each bar.Instead of using bar graph type OHLC(open,high,low,close) just use HL(high,low).Focus on correctly annotating each case.Notice how the market forms the 2 bar cases using different colors.Annotate the 2 bar cases till you see them in your sleep.Then when you return to OHLC you will still "see" each 2 bar correctly and be able to annotate them.Attached is 12-21-12 HL.hth
-
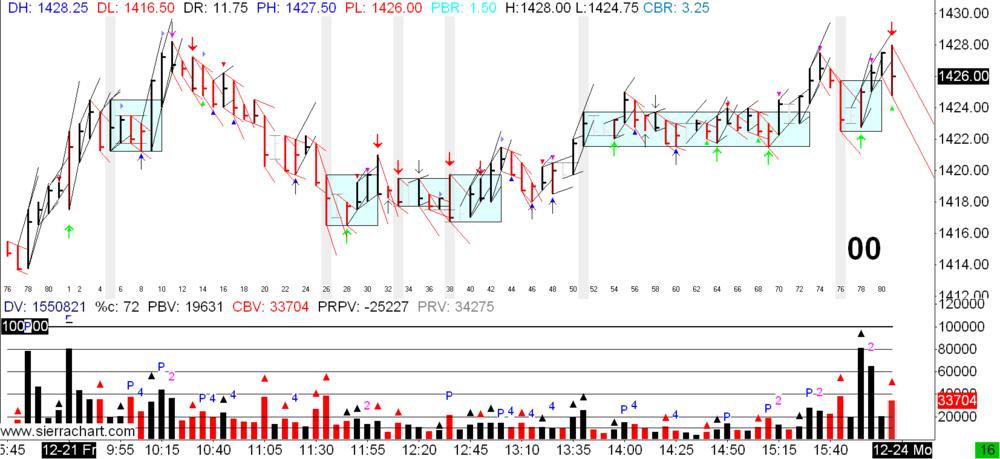
12-21-12 with 2 bar cases(except decreasing volume internals) and lateral formations annotated.
-
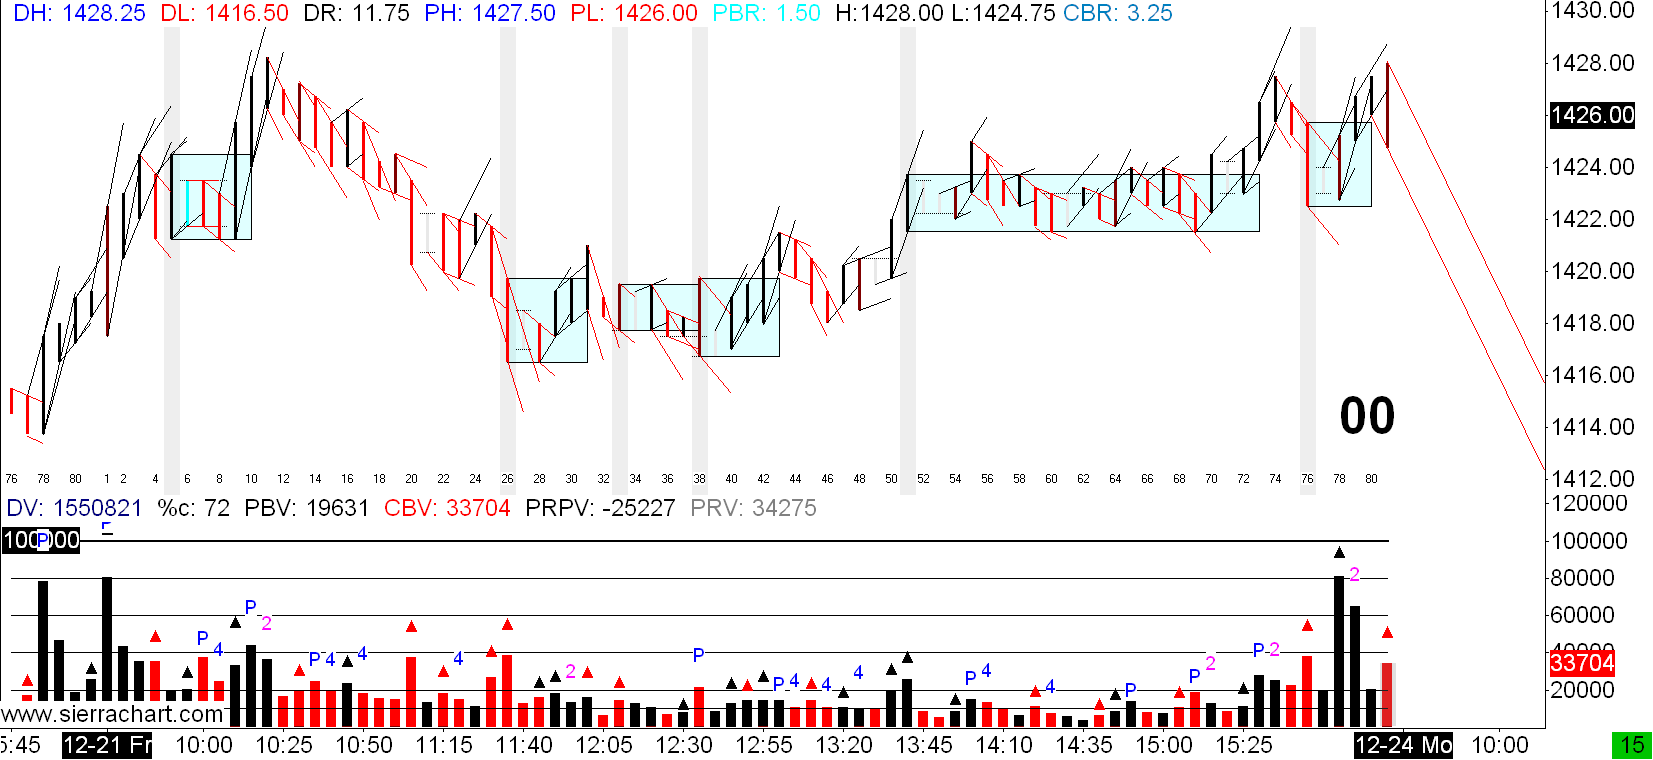
Keeping it simple here is friday 12-21-12 with the two bar cases annotated(except internal formations with decreasing volume on second bar).Ask yourself do you really see each and every 2 bar case no matter what the colors are of the bars? Are you annotating at this basic level correctly? hth
-
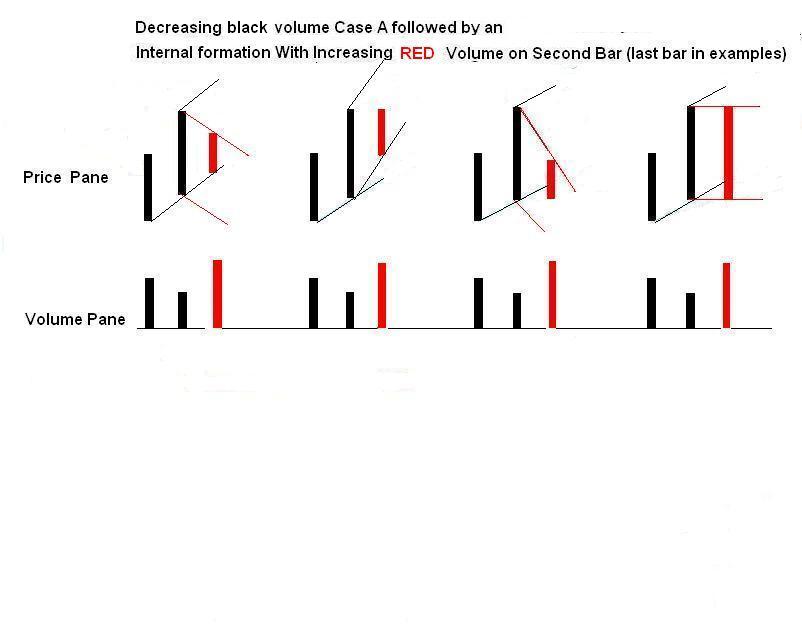
Decreasing black volume Case A followed by an internal formation with Increasing Red volume on second bar (last bar in examples) of internal formation.No fan of the up rtl of the case A due to the fbp's and eh's second bar(last bar in their examples) being red.hth
-
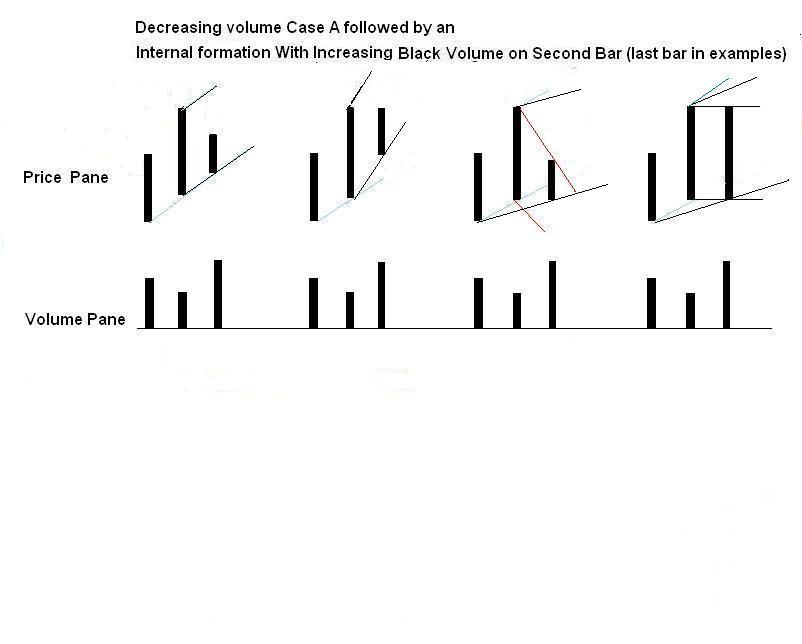
Small addition(third example from the left side) to attachment in post #3673.Needed to fan the up rtl of the case A to bottom of last bar due to the fbp's second bar(last bar in this example) being black.So even though the fbp (internal formation) is annotated in red the overall container is still black.When this occurs i usually will annotate a fbp like this with gray trendlines instead of red to visually tell me the black container is still in play.hth


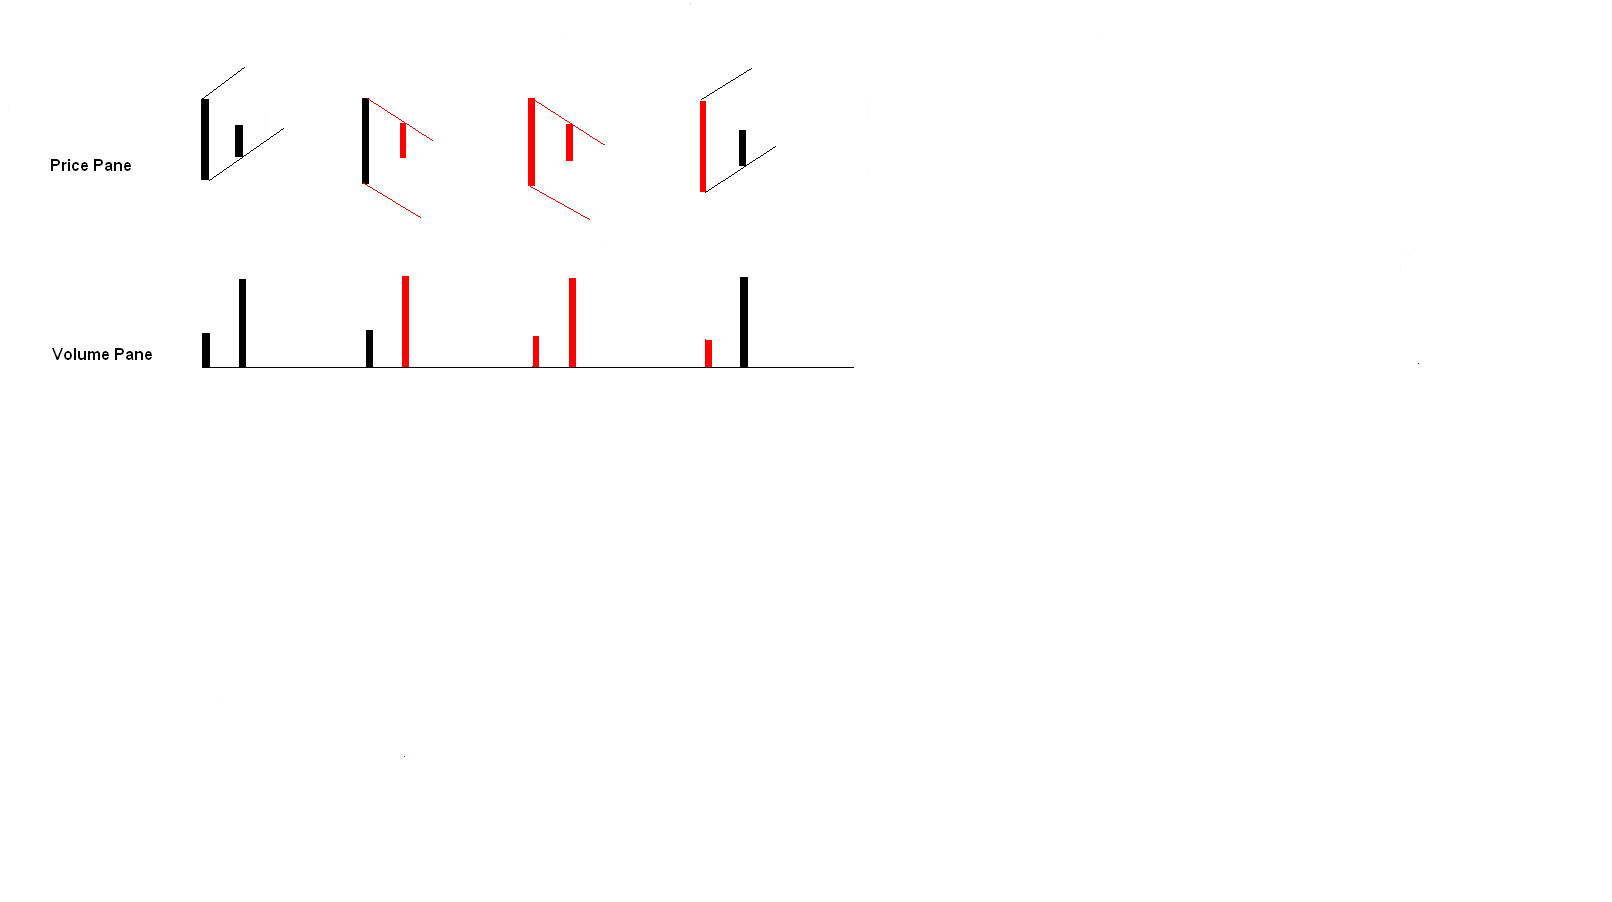


The Price / Volume Relationship
in Technical Analysis
Posted · Edited by patrader
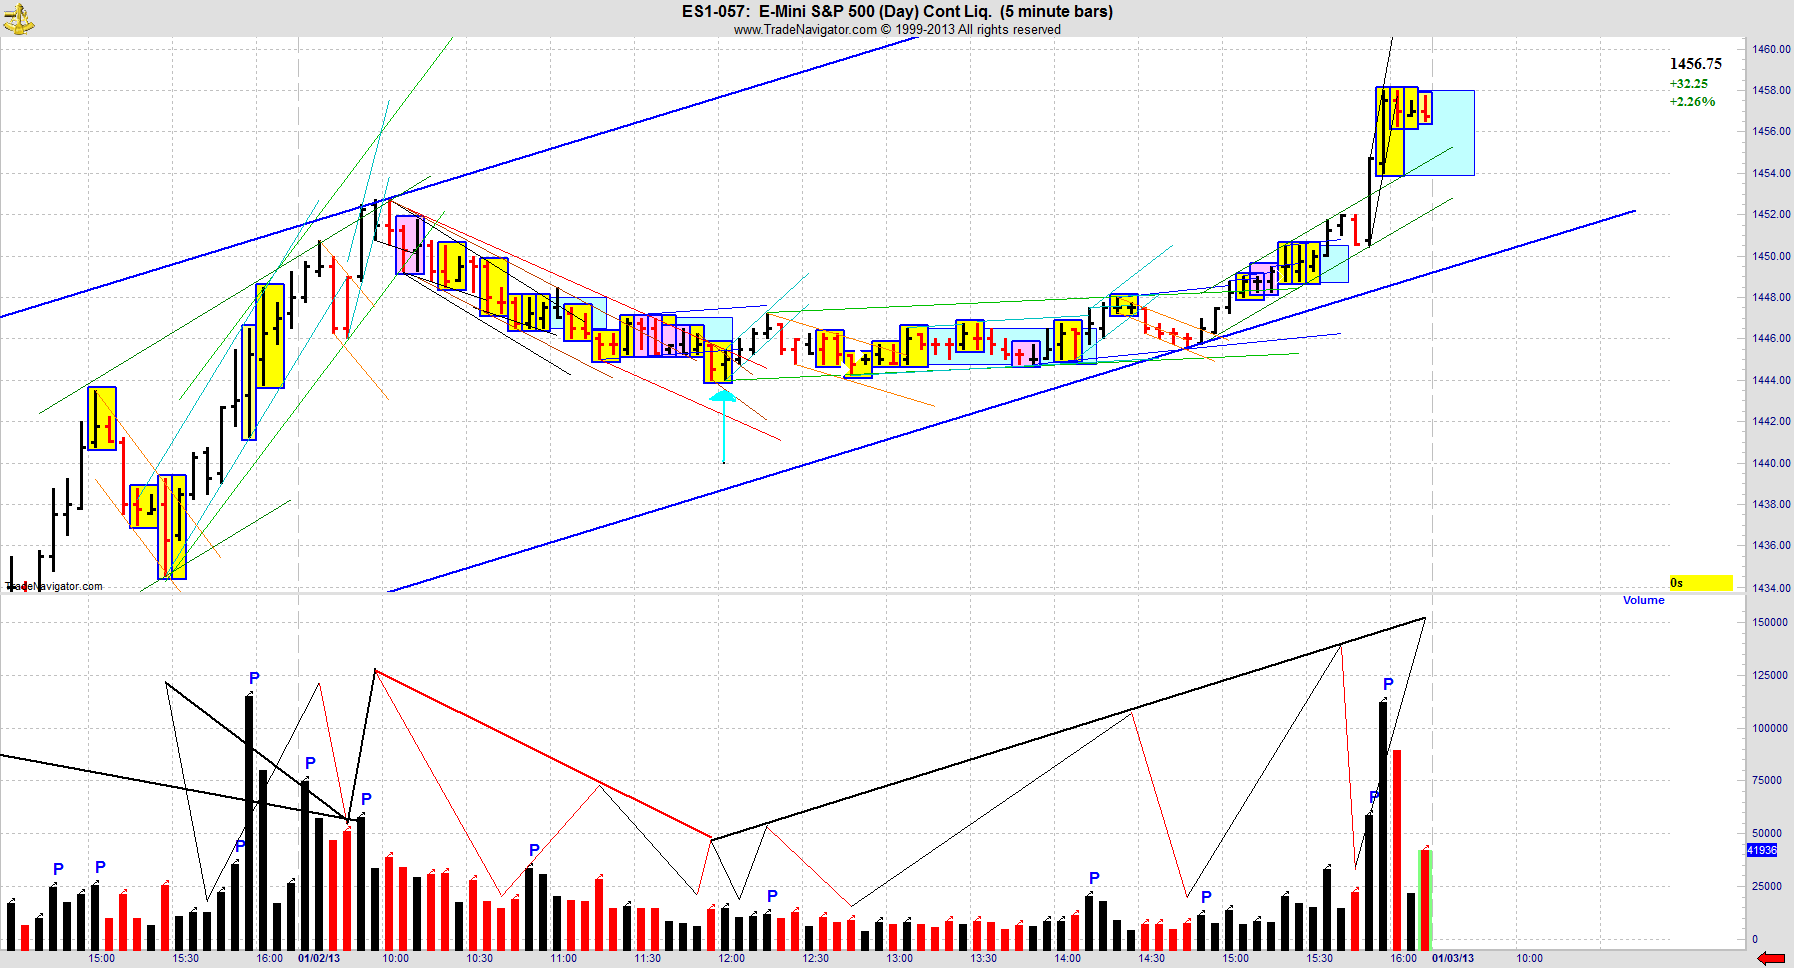
Cleaned up the "example of slow fractal" (see attached).Corrected some of the price and matching volume bars to have correct bar coloration.Added the slightly faster nested gaussians.I believe this is same fractal weighting used by jbarnby's in the 10-3-2012 purple thick down container(traverse).One interesting side note is the placement location of the "trough" of R2R of traverse.There is some comments by spydertrader where the location of the R2R traverse trough may be located starting on http://www.traderslaboratory.com/forums/technical-analysis/6320-price-volume-relationship-271.html post #2167.hth