
Welcome to the new Traders Laboratory! Please bear with us as we finish the migration over the next few days. If you find any issues, want to leave feedback, get in touch with us, or offer suggestions please post to the Support forum here.


saturo
-
Content Count
72 -
Joined
-
Last visited
Posts posted by saturo
-
-
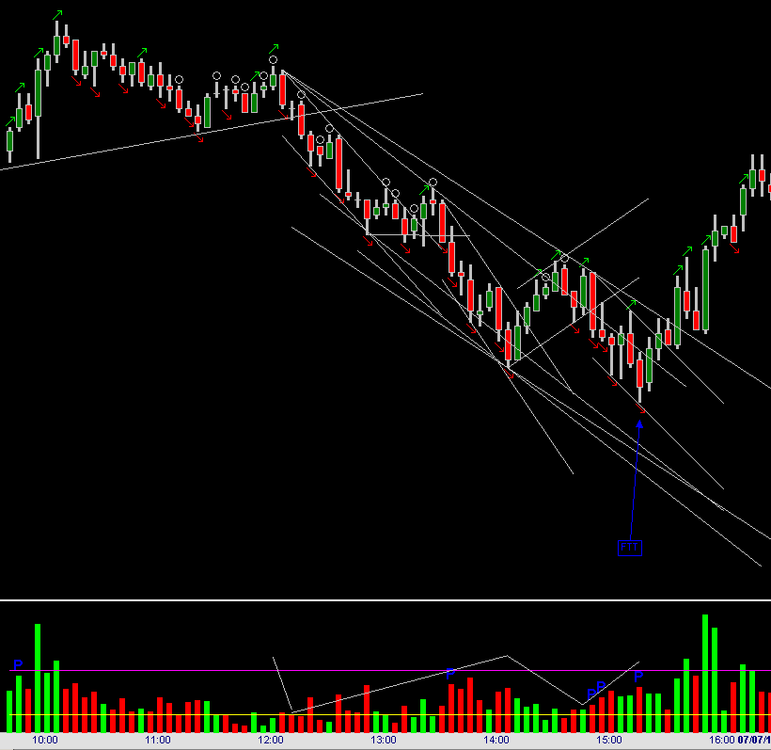
Spyder - could you comment on my attached chart... it's showing a TRAVERSE level R2R2B2R sequence from July 6.
Specifically -
did I draw the volume gaussians correctly?
AND
Is using WWT? logic the only way to reject annotating the 13:00 - 13:30 range as the TRAVERSE level 2B? The logic I applied is something like... "We only see a TAPE level B2B and then price started falling again... so I guess we are still building the R2R portion of the TRAVERSE"
Thank you!
-
I'll take a stab at nesting... and this is just my opinion. Spyder or others slap me if this is way off base.
In dominant runs many times the non-dom component is more or less sideways at completion. In other words the market may have zipped up and down but when the volume sequence says "done" you are not far off from where you started price wise.
In non-dominant runs many times the non-dom (i.e. dominant with the container) component is not sideways.
This causes GREAT confusion because it immediately calls into question your annotation... or leads you to annotate a final 2B or 2R when it is simply part of a faster fractal sequence.
All this applies to gap-removed charts.
-
Link doesn't seem to work... attaching directly

-
If you are into the M3 - the last generation (E46) will give you great bang for your buck -- especially if you are not afraid to get your hands dirty under the hood.
...love this car
-
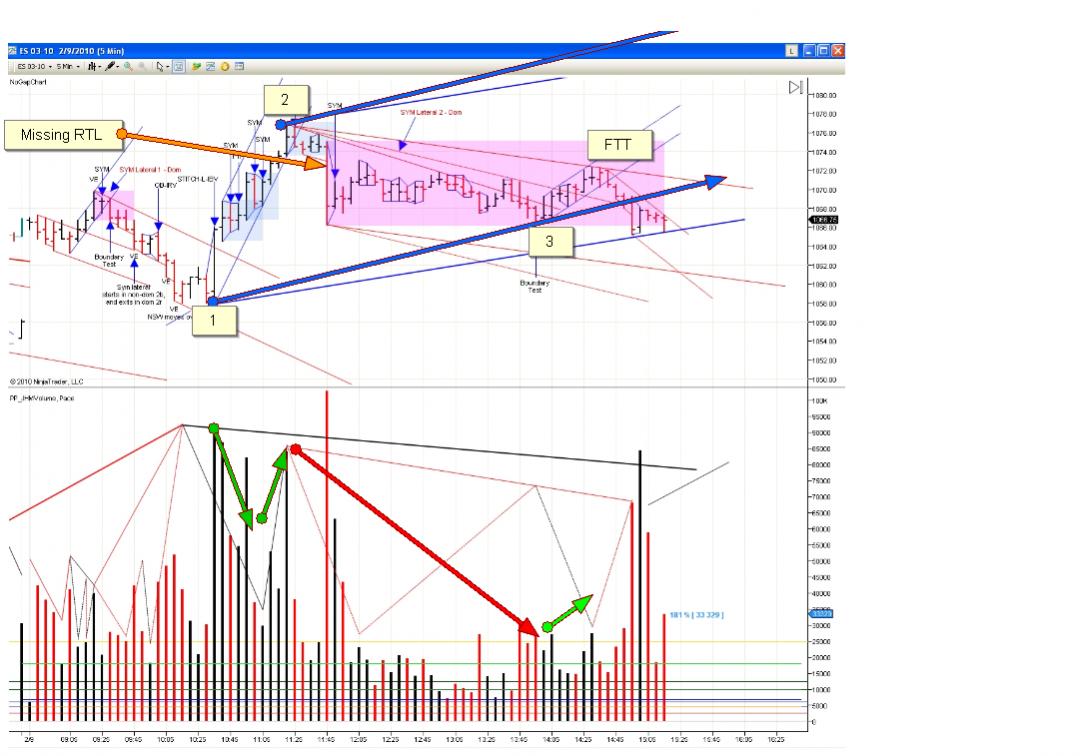
This is a follow up to a question I asked Spyder privately about picking off gaussian transitions. I've written up a "literal" bar by bar gaussian log for that trend that started at 15:30 on 3/9 and ended at 11:05 on 3/10
(all times end of bar eastern)
I've identified a few problem areas - and I'm looking for clarity.
At 16:05 we've seen B2B 2R 2B. OK - no prob!
16:10 - 16:15 looks like falling black - rising red - which doesn't fit into our "mold"
 so I'm not sure what to do with it.
Then we get a rising black followed by a bunch of falling black. Again - not sure how to fit this into our mold. Falling black *always* happens after rising red - is it possible that 16:15 to 10:00 is a down volume sequence? Price is definitely rising over that period so it's hard to "accept" that. There is also no completing 2R.
10:05 - 10:40 looks like 2B 2R 2B - there isn't an initial B to make B2B.
10:45 - 11:05 completely confuses me
15:30 - IBGS - red to black volume shift
15:35 - falling black
15:40 - rising black
15:45 - rising black
15:50 - falling red
15:55 - rising black
16:00 - ???
16:05 - rising black
16:10 - falling black
16:15 - rising red
9:35 - rising black
9:40 - falling black
9:45 - falling black
9:50 - falling black
9:55 - falling red
10:00 - IBGS
10:05 - rising black
10:10 - rising black
10:15 - rising black
10:20 - falling red
10:25 - falling red
10:30 - falling black
10:35 - rising black
10:40 - ???
10:45 - falling red
10:50 - rising red
10:55 - falling black
11:00 - falling red
11:05 - rising black
Comments appreciated
-
Tuesday 9 March 2010Very nicely done rs5.
-
but luckily it started to fall into place.Strike the word luck from your vocab.
Daily volume has been steadily dropping the last few days... basically pace has been heading down below SLOW below before 11 AM and then stays there most of the day.
Slower pace means that the market is going to "spell out" all the faster fractal stuff and that can get confusing.
-
1 day - 3 slightly different variations.
My vote goes to ptunic's version.
-
However, should The U.S. Government choose to commit financial suicide by forcing into law any sort of 'Robin Hood' Tax, rest assurd, a market will exist in some country (with sane leadership) who has chosen not to err on the side of lunacy.We agree.
There is also the concept of jumping through whatever hoops one must jump through to be exempt - like creating a mutual fund. But even that is a non-starter if the volume disappears.
<<back to your regularly scheduled programming>>
-
Those of you making a living from these methods - any thoughts on how you will modify your methods if any of the ironically named FTTs (financial transaction tax) become law?
S. 2927: Wall Street Fair Share Act (GovTrack.us)
H.R. 1068: Let Wall Street Pay for Wall Street's Bailout Act of 2009 (GovTrack.us)
-
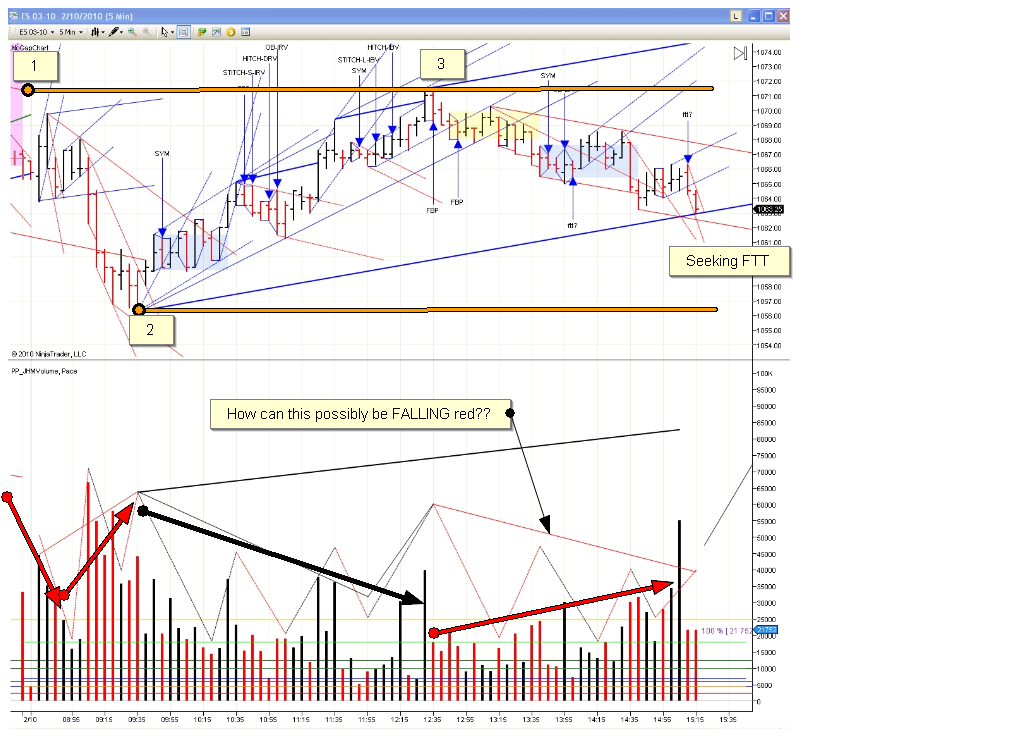
Wednesday 10 Feb 2010rs5 - I marked your chart with an alternate view of the day.
Can you explain why you have 12:35 until end of day marked as falling red? On the whole the volume trend over that period appears to be rising -- especially the red bars. Maybe I'm missing some key concept to gaussian annotations.


-
What about this sequence?I'm assuming your interpretation is that the yellow shaded portion of your drawing is action going from pt2 to pt3 of the "higher level" move from pt2 to pt3.
As I see it - the volume trend of your "red arrow" trend is rising. Doesn't this disqualify that particular read of the situation?
-
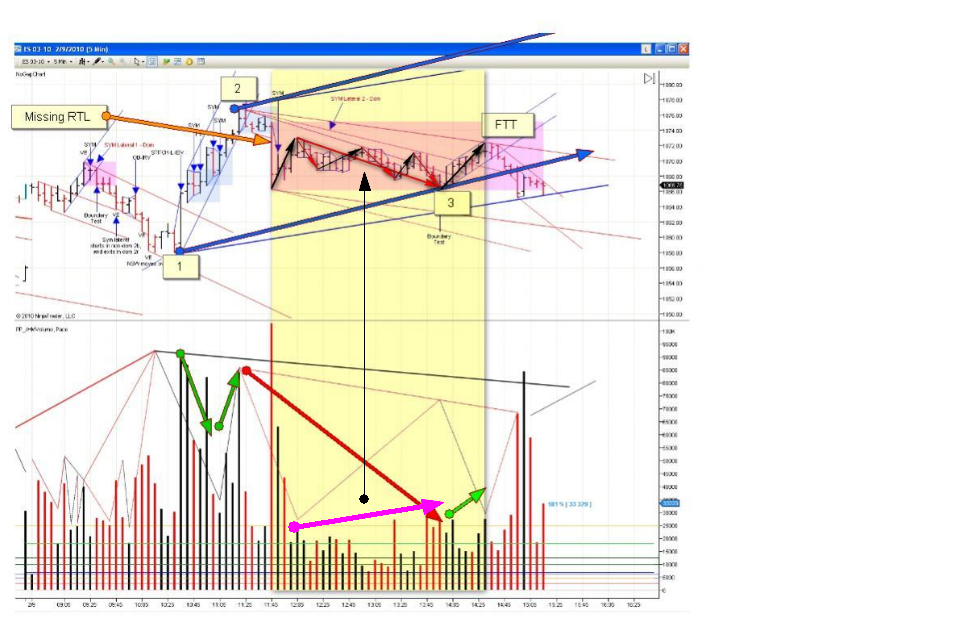
rs5 - I see today a little bit differently. I marked up your chart.
I believe that the volume sequences have all been satisfied for the long. I believe the key area is 12:45 - 13:55 - you have it marked as rising red. To me this appears to be falling black.
What is your rationale for annotating volume that way?
Comments welcome by all...
P.S. the "missing RTL" note is not pointing at anything... you are missing a CO channel from 2/8 (gap adjusted)

-
Spyder - a basic question about the volume sequence that might benefit others as well:
Can volume sequences overlap? By this I mean can the 2R or 2B of a trend also play a "double" role by being part of the ensuing trend?
For example - this would mean that a 2R of an up trend is also "counted" as part of the R2R of the ensuing short.
If my question is unclear I will try to clarify with a picture.
-
Regarding the mystery r2r on 1/25... a few things to keep in mind:
1) Trends overlap
2) The farther "down the rabbit hole" you go - it becomes more and more likely that you will not clearly see all volume sequence components neatly on their own bar or bars on the 5 minute chart.
For example take a look at 13:30 on the same day... there is a r2r that begins off of the peak there - but this information gets a bit lost on the 5 minute chart. The 2b 2r are much clearer. They overlap with the next trend.
I've always thought of this problem as a quantization problem... like sampling music. The 5 minute quantization boundaries are not always going to land on the "best spots" to give you a crystal clear picture.
-
Thursday 21 January 2010rs5 - IMO a declining volume long channel started at 11:45 and ended at 14:35... the rest of the day is R2R on the channel fractal. (channel = your medium gaussian lines)
...at least that's how I see it.
-
To inject some life into the lateral formation drill discussion...
My hypothesis is that the laterals in questions have two characteristics that separate them from other laterals:
1) they begin with a SYM pennant
2) they all form as a R2R or B2B completes (aka pt2) for some fractal level
-
Spyder - without giving too much away... I have a question about two of the lateral drill laterals. On 1/6/10 ...
1) is the 12:15 lateral part of a trend that begins at 11:40 and ends at 14:00 ?
2) is the 14:40 lateral part of a trend that begins at 14:00 and ends at 15:40 ?
-
Spyder - without giving too much away... I have a question about two of the lateral drill laterals. On 1/6/10 ...
1) is the 12:15 lateral part of a trend that begins at 11:40 and ends at 14:00 ?
2) is the 14:40 lateral part of a trend that begins at 14:00 and ends at 15:40 ?
-
romanus - so perhaps a way of looking at the process is:
1) know you have a lateral and not a formation
2) know your context
3) know what comes next
-
I have a philosophical questions about laterals... about what is knowable and what isn't.
Lats are created by 3 bars. Bar 1 has a directional aspect. (Further - that direction is either dom or non-dom.)
Now ...the lateral will eventually and ALWAYS have a BO and that BO will either be the same or the opposite of bar 1's direction.
My question is this: is the BO direction ALWAYS knowable as soon as price tells us we have a lat? Or perhaps this is a CERTAIN POINT situation where we only know FOR SURE at a certain point during the formation of the lat?


The Price / Volume Relationship
in Technical Analysis
Posted
I'm trying to analyze the daily ES chart. Could someone help me out and explain which one of these possible choices is in effect - and WHY???
the LOW of today (7/20) is:
- a pt3 of a long (pt1 on 7/6)
- a pt2 of a short( pt1 on 7/15)
OR
- a pt1 of a new long (also FTT of a short)