
Welcome to the new Traders Laboratory! Please bear with us as we finish the migration over the next few days. If you find any issues, want to leave feedback, get in touch with us, or offer suggestions please post to the Support forum here.


saturo
-
Content Count
72 -
Joined
-
Last visited
Posts posted by saturo
-
-
It was expected that last 2B (i.e. bar 5 to bar 7) should be increasing black volume, but what must come next (increasing black volume) did not materialize. Is it the idea of WWT?
The volume sequence ALWAYS complete. The problem is that it is not always glaringly obvious on the chart... you have to do some deductive logic. The other problem is that they nest so you have to keep track of what has to unfold to complete things... as pace slows it gets more complex.
IMO the most likely case is that the volume is "embedded" in bar 7. There is a heck of a lot of volume in that bar and it wouldn't take a lot to overtake the volume of the prior bar (especially if you think in terms of volume acceleration).
Because bars 6 & 7 create a down stitch (refer to the 10 cases) the volume could be hiding in that little upper right "corner" above the close of bar 6. A stitch is just a variant of an OB where price is stunted in one of the 2 directions.
-
I guess he wanted to emphasize the B2B leading to the accelerated green pt2 (the spike bar). How would you annotate that area?In the light of knowing what comes after...... the annotation makes sense to me as it stands. What I don't exactly understand is why you can't draw in a THICK black gaussian over the first 4 bars when you CAN'T see the future.
In that case Bar 5 is falling red approaching RTL... rising red on bar 6 with BO would confirm. Chart shows us that this is not the case... it's a MEDIUM thing.
Where is the clue that we are dealing with a medium gaussian in this context and not a thick thing PRIOR TO bar 6 arriving? This is not a rhetorical question - I've been pounding my head against that snippet for a long time :crap:
-
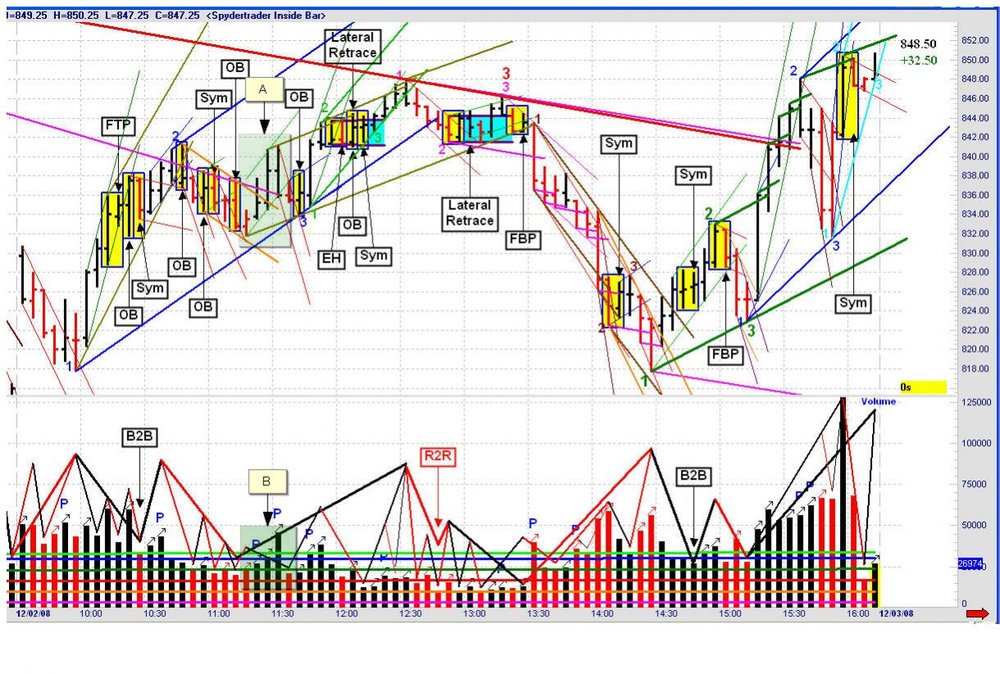
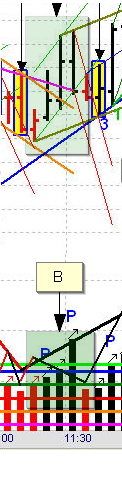
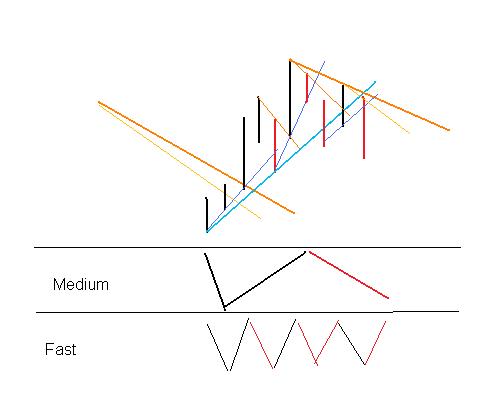
I have a question about this Spyder chart (I believe it was the last full chart he posted in the IR thread).
I have highlighted an area on volume and corresponding area on price. Here is how *I* see it:
- Spyder has drawn a medium falling black gaussian over 5 bars.
- IMO price is going up for the first 3 bars and going down on the last 2.
- I assume that there is an unannotated skinny B2B 2R over those 5 bars.
My question is - why were the first 3 bars NOT annotated as a THICK level rising black gaussian with the 4th bar being FTT of the THICK? As it stands it appears that bar 4 is FTT of the unannotated skinny B2B.
-
Enjoy the drill. PAY, PAY, PAAAAAAAAAAAAAAY attention to the tapes and volume ...I'am in a good mood...

I'll take a stab at it...
#1 - faster fractal - full volume sequence - making new pt3 off of a VE
#2 - faster fractal B2B. It is not a traverse level FTT because we still need the rest of the volume sequence.
#3 - traverse level R2R (I don't understand why you threw the 2nd orange line in there?)
#4 - traverse level 2B
-
Find the differences. Enjoy.In the 1st oval the TAPE itself does NOT have a VE but the tape creates a traverse level VE.
In the 2nd oval the TAPE does have a VE and also creates a traverse VE.
-
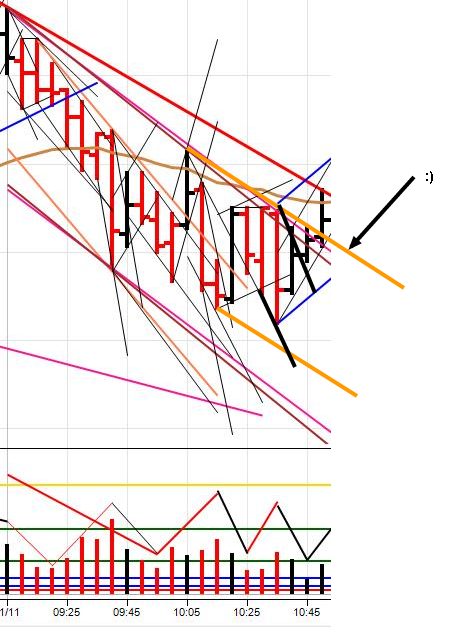
Your orange pair of lines do not represent a channel, but a faster fractal thing (aka faster fractal traverse) which misses the first part of the sequence. The black pair of lines represent even a faster fractal thing (aka tape).My screenshot tool only has one line thickness
... my black lines were meant to be thin and orange lines meant to be medium. Sorry for any confusion. -
This should look familiar.To all those participating in the recent discussion - thanks!! And a special Mit tiefer Dankbarkeit! for gucci.
I drew in a couple of extra channels for emphasis.
-
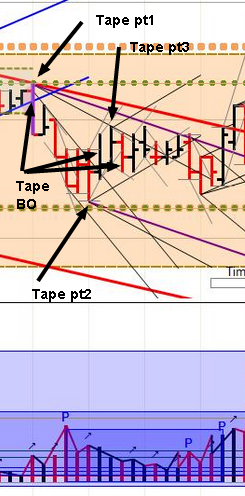
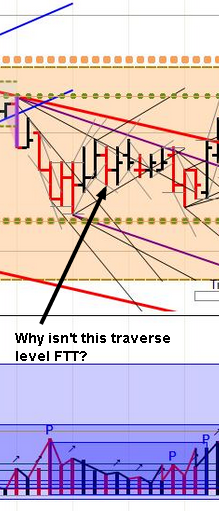
If you're looking for a traverse FTT, then the tapes for that leg must be completed. Where is your tape point 3?See attached...
There are 3 tape level BOs... and what appears to be an FTT. I don't understand why the FTT I marked in my original drawing isn't the traverse level FTT.
Edit: the pt 1, pt 2 and pt3 are for the traverse in the snippet... sorry for the confusion.
-
See question in chart snippet...
-
A quick interpretation.It looks like you are simply using 1 additional faster fractal level instead of 3.
Thick (trend)
Medium (traverse)
Thin (tape)
Dotted (bbt) bbt = "building block of tape"
An alternative way think of it:
Thin goes the minimum volume sequence plus a 2R 2B .. so B2B 2R 2B 2R 2B - this creates an accelerated RTL.
Medium joins on the last thin 2R. Medium's 2R breaks accelerated RTL.
Thick 2B is WMCN.. capping it with an FTT
Edit: Is this correct?
-
Nice chart to review the Gaussians on three fractals.http://www.elitetrader.com/vb/attachment.php?s=&postid=2288546
Enjoy
:idea:
Thanks for posting this gucci! And thanks for all participating in the discussion... it's a good one.
-
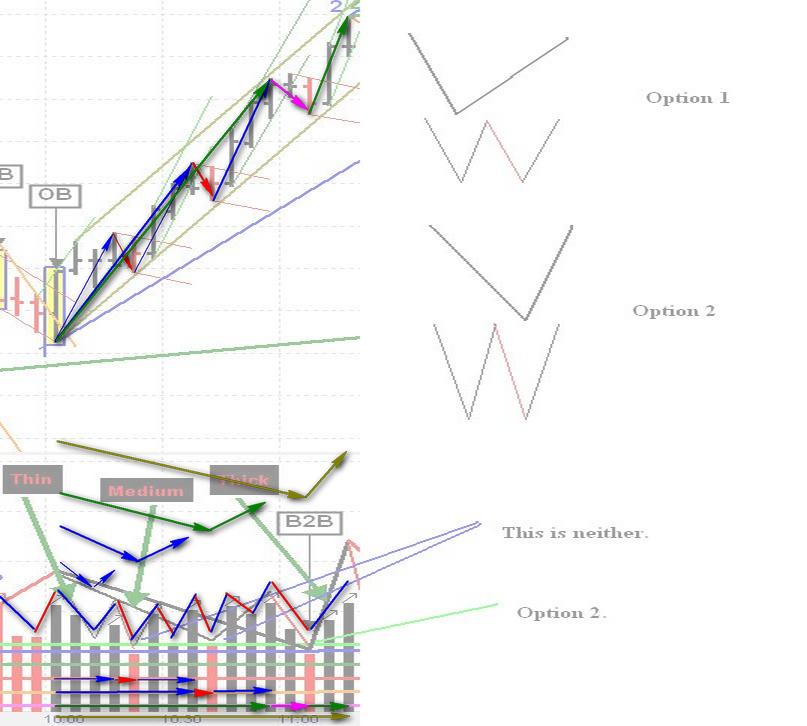
Alright.Now, we are getting somewhere. You've narrowed things down to a binary choice.
Which Trough best represents the market fractals in terms of 'nesting'?
You've drawn things one way (as did Nkhoi in an earlier post), but another possible way also exists.
My understanding is that the nesting choice depends on the layout of RTLs.
In my graphic you see the "fast" fractal B2B breaks out of the prior "fast" RTL *and* the prior "medium" RTL so the medium B2B trough is placed coincident with the fast B2B trough.
The alternative - placing the medium B2B trough at the fast fractal 2R - implies that all of the medium level black volume has been non-dominant. Since we saw a medium RTL break out this is not the case.
As always - I might be wrong
-
This method is not about hard rules and constrains, but about getting in tune with the market, and looking at all observable signals in each particular context.Understood. I see rules like training wheels - eventually you can just throw 'em away. For me eventually is not here yet
2. no; but sometimes the volume seems to say otherwise because the volume leads the price
Hmmmm... a higher price high or lower price low on lower volume is a very basic PV signal for change. (falling volume => price will change).
Are you saying that in a case when a trend terminates with a final relatively weak volume push -- this PV action might be mistaken for a lateral PT3?
-
A simple question about PT3's -
Does the formation of PT3 ALWAYS involve a break out of the container formed from PT1 to PT2?
EDIT: and one more:
If a trend is lateral (or nearly lateral) is it "valid" for PT3 to pull back past PT1 by a few ticks?
-
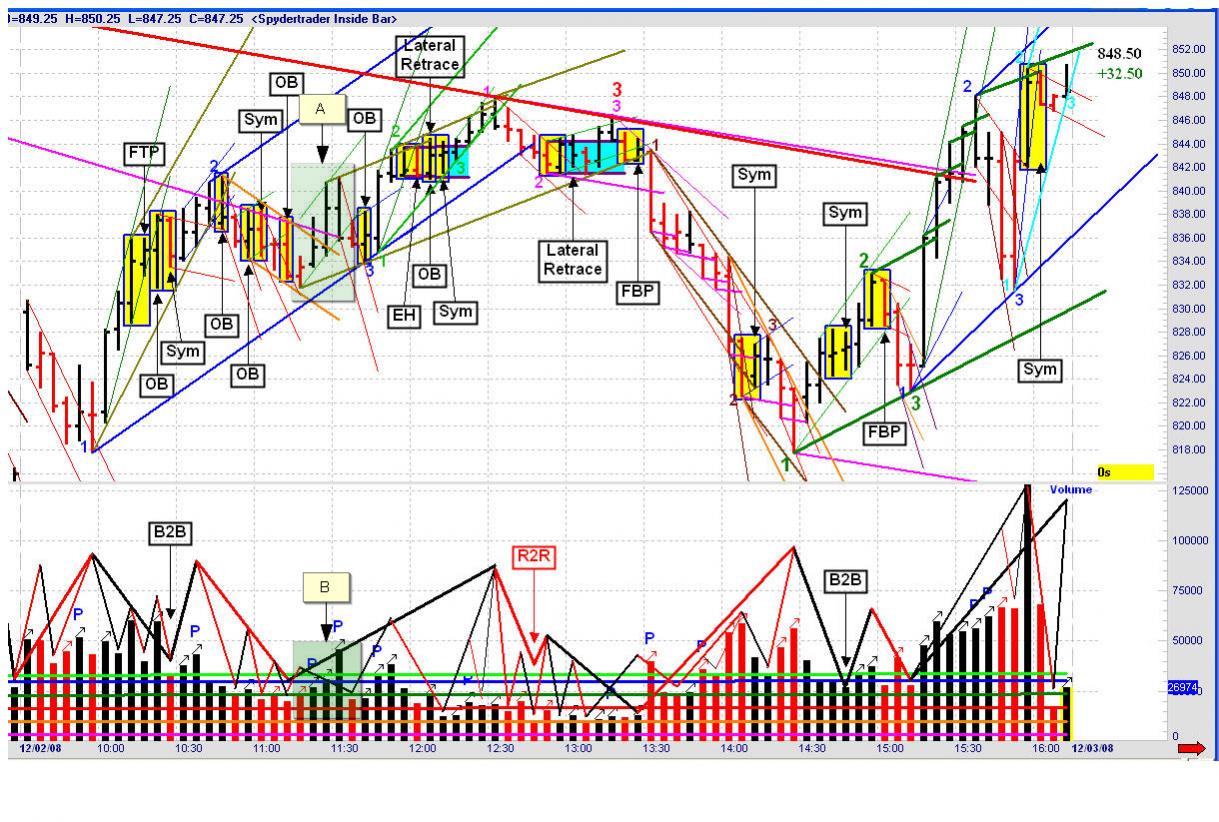
So say a 5 minute fractal trader is examining peaks, and lets say a 5M traverse level trader is performing the routine - He/she knows what is needed first before sequences can possibly complete. We need a PT2 and a PT3 and then a return to dominance before one should look for change? yes?
Absolutely yes.
OK so around 10 AM we *begin* looking for PT3 on our traverse. We immediately have a pullback around 10:15 - why not label this PT3? We also have a red inside bar around 10:30 - why isn't this PT3?
In real time I thought the 10:15 pullback was PT3 so I ended up reversing early - I'd really like to understand why I should have avoided "taking that exit" on the road to sequences completed
-
My view of the day...Have a nice weekend.
ehorn - really appreciate you putting your charts up.
Question - you have a tape level (finest level) B2B opening the day.. ending around 10:45. From the open to 10:45 there are 4 black peaks. Could you detail out the analysis you did as each black peak appeared in real time?
e.g.
peak 1 - not an FTT ... nested volume sequence not complete.
TIA
-
Thanks - this is very very helpful!
I am transitioning from enter-hold-exit to SCT. Seeing what works is useful.
So if you were trading today and not fishing
... I am guessing that today you had:enter at open
2 rev around 10:10
3 rev around 11:30 (or 12:30 depending on how you saw it)
4 rev around 13:20
exit close
All times close of EST.
-
Spyder - a question about your personal trading style...
If I am not mistaken you only monitor and annotate the 5 minute ES - is that correct?
What other charts/time frames do you look at (if any)?
Roughly how many trades per day do you make (on a day when you trade through a whole day)?
Do you employ an SCT style where you always have a position open?
-
Begin your annotations for your down container from the correct Point One.- Spydertrader
:doh:
After letting your simple statement marinate.. I let myself see that I was not letting the R2R or B2B sequence fully complete before jamming a pt1 in there for the next phase. tks.
-
Let's suppose you have a non-dominant 2R on your trading fractal.
By definition that means it is preceded by B2B and followed by 2B.
Now - we drill down and see R2R in the Non-dom 2R. This is followed by a PACE increase on the drilled down 2B. This PACE increase mimics the 2B of the higher fractal.
Fractal jumping ensues... trader reverses short but the sequence is not complete.
Any advice from the old hands here on things to look for to avoid jumping a fractal in this situation?
-
The DOM short traverse that began ON did not complete by the start of RTH.
The first long tape of RTH was the 2B (which also ended the degapped long traverse from the prior day) - followed by 2R to complete the ON traverse/establish a new short trend on the degapped chart.
If I have some time this weekend I'll put together some graphics.
One very interesting thing about the ON session is that you get predictable pace shifts when various world markets open. This helps you to "see" what a pace shift looks like. This is very useful for situations like a pace shift on a non-DOM (which can be very confusing and you end up screwing up your annotations).
-
Looks like the volume sequence is nearing completion. We have 2R and we are just waiting for a definitive 2B/FTT. When this happens the last trav of RTH also completes and we have a pt1 of a new traverse.
This traverse may end during the ON session or it may carry over into tomorrow's RTH. If it DOES it will also be consistent with the de-gapped chart. This helps you really get on top of the opening.
-
The first 15 minute ON bar was green... so it was WITH the trend of the closing tape. Falling volume with the trend tells us to look for change. The next bar of the ON kicked off a R2R.
Here's the cool thing. Once we see DOM black volume again - there is NO WAY it will best the volume levels on the tape that closed RTH. So *categorically* the yet unseen DOM black volume will END the sequence of the long traverse that the market was making during RTH.
DOM has switched back to black on the ON session. There was a VE coincident with Australia's monetary policy annc. We are sitting near the LTL.
So far we have B2B only. When the volume sequence completes - it is the end of the long traverse being built during RTH. There is just no way there will be sufficient P&V to continue that trav.
-
About degapping -
I have found that the PV patterns stay consistent as they cross from RTH to ON and ON to RTH. I use a 15 minute and 60 minute chart to see the volume trends during the ON session. If you just apply the logic we all know and love - you'll find that it works!
For example - today's RTH ended with the market making a DOM black tape on the 5 min. The highest volume pace was extreme... and the volume trend over the tape was falling into the close.
The first 15 minute ON bar was green... so it was WITH the trend of the closing tape. Falling volume with the trend tells us to look for change. The next bar of the ON kicked off a R2R.
Here's the cool thing. Once we see DOM black volume again - there is NO WAY it will best the volume levels on the tape that closed RTH. So *categorically* the yet unseen DOM black volume will END the sequence of the long traverse that the market was making during RTH.
Once the market has "tied off" the unfinished business from RTH - then it's just like a normal chart - just much much lower pace.
The same thing applies when transitioning into RTH. Today for example bars 1-2 terminated the short trend that ended the ON session.
The Price / Volume Relationship
in Technical Analysis
Posted · Edited by saturo
Thank you so much for taking the time to put together the chart.
We agree on your annotations as the action unfolds.
More direct question:
Let's suppose I'm a traverse level (THICK gaussians) close-of-bar trader.
Is there anything that tells me to HOLD through the first panel of your sequence of charts? And if yes - what is it?
"volume leads price" - I've heard it a million times but perhaps I need to question my understanding. My understanding is that if you know your place in the volume sequence you know what price will do next. Can you summarize your understanding?