
Welcome to the new Traders Laboratory! Please bear with us as we finish the migration over the next few days. If you find any issues, want to leave feedback, get in touch with us, or offer suggestions please post to the Support forum here.

innersky
-
Content Count
62 -
Joined
-
Last visited
Posts posted by innersky
-
-
You are right. But I was talking about FASTER FRACTAL. Do you think there might be any difference?How can one know, that the market is building the faster fractal thing???
Answer on a silver plate:
Enjoy.
While I do agree with this, on the chart we're talking about there is no such thing as the previous down tape/traverse/channel/goat of the same weight.
--
Innersky
-
at the end of the completion of the faster fractal sequence, what is left for you to look for? You work with nested fractals,don't you? So answer the question.I always used to think that at the end of a completed fractal, one expects the same thing but in the opposite direction.
--
Innersky
-
chart Wednesday July 14th
-
If some day you could annotate your gausian lines, it would be a big help. Label the r2r, 2b etc.thanks
I think this image answers your question. It's on page 2 of this thread. I encourage you to read the thread if you want to learn this.
I don't recall mentioning anything about Price moving in a 'straight line.'Price continues within the trend unless (and until) the Volume Sequences complete.
Always a good idea to understand the vocabulary words before moving forward.
Perhaps, viewing Volume Bar coloration through the lense of Price bar Open and Close isn't the path you should be taking.
Default settings on charting software do not necessarily provide the best view of all the information the market conveys.
I think so. It appears as if you 'see' these Volume 'colors' as a function of Price (however one's software chooses to color the individual bars). If using 'color' causes a roadblock for you, another set of vocabulary words also provides sufficient direction. In the attached, substitute 'deceleration / acceleration & deceleration / acceleration' for 'B2B 2R 2B' or 'R2R 2B 2R' in the Volume panes.
The vocabulary words used to describe the Volume Sequences do not play as important a role as the sequences themselves.
Some have even described the sequences as "hiking up and down mountains."
HTH.
- Spydertrader
-
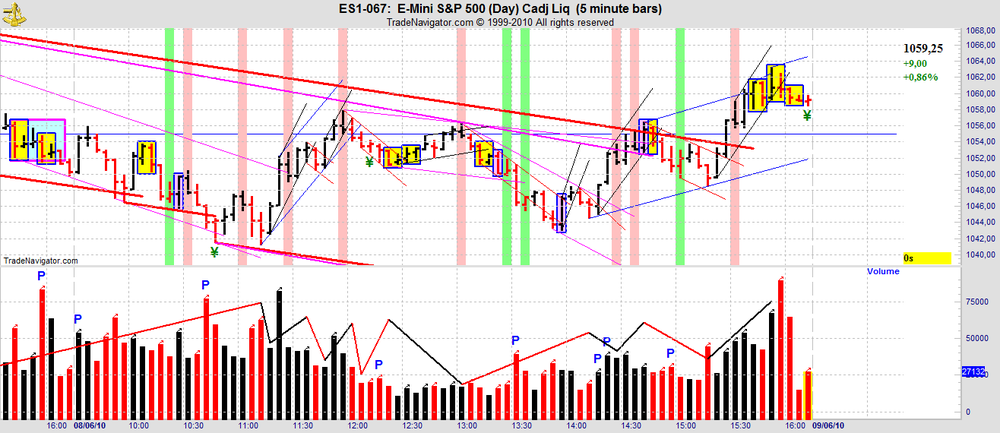
Tuesday June 8th chart
-
Who can complain about a 12 point traverse... lol!Is it a traverse or tape?
--
innersky
-
Here is 1 more ? for you ....Why the last Green Fractal does not End after B2B2R2B??????????
Because pt2 is not outside the previous container?
--
innersky
-
how about this . .
sure there are several fractals going on here, but that's not the point I'm trying to make.
--
innersky
-
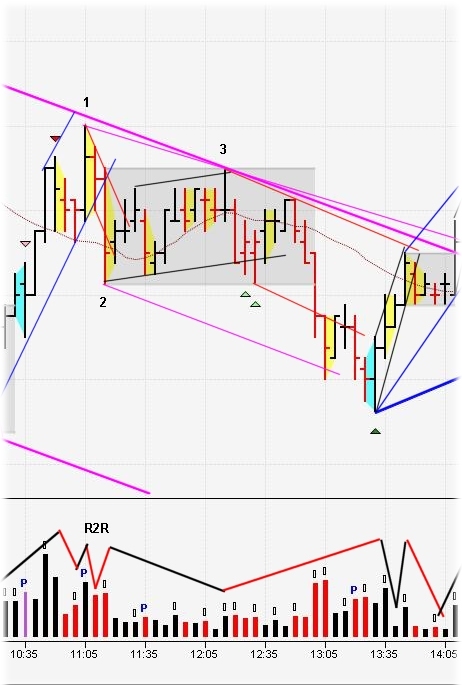
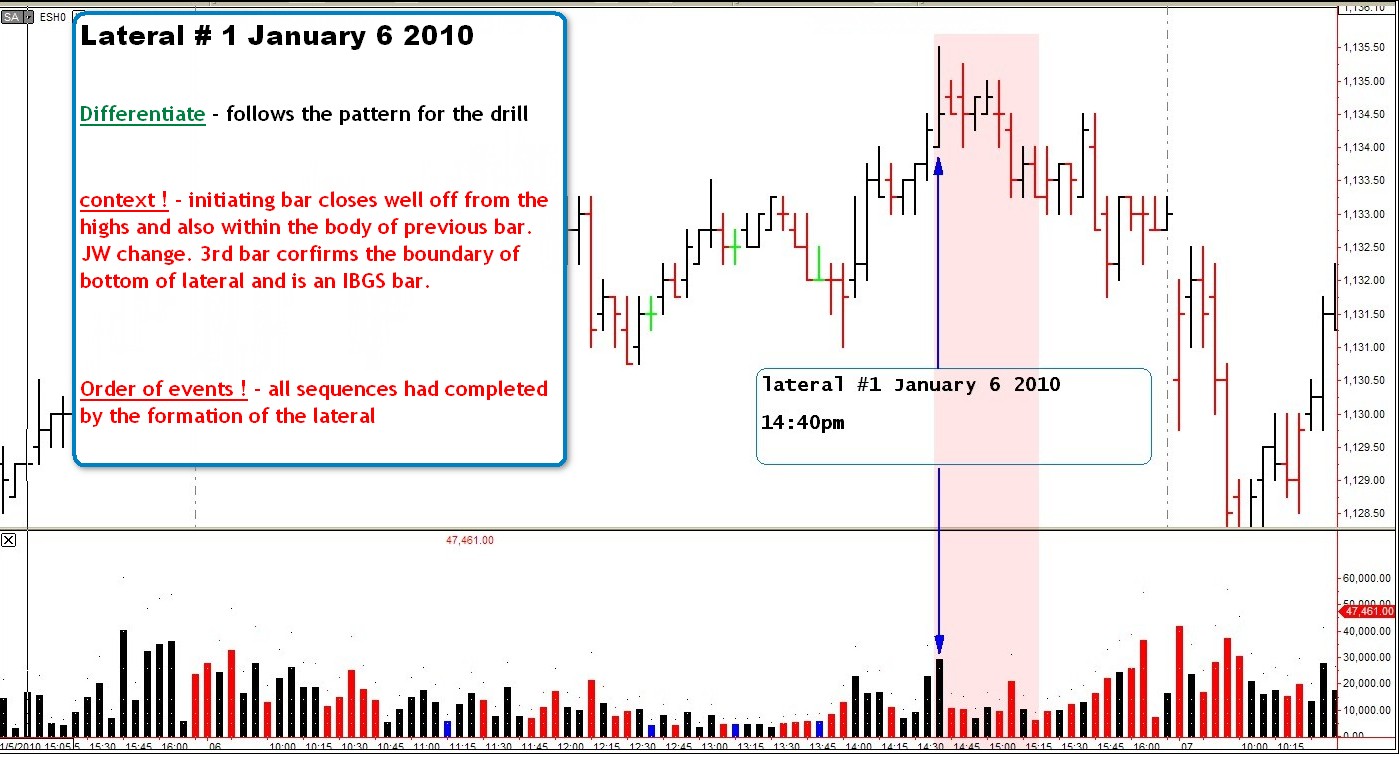
LAT1
I've seen this type of lateral a number of times, and I believe it can be described like this:
- order of events: the lateral starts at pt2
- context: it's a dominant lateral
it has a sym pennant
after creation a non-dominant lateral boundary test follows, that also happens to be pt3
- this lateral contains p2 to pt3, and a part of pt3 to the FTT
- it always exits in the dominant direction
For clarity I've attached the drill image and another example of this lateral type.
--
innersky
-
Because "The Blue Thing" does not accurately reflect the information provided by the market.- Spydertrader
Because "The Blue Thing" is above our trading fractal?
--
innersky
-
Why doesn't the Blue Thing belong to this chart?
--
innersky
-
Could someone be so kind to post a blank today's 5min ES chart from Trade Navigator? I'm trying to compare some data.
--
thanks,
innersky
-
For me the signal of change in such a context would reside on the 5th bar.FWIWIn an uptrend, price making a higher high on increasing volume is a signal of change?
--
innersky
-
Could it be that, in the attached lateral, that at the first bar the previous sequence is complete, but that the actual signal of change happens no the third bar (the outside bar) inside the lateral?
--
innersky

-
Then name the differences anything you like. Up / Down, Left / Right, Goat / Hedgehog or whatever other binary pattern suits you. The vocabulary isn't nearly as important as recognizing a subtle difference in the object itself (at this point in time). For example, the first example of a Lateral (today), moved in the opposite direction of the previous bar (Note, how I did not use Dominant nor Non-Dominant here). Whereas, yesterday's examples formed in the same direction as the previous bar (to the actual lateral). Clearly, such a thing would represent a subtle difference.At some point in the future (once you do have a better handle on Order of Events), you can always change the vocabulary.
- Spydertrader
Spydertrader,
Do you mean the bar before bar 1 that starts the lateral? And if so, does it mean that this bar is important in the differentiation process?
--
innersky
-
Yes.No.
rs5 has labelled the laterals based on the direction (Dom vs Non-Dom) of Bar 1.
- Spydertrader
I presumed in the past that the dominant lateral always exited in the opposite direction, and the non-domainant lateral in the same direction.
Does the difference have something to do with the lateral boundary test?
--
innersky
-
Are they acutally labeled correctly? Isn't the first one also non-dom?
--
innersky
The Second Lateral (the 'non-dom' labled example) does not conform to the examples in The Lateral Formation Drill (and follow up). Understand why it does not.- Spydertrader
-
The first lateral starts with a dominant bar, while the second starts with a non-dominant bar, however, this bar is also an outside bar.
Another difference is that the first lateral moves in the non dominant direction after the second bar, while the other lateral moves in the dominant direction after the second bar.
Also the lateral boundary test is not at the same side.
--
innersky
See attached.What makes the two highlighted areas different?
The 'SYM Lateral 1 - Dom' conforms to the examples in The Lateral Formation Drill (and follow up). 'SYM lateral 2 - Non-Dom' does not conform to the examples in The Lateral Formation Drill (and follow up).
Note the difference.
- Spydertrader
-
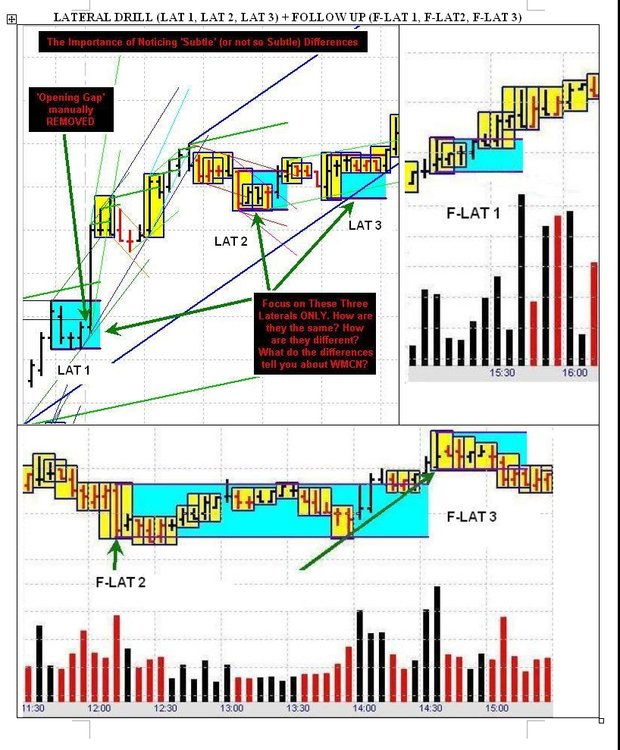
As a follow up to our Las Vegas Meeting, I will (from time to time) post a drill (or a chart section) chosen specificaly for its ability to illuminate the current environment.Attached, please find a Differentiation Drill which focuses on Lateral Formations. At first glance, many will see these three examples (highlighted in blue) as exactly the same and without difference. Feel free to work within this thread, offline, in small groups, in large groups or all by your lonesome - whatever way you feel best suites your needs.
1. Do not overcomplicate.
2. Do not overcomplicate.
3. Do not overcomplicate.
4. Locate the subtle (or not so subtle) differences.
5. Determine what (if any) information the market provides based on these differences.
6. Note what the market provided next.
7. In the future, when 'seeing' a repeat of one of these examples, compare the outcome.
8. Note what (if anything) you learned from the process.
9. Wash. Rinse. Repeat.
10. Do not overcomplicate.
The above drill focuses only those Lateral Formations Highlighted in Blue. Done properly, this drill will point out a few items many have overlooked.
Good Trading to you all.
 :D
:D - Spydertrader
The first lateral looks like a classic non dominant lateral. Price exits on increasing dominant volume. I only wonder if the sym pennant has to be red instead of black?
The second lateral starts the same, but the sequence completes inside the lateral, after having a VE.
The third lateral starts at pt3, and I think this one can be ignored as it's a dominant lateral.
In other words, the first one sits between pt2 and pt3,
the second one between pt2 and the FTT,
the third one between pt3 and the FTT.
--
innersky
-
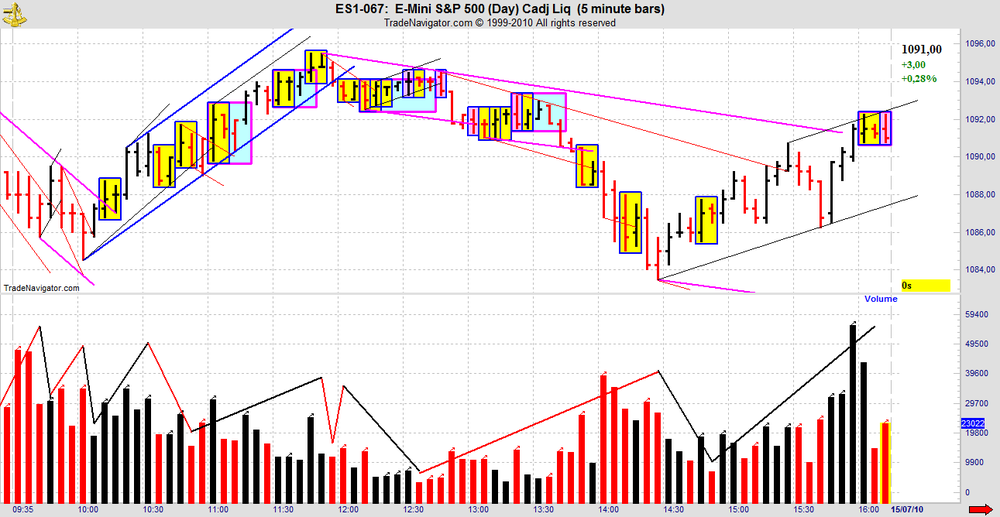
My chart for today, one trade, 11 points. I just held all day.At 15:25 (the pennant) looked to me as a signal for change (the lateral has ended on the previous bar and we're back into the up trend) as it gets broken on the downside on increasing red.
What did I miss here? Why isn't this a signal for change?
--
thanks,
innersky
-
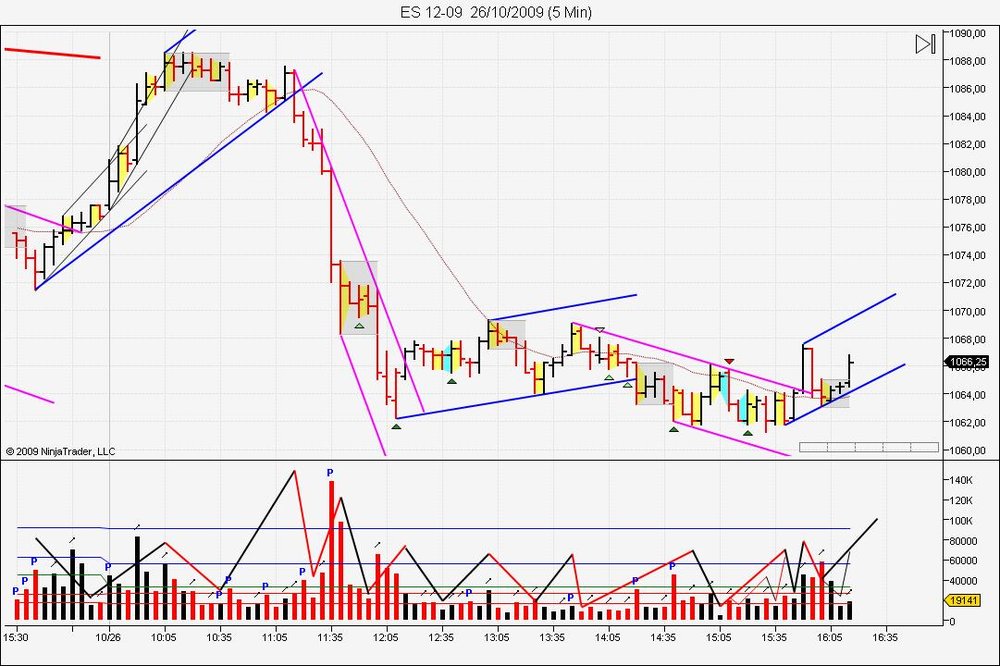
chart for October 26
--
innersky
-
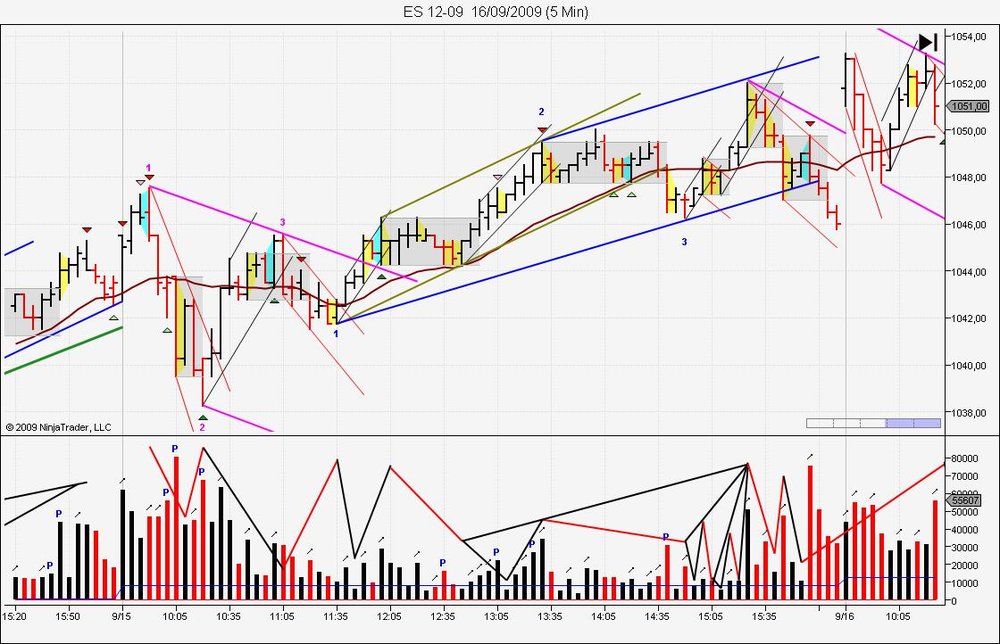
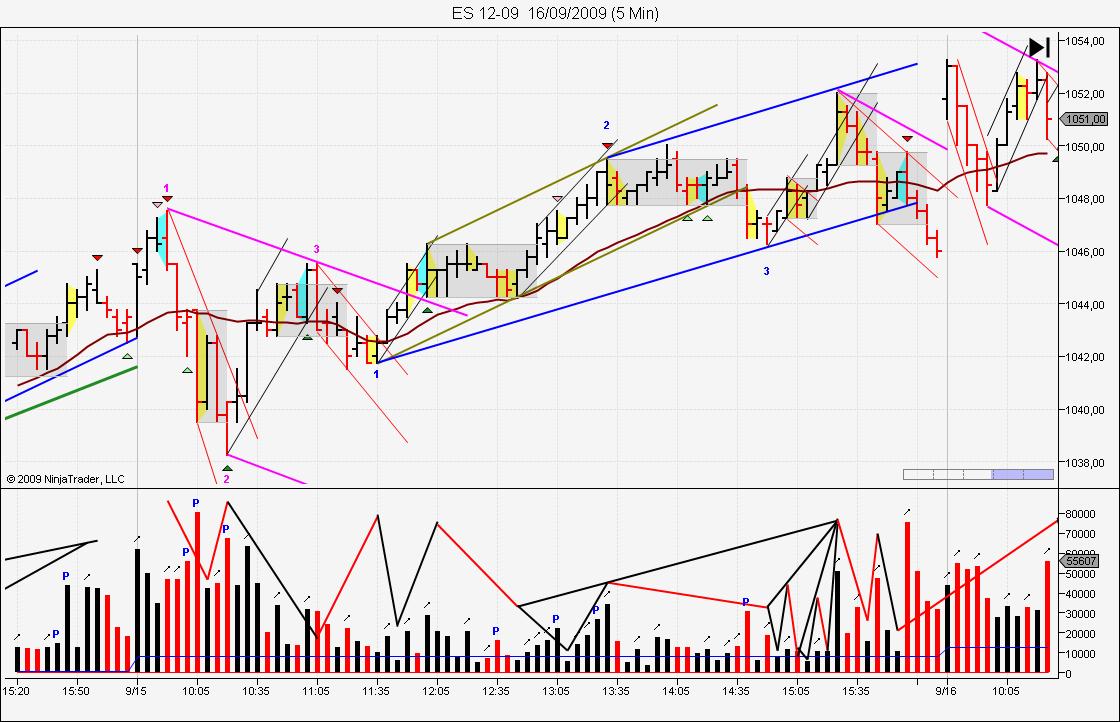
September 15th, after debrief...
-
I also thought 1310 was skinny b2b. LOL:doh:Romanus,
when/how did you know to fan the blue up traverse? It looked like a completed sequence to me at 14:05.
--
thanks,
innersky
-
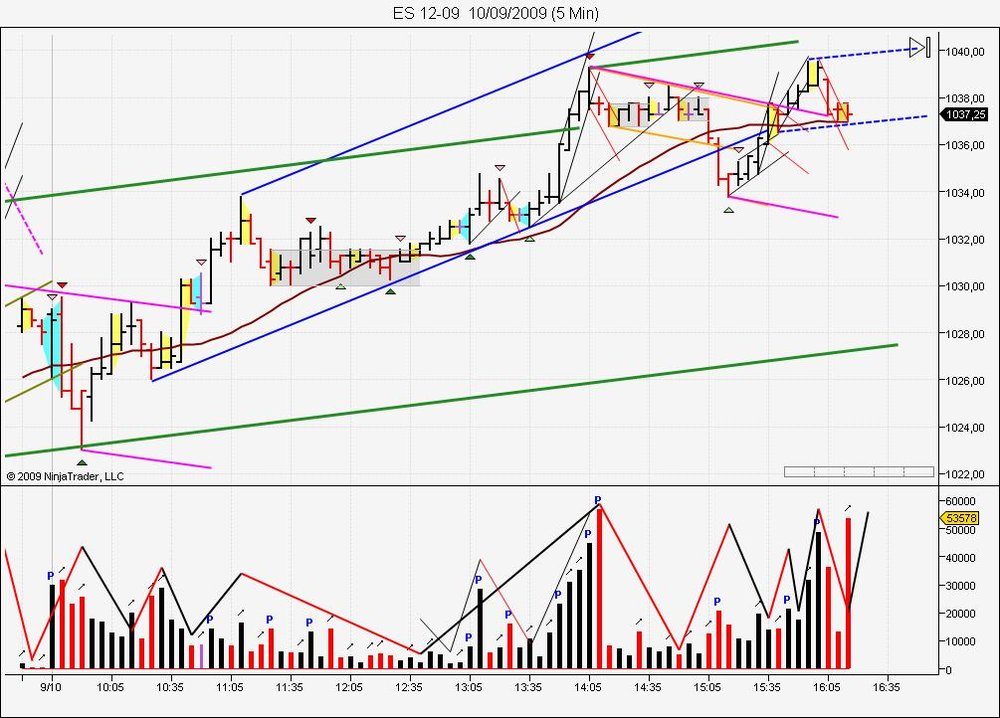
September 10th 2009 chart

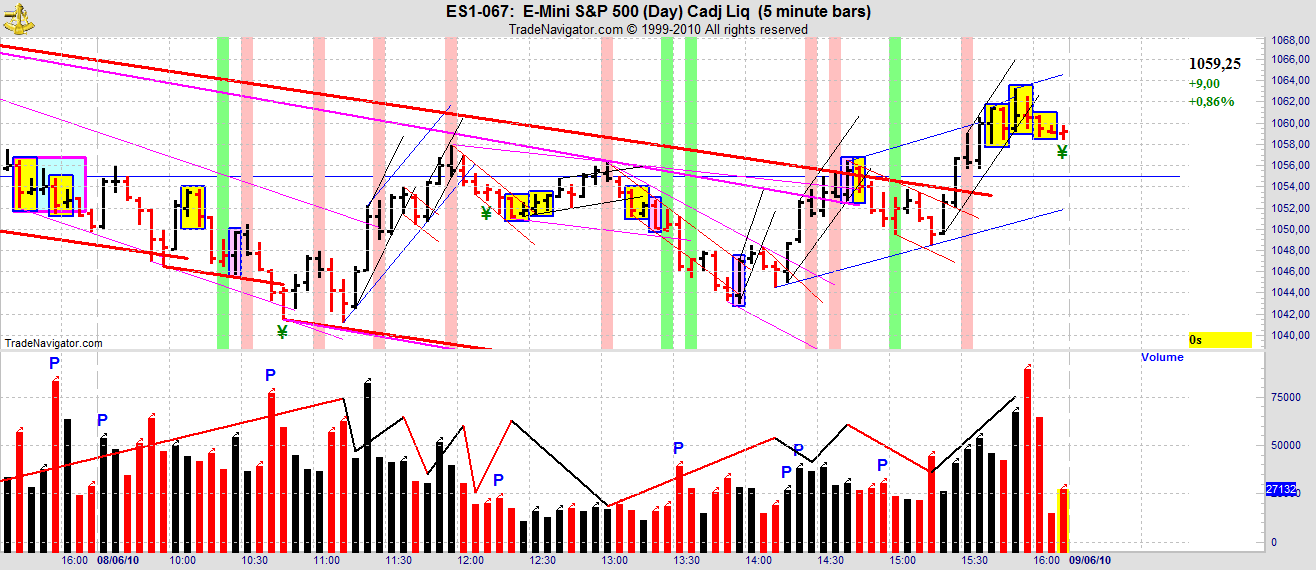


The Price / Volume Relationship
in Technical Analysis
Posted
The post on ET you refer to, treeline says : "We know this because Points 2 and 3 of the faster fractal traverse occur inside the confines of the pink ES-only down traverse."
In the chart you refer to here, there is no such comparable thing as "the pink ES-only down traverse".