
Welcome to the new Traders Laboratory! Please bear with us as we finish the migration over the next few days. If you find any issues, want to leave feedback, get in touch with us, or offer suggestions please post to the Support forum here.

innersky
-
Content Count
62 -
Joined
-
Last visited
Posts posted by innersky
-
-
Let's assume it is that lateral (and I'm not saying it is), then why ddin't he annotate the first 3 bars as R2R?
l a t e r a l
-
I didn't ask jbarnby directly, so anyone is free to find the answer for him or herself, I don't think guessing would help anyone.
PS I'm pretty sure he is not the only one who knows the right answer.
Your question is for jbarnby to answer. It may or may not have been intentional.He is the only one that knows to answer, unless you are looking for others to guess.
-
Of course there are faster fractals playing, and they become visible on faster time frames, but that's not the question here...
Why stop there? Since the market is fractal in nature, every slower fractal is made up of a faster fractal. Your faster r2r is made of a faster r2r2b2r.Drop down to a faster time frame to see this.
HTH
-
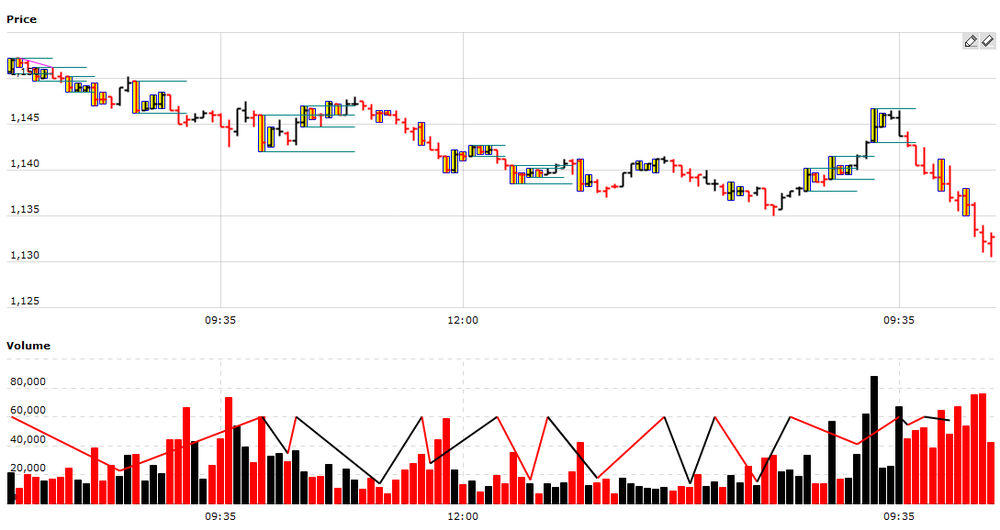
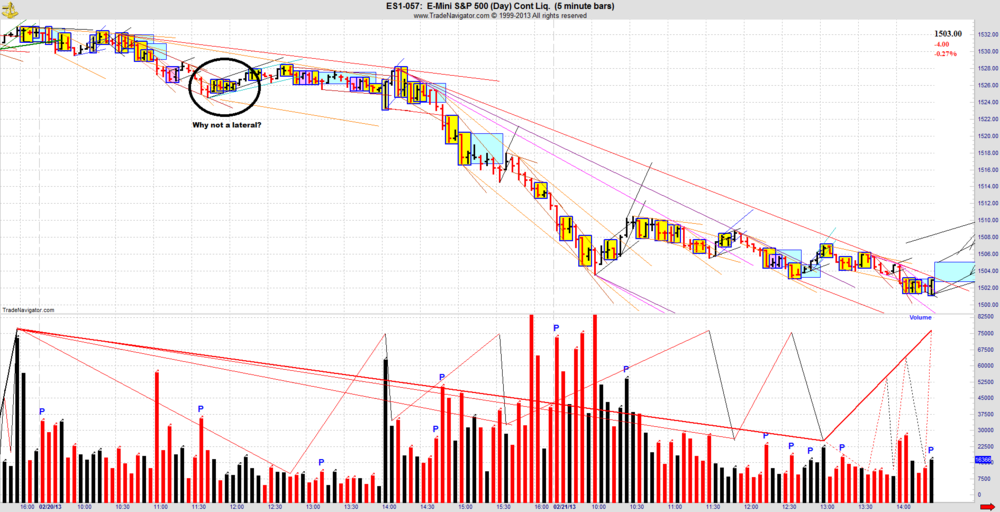
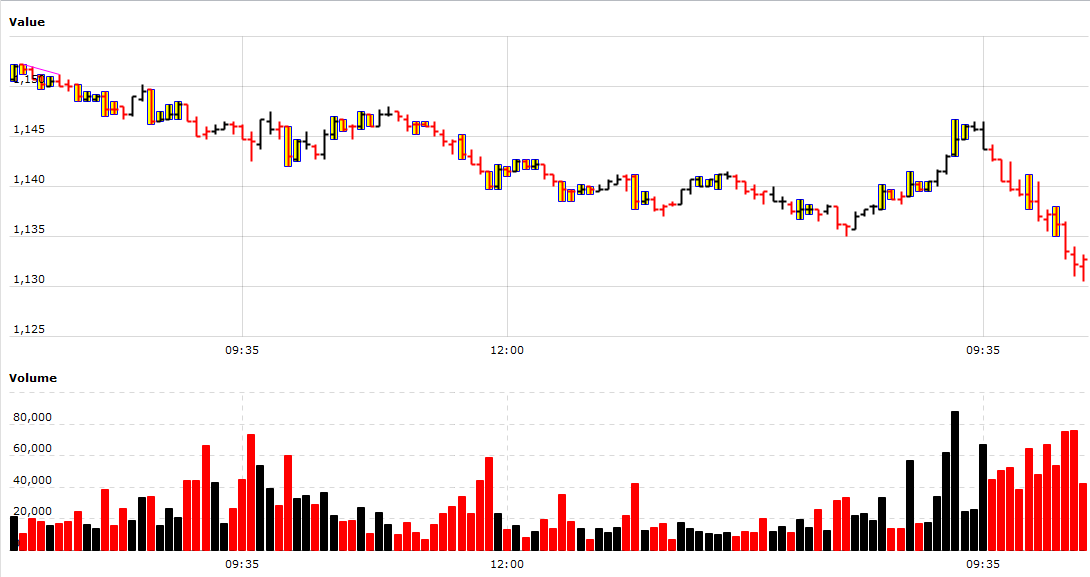
In the attached chart from jbarnby, I've added a faster fractal in the volume pane, see the dashed lines.
Question of the day: why didn't he put it on his chart in the first place?
-
As the gaussians more or less do what I want them to do, this is still not anywhere near something that actually works. It struck me that I also need price. And more specifically, VE's. No kidding Sherlock :-).
So next step: automated channel drawing.
--
innersky
-
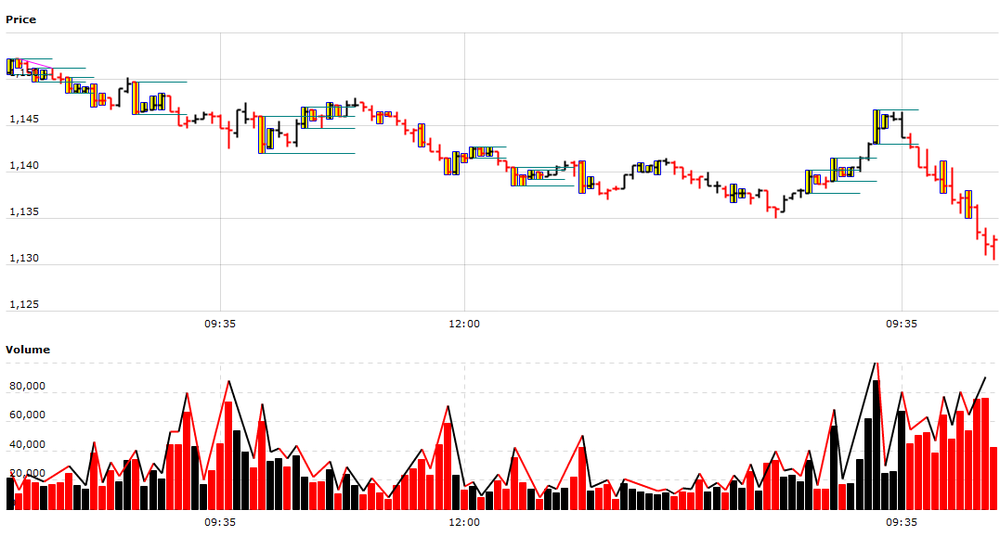
In the attached chart you can see automated gaussians in their most basic form. R2R 2B 2R and vice versa.
That was the easy (technical) part, now the real thing can begin. Iterative refinement.
Making small (price and volume context) modifications and see how it turns out.
The result, based on these gaussians and without slippage is -1.5.
I'm pretty confident that this can be improved :-)
--
innersky
-
Is there any reason you are annotating laterals in laterals, I don't recall Spyder doing that? Since the original lateral has not ended what do the internal laterals tell you?Thanks
I assume they can be ignored, if they end inside the lateral where they started. But I didn't code that up. Yet.
-
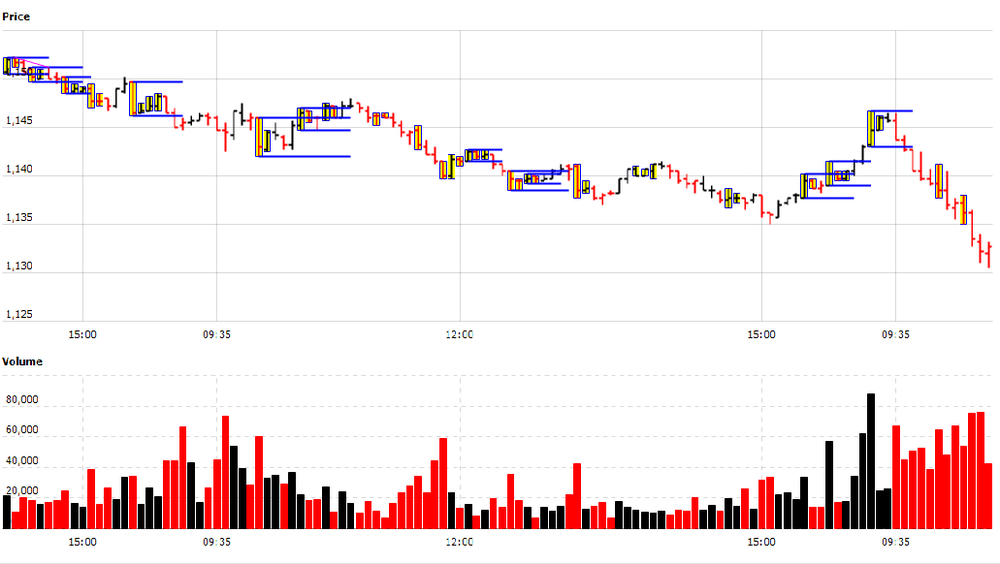
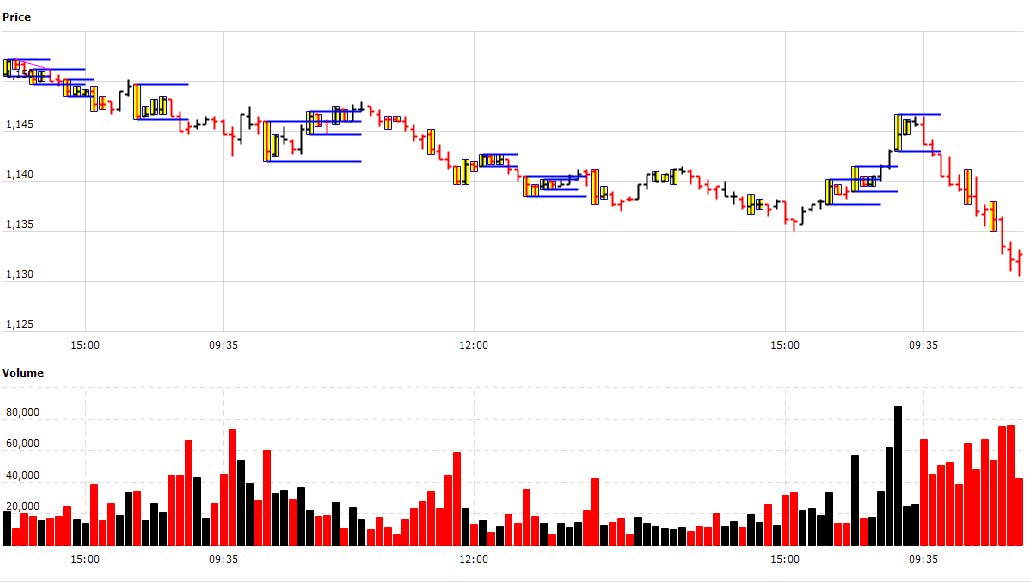
Added laterals (see attached chart). Next step: automated gaussians.
--
innersky
-
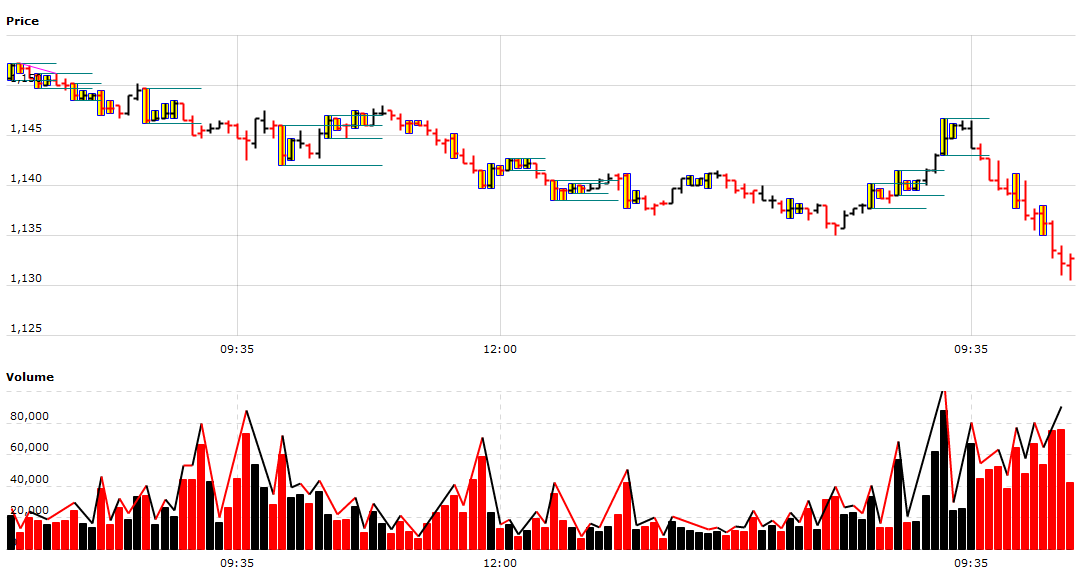
The chart has been updated and now displays internals (no laterals yet). For technical reasons they're displayed slightly differently compared to TN or NT, but it gets the job done.
--
innersky

-
I can give you a better explanation. Those laterals have been drawn in manually. When I compare it to my TN with lateral study enabled it shows up as a lateral. Please find image attachedHTH
I'm not sure about that. If you look at his charts you'll notice that he also made other changes to the indicators. (like another color for stiches)
Also, I've seen exact the same thing on another chart from jbarnby...
--
innersky
-
I am not planning to make changes to NinjaTrader indicators at this time... (but if it isn't a lot of work I'd consider making changes)
A good conlcusive ruleset for laterals would be nice...
I wonder if increasing volume really plays a role here? (I've seen otherwise in Trade Navigator) But I could be wrong of course.
--
innersky
Hi innersky,Thank you for your planning to code indicators for lateral formation. The updated rule for ending a lateral is here---
----------------------------------------------------------------------------------------------------------------------------http://www.traderslaboratory.com/forums/technical-analysis/6320-price-volume-relationship-501.html#post179301
Conditions that End a Lateral:
1. 2 bar closes outside that in of themselves do not create a formation.
2. OB (regardless of the bars close, on increasing volume over the previous bar) that pierces upper and /or lower boundary on increasing volume.
3. Up IBGS on increasing volume (over the previous bar) that pierces the lower boundary.
4. Down IBGs (on increasing volume over the previous bar) that pierces the upper boundary.
5. A close outside the laterel that would be a 3rd close outside but being a bar
subsequent to point 1 above.
(ie: 2 bar closes outside that do form a formation in of themsleves and hence would not end the lateral
but then a subsequent (3rd) close outside, after the formation, would end the lateral).
------------------------------------------------------------------------------------------------------------------------------
Please notice that there is Stitch with IBGS condition. I would like to provide necessary images of ending laterals if you need them for understanding the rules. May I ask you to update BarPaint2 (marks for IBGS) besides PV-BarFormations indie? TIA
-
Let's start with the creation of laterals....
I've attached a chart that jbarnby posted some time ago. Can anyone tell me why the circled area isn't a lateral?
If I had to make an educated guess, I'd say that it is because this area that looks like a lateral is completely filled with internals.
--
innersky
-
EVERY bar has to be degapped according to Jack's current guidelines.I prefer to follow Spyder's guidelines. He said it does not matter, that both are ok.
--
Innersky
-
No, it is not correctly degapped.So why do you think it isn't correctly degapped? Sidenote: I did not degap every bar, only between days.
--
innersky
-
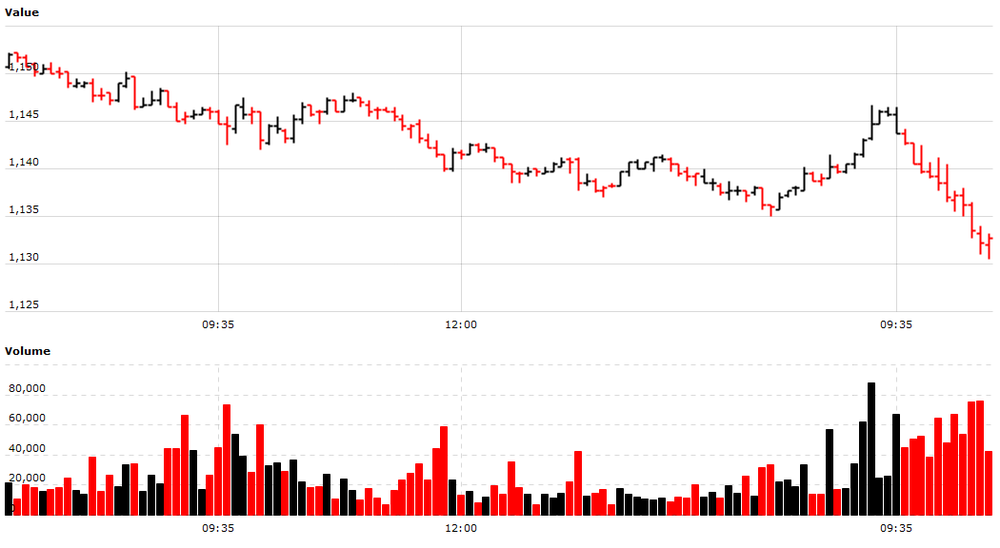
I'm currently making a charting program that can visualise any period of any ohlc data on a chart. I have ES 5 minute ohlc data starting from april 2009 up till now, execpt the 2 months I mention above. In attach you can see a screenshot of what it does. It's a basic degapped and correctly colored chart of a known channel as discussed somewhere in this thread.
Next on my list is displaying internals. (so called yellows)
This brings me to the following question, besides 2 consecutive closes outside a lateral, what is the other event that ends a lateral?
--
innersky
-
Does anyone has OHLC (and volume of course) data for ES for April and May 2012? Preferably in csv format, but anything readable will do.
--
Thank you,
innersky
-
I've had a lot of success with this method. While I'm grateful to spyder for his insights and guidance, most of my success came through self-discovery, using the basics described in this and other threads. I will upload a couple of recent Traverses in hopes that it might encourage others. Success will only come after you achieve complete understanding of how to build containers correctly and manage fractal nesting,In that first chart attached, a R2R seems to start 12:35, and ending at 13:10. At its end it turns into a lateral. However, this lateral starts with a lower peak, compared to the rest of the R2R.
Does this mean that the R2R isn't done yet, and as such we know that we are still on a faster fractal?
PS Thanks for posting your charts, it helps.
--
innersky
-
Try this: MEGAUPLOAD - The leading online storage and file delivery service
anybody have video Channel for Beginner by bundlemaker? thanks. -
You have one more container to annotate in order to create a thick fractal (channel). You'll then have three medium weight containers to compare and contrast. If you complete the annotation process for a channel (thick container), you should see two very similar traverses and one different traverse. Determining why the two are similar vs why the one is different should then become easier for you.- Spydertrader
I think the answer to why the difference between the traverses is (volume) pace. Actually it is the significant shift in pace that makes the difference imho.
--
Innersky
-
Anyone here have a degapping script for Ninja Trader they'd like to share?Should be in this thread somewhere : Forums - Software Used to Trade Jack Hershey Methods
--
Innersky
-
Is this a recent chart?
thanks
I thought this might be a fun sequence to bring up for discussion. I have it on "good authority" that this snippet represents a Traverse. For context, this is a non-dominant traverse of a down channel. We have a complete skinny cycle up to 1105, then a down tape followed by an up tape. Would you have seen it as such? Why or why not? -
You just need to login and it's gone.No it's not, even after a logout/login it keeps appearing.
--
innersky

-
No plans for it to be on the forums, just intended for new people to the site. Thanks.That new popup version is pretty annoying... How about not showing it to members?
--
innersky
-
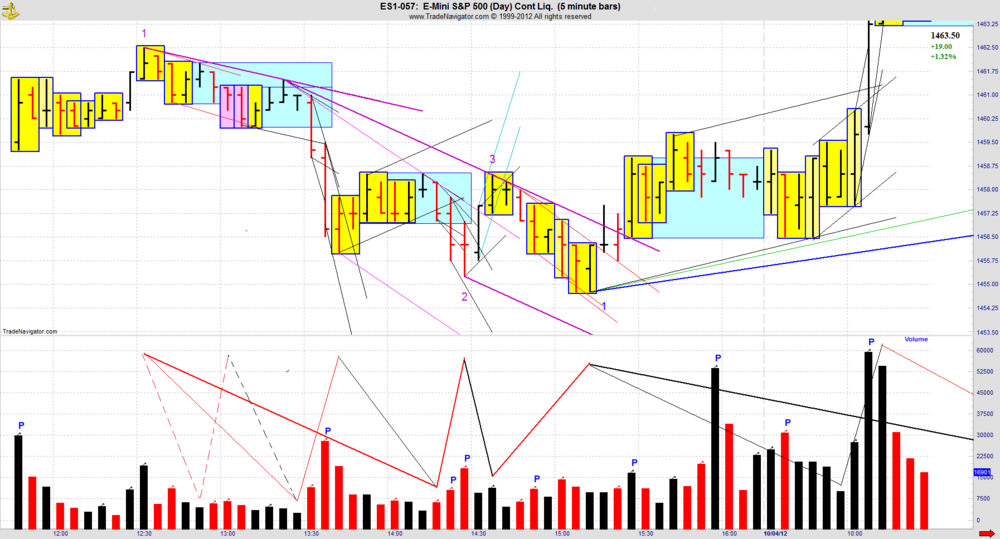
Really? Try to stop concentrating on the colours and start concentrating on the POINTS (123) and INSIDE and CONFINES. Fractals NEST.Another one for you.
Why is the slope of the blue line on the chart (I mean the chart with mysterious blue point 2 this little bastid Spyder put there
) shallower than the slope of the green line?I try not to concentrate on colours but on fractals of the same weight.
Because the lowest fractal (cfr the blue point 2) isn't complete yet. We still expect point three and then an FTT on this fractal before it can complete.
--
Innesky


The Price / Volume Relationship
in Technical Analysis
Posted
Thanks for posting, I've never looked at it this way. I'm not saying it is the correct way to look at it (and I don't know) but it's very interesting.