
Welcome to the new Traders Laboratory! Please bear with us as we finish the migration over the next few days. If you find any issues, want to leave feedback, get in touch with us, or offer suggestions please post to the Support forum here.

Dinerotrader
-
Content Count
728 -
Joined
-
Last visited
Posts posted by Dinerotrader
-
-
Here's a great example from today's ZS chart that I posted in the p/l thread. There's a gorgeous candlestick pattern there at the HOD. Now if you had some resistance there on your charts that could be a valid short.I saw that on the P/L thread. I spent a few hours marking up some charts around that reversal. I tried a few different VBC charts of various contract sizes and some tick charts. I have a hard time lately using time charts lately since, IMO , it appears that they conceal so much of the price action and its associated volume.
Should I just use one scale on a chart (i.e. VBC 1000 contracts) to look for candles or do you think it is useful to watch several types/scales for a good reversal candle pattern near S/R?
-
I have opted for option b. I want to extract $ out of the market daily and to do that I realize that you have to be content with achievable profits and deal with it.
Brownsfan,
Really enjoy your comments here. I know you can't explain too much of your strategy but if you can post some "real time" trades based on candles here after you are done with your real money trades I would be greatful.
I frequently circle back to trying to use candles in my setups but keep on giving up on them because either they give me so many false reversal patterns or when price is at S/R and a good reversal occurs they don't produce a candle that I would have traded from. Something real time would be helpful if you end up with some spare time some day.
Thanks.
-
I was hesitating wether to post this or not. After all, this is a big hit to my ego but I thought that to be fair to everyone - and to myself - I had to post the above fact.Gabe
Thanks for posting this. The beauty of this forum is we all know that same exact feeling of hurt ego when we get on a roll and then screw up. Your experience is a great reminder to us all (and of course yourself) to stick to the rules and control risk. We all need that reminder. Read some of the market wizard books. That always gets me fired up after I get down on things. Take care.
-
Better day here but got out of ZS just before the massive drop... thanks ZS guys. Just had to wait for me to exit and then drop it. I exited literally about 15 seconds before the big push down came.
Brownsfan,
Thanks for posting the chart. It's always nice to be able to see what actually happened.
Quick question. I have been watching the grains lately during their huge opening moves and I keep wondering if my stop would fill in the event that price dropped like a rock against me. It moves so fast I was wondering if slippage is a problem.
I just got OEC going on my work computer so I should be getting some SIM trade P/L posting up here soon.
-
Another go at it - worse results.I am done for now.
It is obvious that I am doing something wrong.
Gabe
You charts to so far zoomed out that I cannot even see your entry/exit play out. It also might help if your S/R lines were not dashed lines.
You might have already said but what is your entry and exit strategy for these trades?
Are you watching more than one chart scale?
-
Here is an interesting chart. Playing some sort of breakout or reversal within the channel appears reasonable here but I feel like maybe the setup is not optimal enough to take. Waiting to take the very best setups with the best risk/reward profiles is something I am currently working on. I will probably just watch this one play out.

-
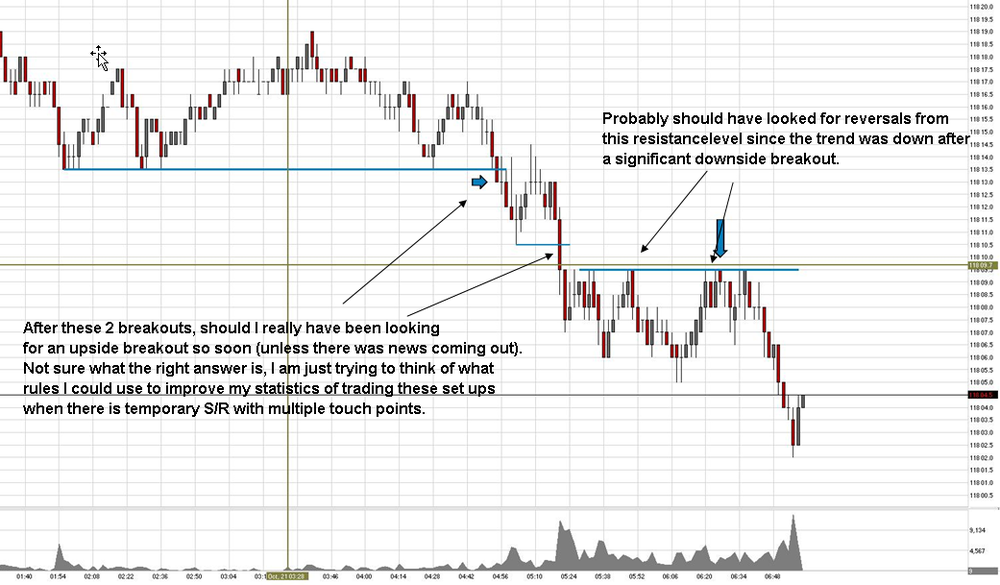
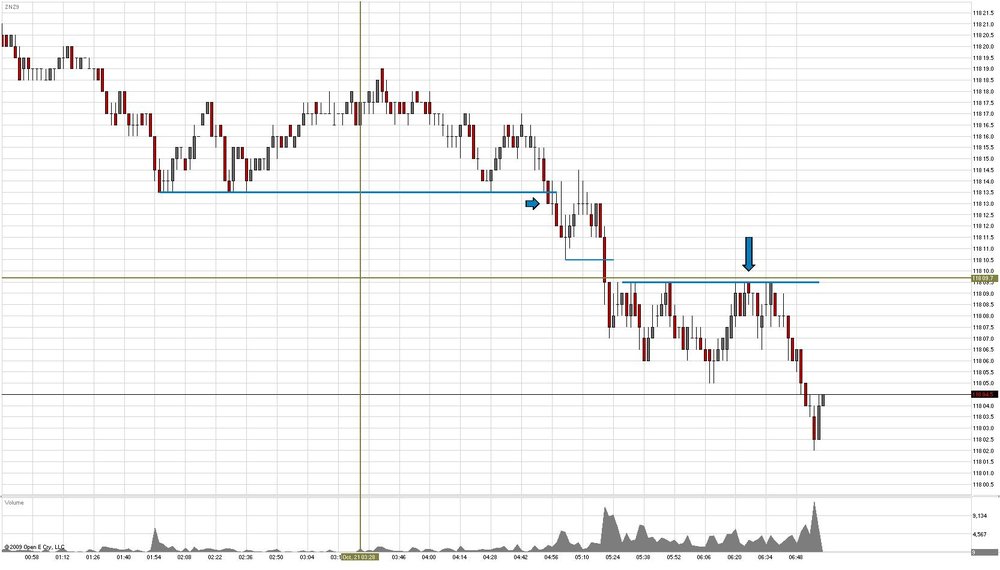
I don't think your reasoning was bad. I think obviously yeah the trend was down, but in that scenario I would have been looking for the upside breakout myself as that would have been the easiest to spot, i.e., it's easy to see a S/R level when price is rejected multiple times.If you are going to play the reversal, what is your entry criteria going to be?
3 things
1. I am still in education and "strategy discovery" territory so I am trying lots of ideas out and trying to see what sticks in my head as good risk reward plays.
2. I would like to have 1-3 different setups or strategies I am looking for. One setup would be a small scalp type trade with a very tight stop. Another setup would be trying to hone in on larger moves.
3. As far as a reversal would go on such short time frames as I was looking, I would note a S/R level with a few touch points and enter at one of the touch points expecting price to reverse once again with a stop just above the S/R level. Stop would be like 1 tick and profit target would be like 2-4 ticks depending on how price was moving. With how price acts on the ES, this would be hard to pull off but the ZN appears to make these short term S/R levels more tradable with less fakeouts. I am hoping to identify a few factors to improve my statistics for such entries.
-
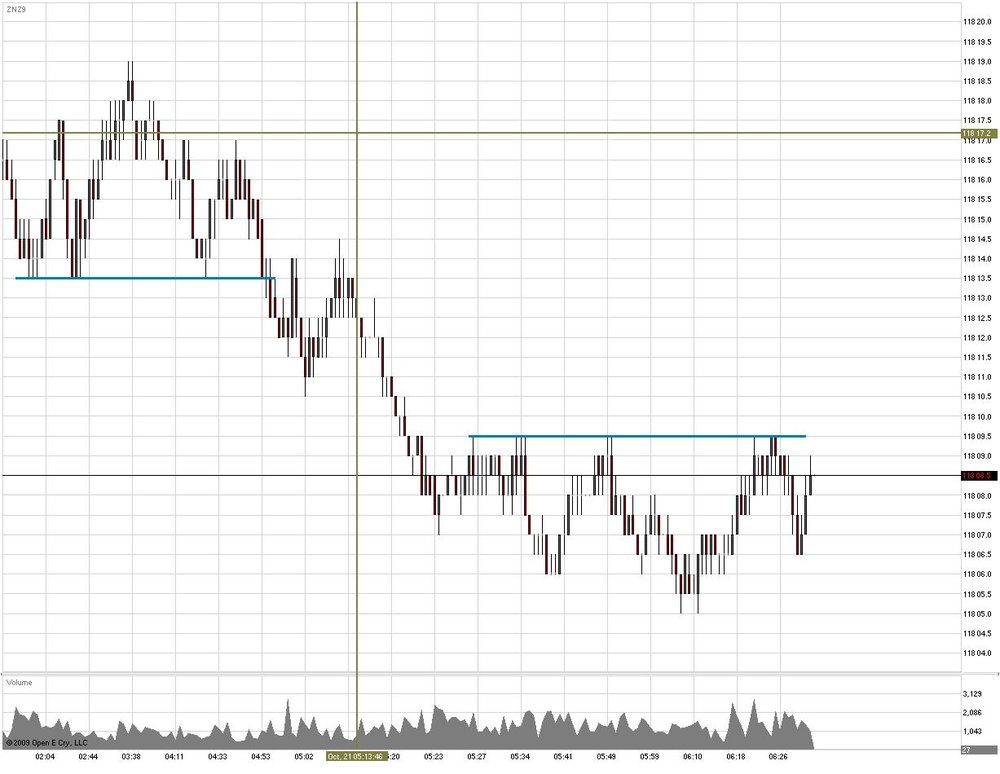
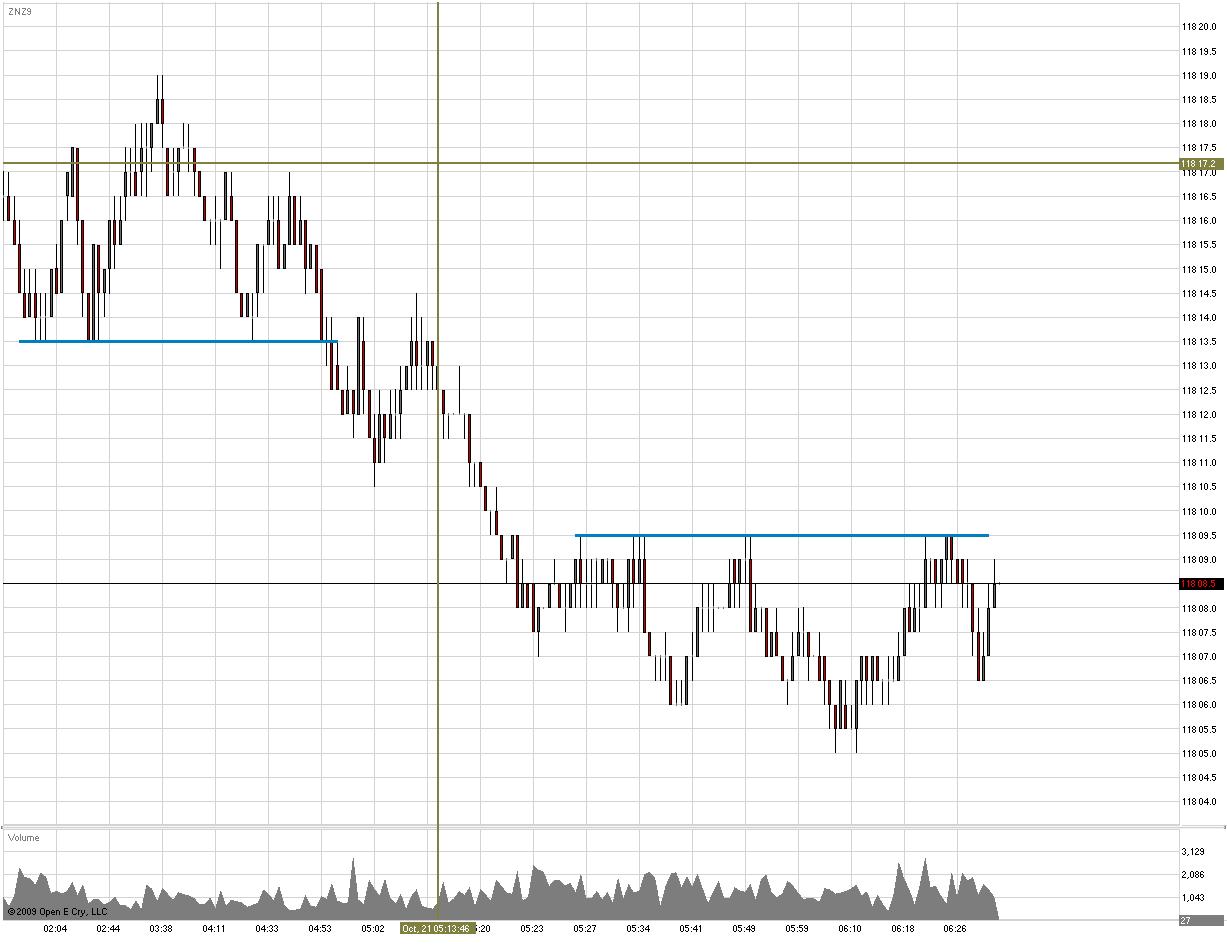
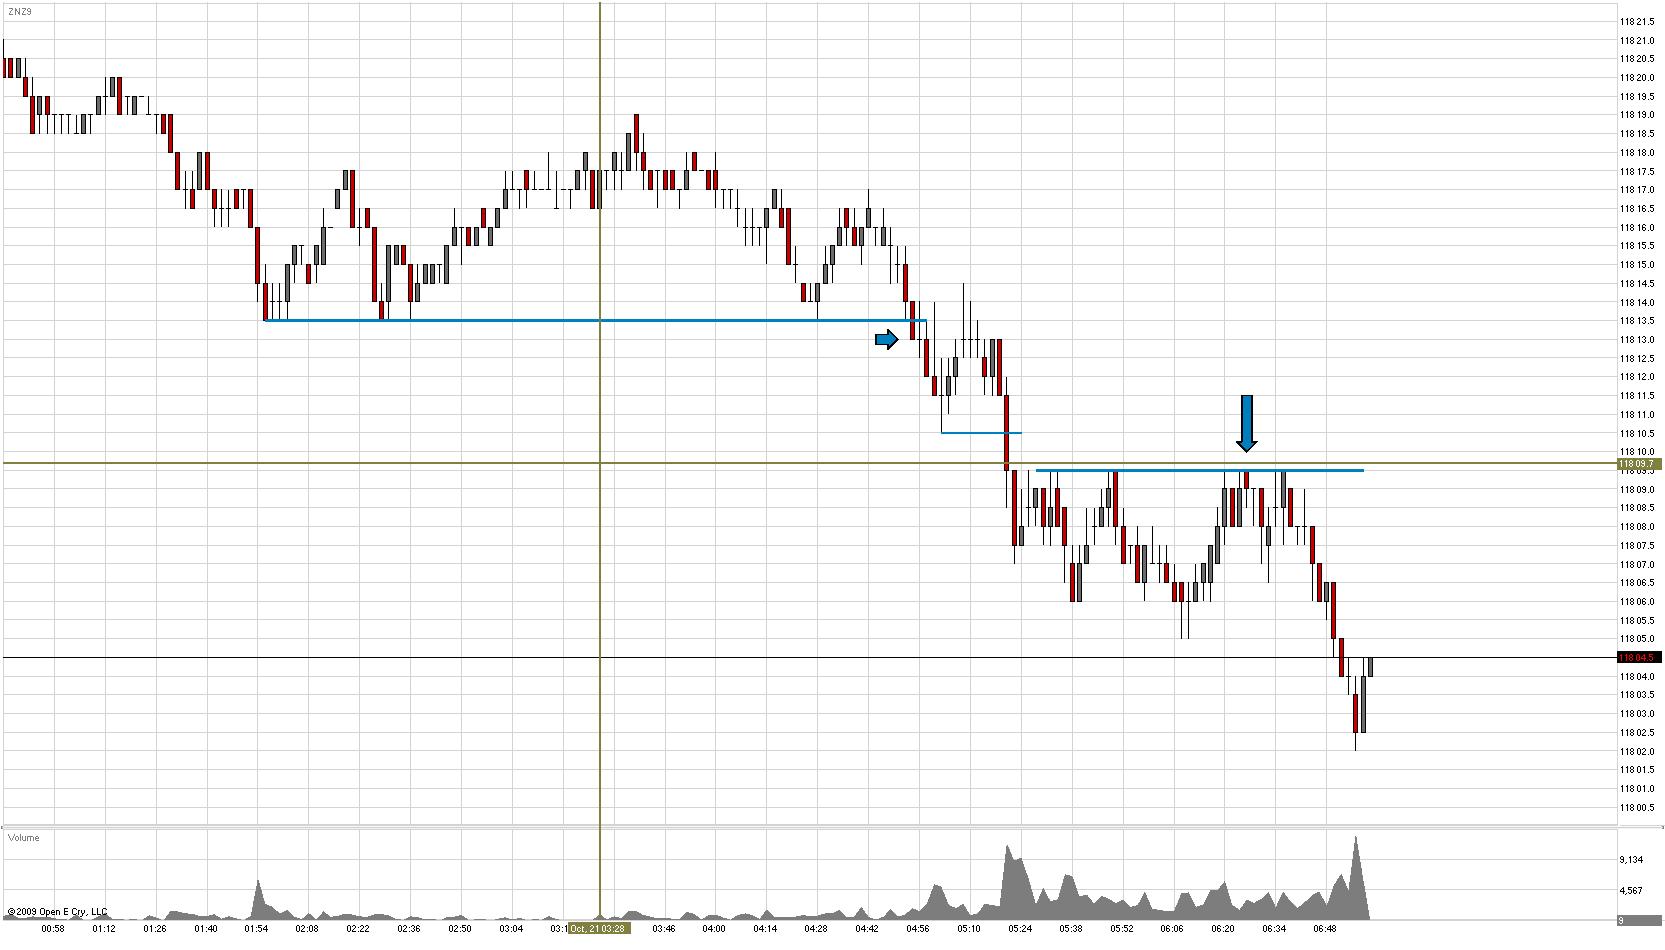
Here is a breakout I am looking for on the ZN this morning.We didn't get the breakout yet. The breakout earlier in the morning I noted would have provided the better intraday position so far.
ZN Trade
Just a few comments/thoughts on this set up noted on the chart below.
-
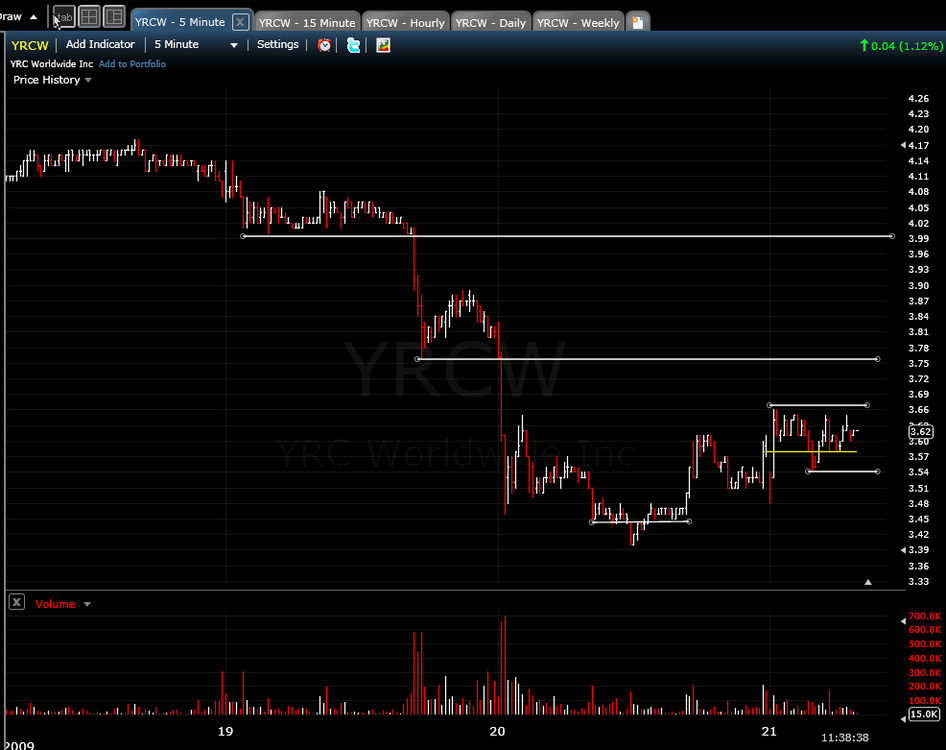
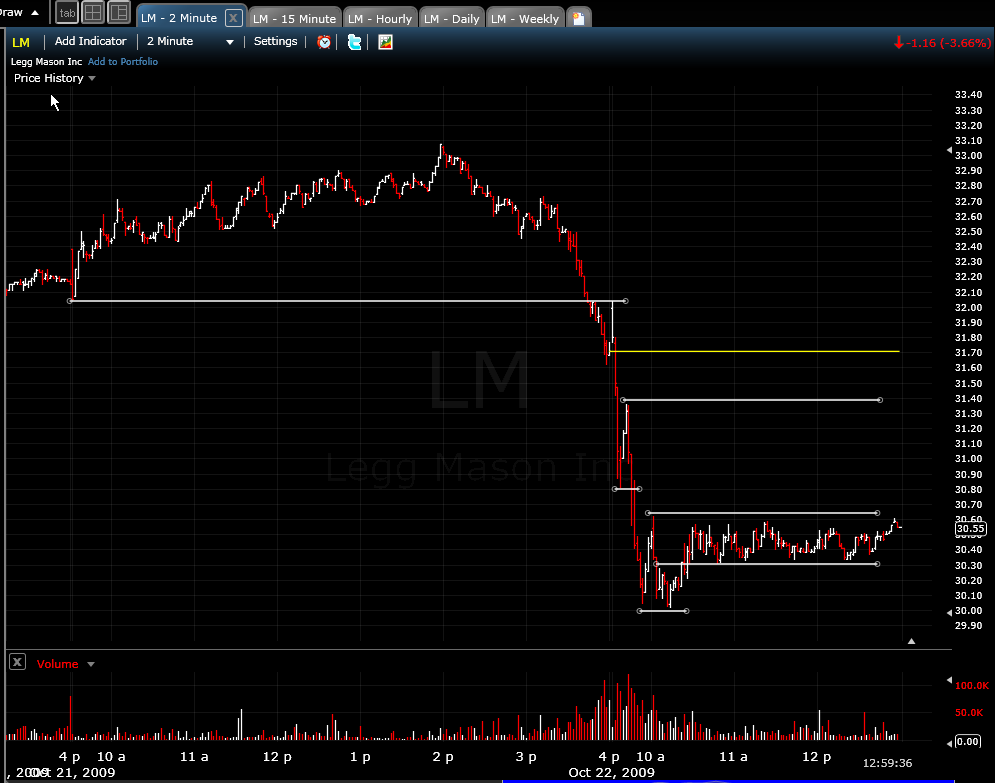
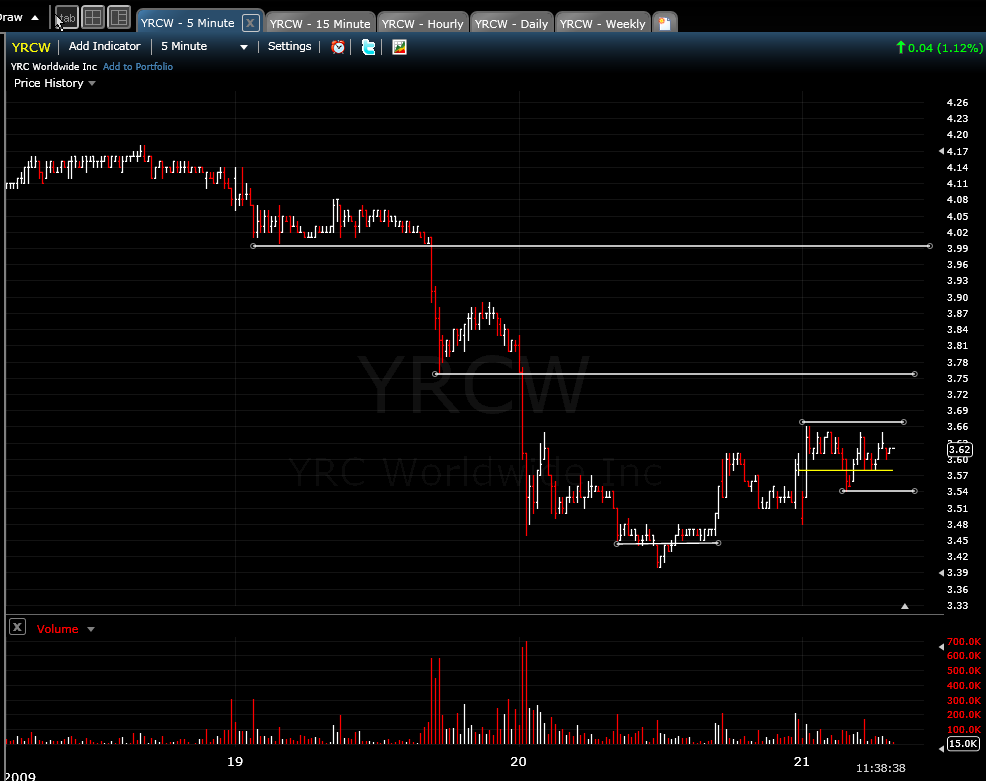
I am only looking at ths breakout because I have watched this stock a lot over the past few weeks and it can have huge moves up on breakouts. It had some major sell offs 2 days ago and yesterday this morning has some reasonable consolidation. My buy stop is at 3.68. Stop loss will be 3.65 because I am not looking for a slow channel move up. It either pops or I am out with a minimal loss.Ticker: YRCW
Never got my breakout but I will be watching that area going forward.
-
I did not express an opinion what I worte above is a factGrey1
Nice.....................
-
I am only looking at ths breakout because I have watched this stock a lot over the past few weeks and it can have huge moves up on breakouts. It had some major sell offs 2 days ago and yesterday this morning has some reasonable consolidation. My buy stop is at 3.68. Stop loss will be 3.65 because I am not looking for a slow channel move up. It either pops or I am out with a minimal loss.
Ticker: YRCW
-
Here is a breakout I am looking for on the ZN this morning.
We didn't get the breakout yet. The breakout earlier in the morning I noted would have provided the better intraday position so far.
-
I second Dino's thoughts. I think the swing you pointed out was just a minor inflection on the scale Thales was viewing.Correction: Dinero, not Dino.

-
Instead of setting my stop to 147.85, I set it to 148.85 like a retard. What a stupid error.Yup, I've done that before. :crap:
-
I have posted a question in the chart.Thank you in advance for an explanation
Gabe
I know you didn't ask me but here is what I would answer (since I asked myself this same question when he posted the trade).
At the time frame he is charting, the swing sizes are larger than the levels you noted. Notice that the "H swing" you noted is similar in size compared to the oscilations the stayed in the channel during the last large swing down. My guess is Thales would say that the levels you noted are minor high/lows but the scale he is looking for the entry would be based on intermediate high/lows.
-
another BTW. My chart looks fuzzy but I don't know why. It is not a compressed image and it looks OK when view from the original on my computer.Any ideas?
If you use Vista, there is a snip tool you can use to just save a selected part of the screen as a jpeg file. If you don't have vista, there is probably a "snag it" program you can download for free on the internet that will do the same thing.
-
Lost some more groundDid not trust my signal and went against it then reversed only to be stopped out and eventually got on the right wave in the original direction.
Gabe
Gabe,
Why is the background on your charts so busy looking instead of being just one solid color? It's like there are tiny grid lines everywhere.
-
I have decided to probably stick with OEC for the next year so I am starting to have several questions as I try to customize and understand how to get what I want out of their charts and such. Let me know if you want this thread to be used for OEC questions still.
Question 1.
Is there a way to make it so the grid lines will always display at the tick level for any chart I bring up. I like to be able to eye ball where my stop loss would be and profit target and grid lines at the tick level would make that easy. I get it right for one contract, save as default, and then open up some other contract and I have no idea how large the moves are in terms of money/ticks.
Any help would be appreciated.
-
Thanks for the kind words Thales.This is just further proof for me that the nut is about to be cracked.
The other day a friend of mine said that he is impressed with my conviction that I will master trading.
FALURE IS NOT AN OPTION.
Gabe
I am of the same mindset. Failure isn't an option. Luckily I am naturally a patient person. That, combined with the fact that I spend all my free time studying, practicing and thinking about trading leads me to believe I will suceed at some point. I am really enjoying the Market Wizard books. They always leave me with very positive thoughts of success before going to bed. The contributions of Thales, Brownsfan, DBphoenix, Bathrobe and many others have really helped me progress in the short time I have been fully engaged in this business.
Good to hear things are really progressing for you Gabe.
-
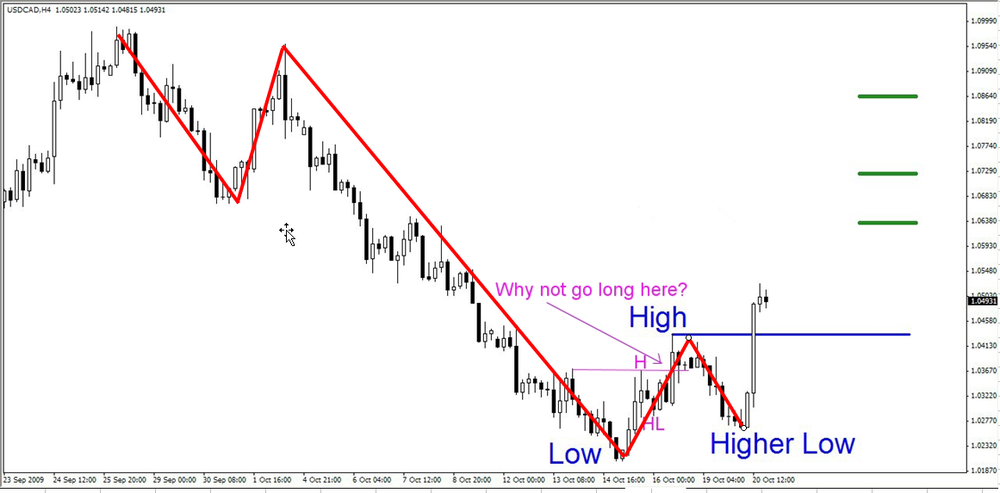
If you focus your attention upon properly identifying support and resistance, then you will ultimately find that your current struggle is over a false choice, and here is why:While not every breakout is a reversal, every reversal can be traded as a breakout.
I was thinking about my post about deciding between breakouts and reversals and I realized that you, Thales, trade reversals quite frequently when S/R holds and price reverses. Here is an example from this thread a while back. Once I realized this I came back and you had posted what I quoted above. It just hadn't clicked yet. Thanks for your patience.
-
I am constantly perplexed when I see folks try to short fierce rallies or buy precipitous declines (though at the same time I am quite thankful for such folks, as there actions feed the rally or decline in my favor).I guess that was me on my last short I posted here. At least I was able to put food on the table for your family on those trades.
I am struggling trying to decide if I should focus on breakouts or reversals. I see both occur and produce great trade potencial. I was reading Paul Tudor Jones in the market wizard book series last night and he said,
"....the very best money is to be made at market turns. Everyone says you get killed tyring to pick tops and bottoms and you make all the money by catching the trends in the middle. Well, for twelve years, I have often been missing the meat in the middle, but I have caught a lot of bottoms and tops."
After I read these types of things I think I should be looking at reversals more. But of course, there is a large group of amazing breakout traders also. I guess you either have to figure out how to play both of them which might be hard to manage or you have to just pick one and refine your ability to pick them from price movement.
Thanks for your thoughts Thales.
-
I think that using a simulator like NinjaTrader would be most beneficial and will allow you to gain valueable screen time in an accelerated fashion, while giving you feedback by the realistic results you can obtain from real life like trading.Gabe
But what do you think you should be doing while using the simulator on Ninja in order to improve you trading skills?
-
I would like to suggest that all questions be posted in the forum so that all of us can learn from the answers.Gabe
Here is a question I would have PM'd Thales:
How do you make screen time the most productive? It is often suggested that you need to spend a lot of time watching price but you can certainly do a lot of that and end up with very little learning occuring. Just curious of Thales' as well as everyone elses thoughts on this.
My own thoughts would be to that you need to try to guess at interpreting price movement and make a prediction/"anticipatory conjecture" of where it will move based on your interpretation. Then I suppose, you would evaluate how correct you are by watching price and if you were incorrect, you try to determine what you missed or chalk it up to random price movement (
)Let me know your thoughts.
-
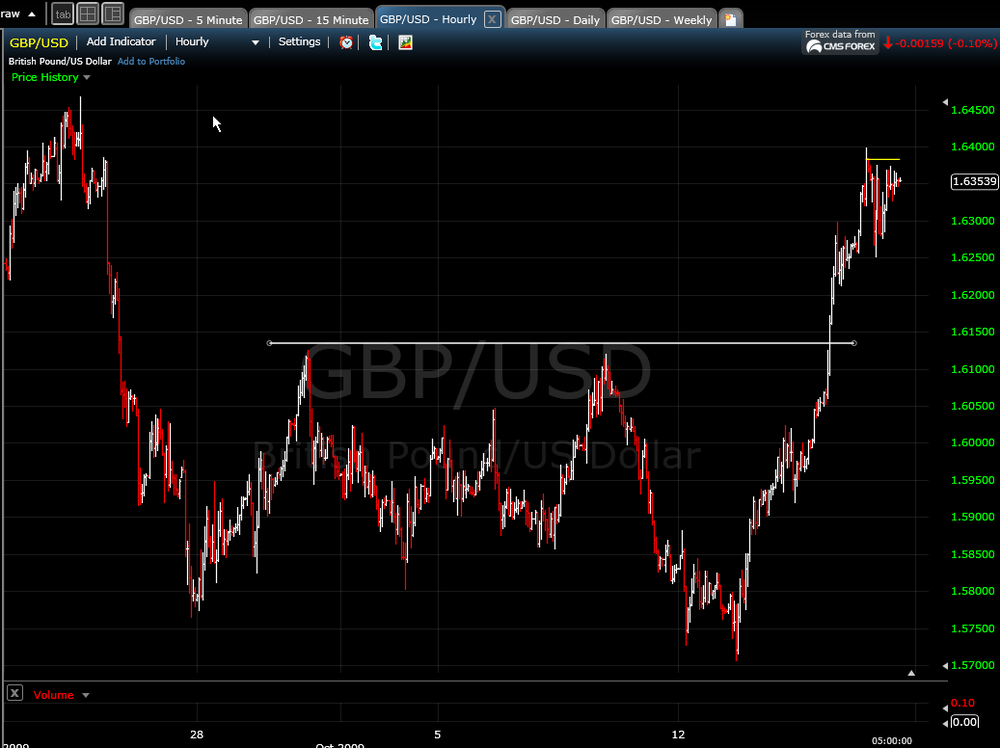
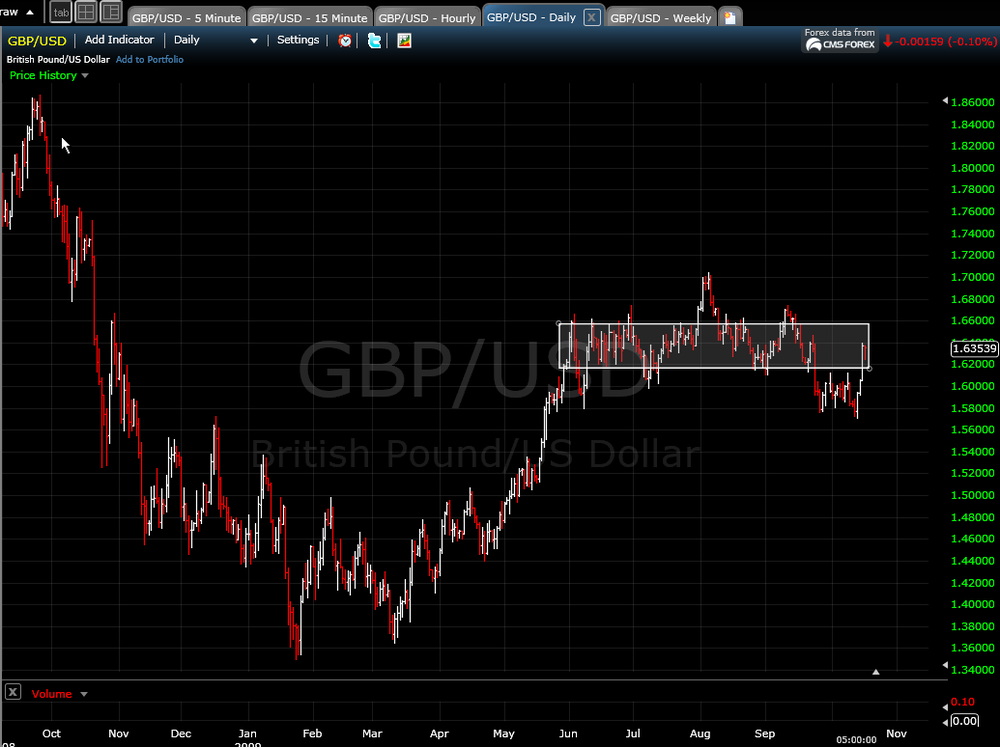
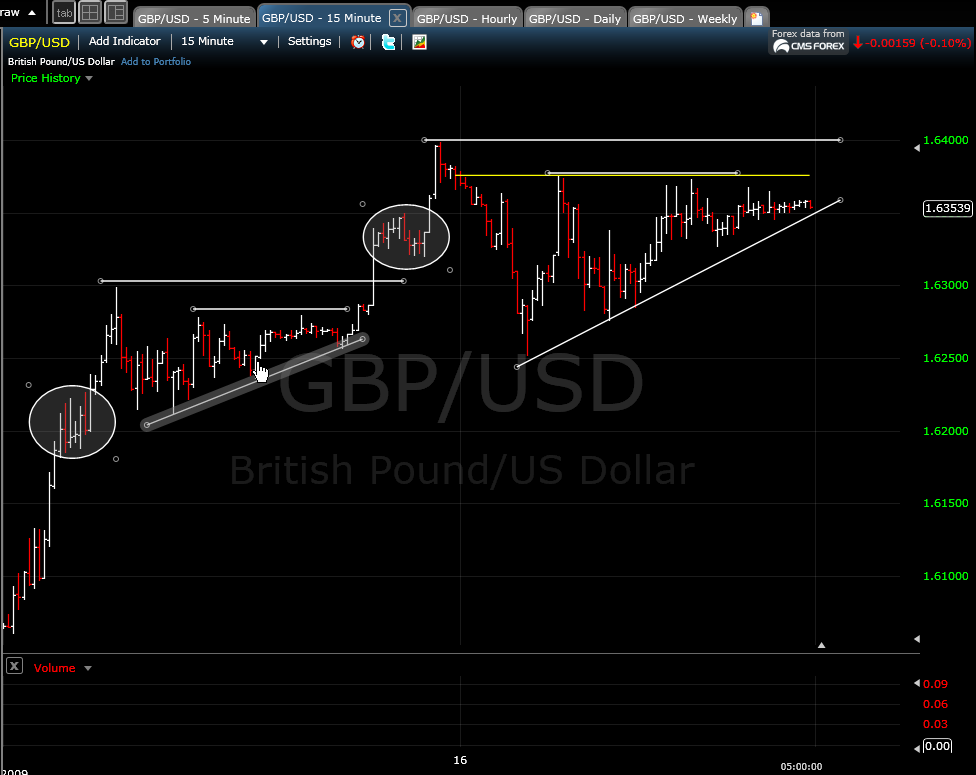
Looking at the GBP/USD in 3 different time charts - 15 min, hourly, daily
Just curious of your thoughts on trading opportunities after seeing these charts. Here are a couple of my own thoughts.
15 min chart
An interesting pattern recurring. It would seen like a breakout to the upside above the prior high would be reasonable. Maybe a trend line break to the down side would also be a reasonable trade considering how tight that trend has been lately.
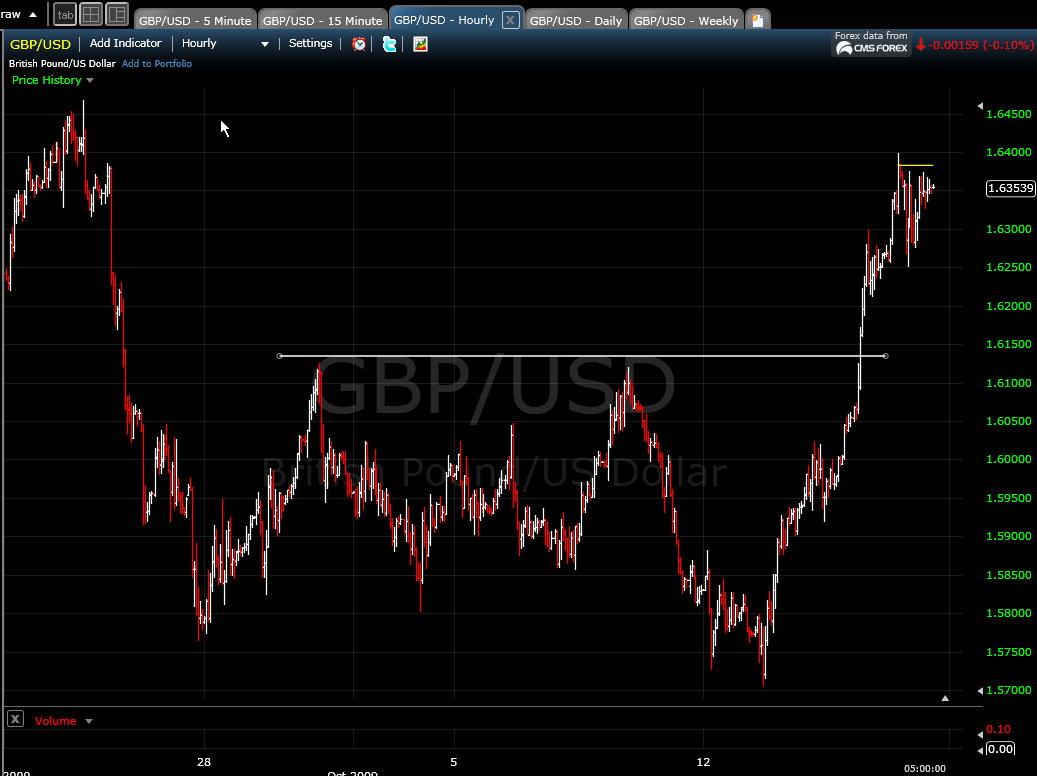
Hourly
We finally broke out of that trading range.
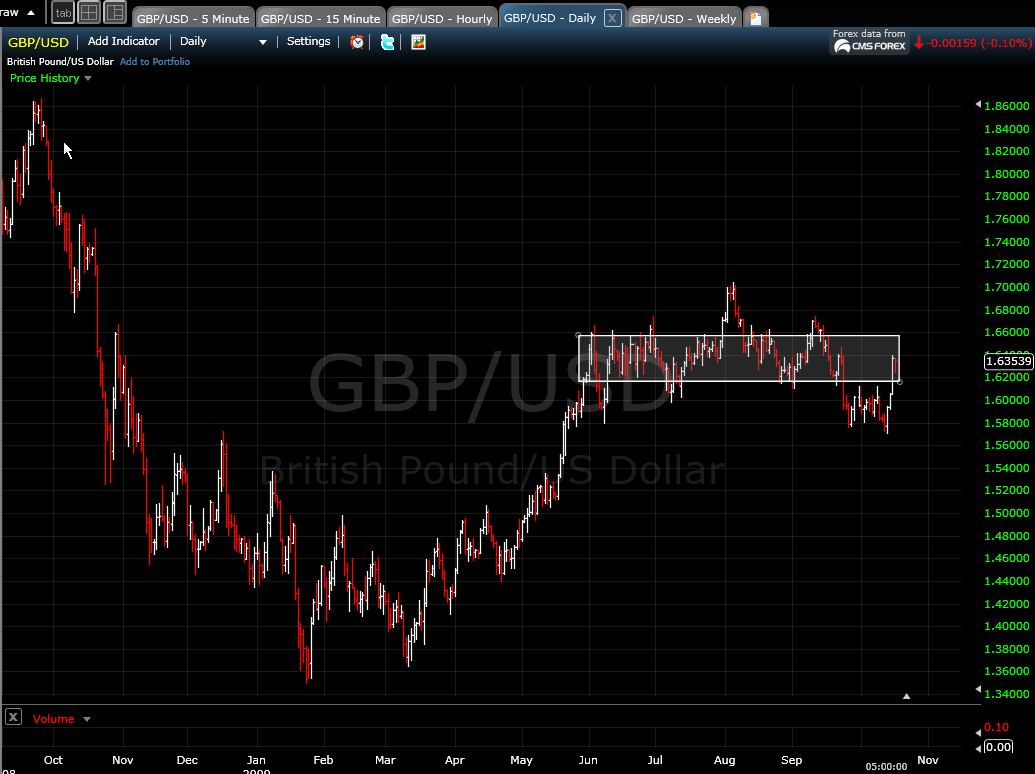
Daily
I am not sure if this is just too large a time scale to really give you much edge. Looking at it, I would interpret that we are back in the summer trading range which has a lot of reversals from S/R at either end of the range.


Reading Charts in Real Time
in General Trading
Posted
Here is the EURJPY on a daily chart. At this scale I am not sure how helpful it is unless you were going to take some long term positions. If a reversal starts to occur maybe it would be wise to start learning towards looking for breakouts to the downside.
If you can catch the right breakout downward you would possibly hold if for months if there is no retracement to your breakeven position. Whenever I see huge reversals from predictable S/R, I always wonder what it would be like to try to enter at some key reversal points and try to hold the position for a long term period. I'd like to experiement with some of those long term positions after I get these intraday setups making money.
Does anyone take longer positions based on these large scale charts?