
Welcome to the new Traders Laboratory! Please bear with us as we finish the migration over the next few days. If you find any issues, want to leave feedback, get in touch with us, or offer suggestions please post to the Support forum here.


Anonymous
-
Content Count
459 -
Joined
-
Last visited
-
Days Won
1
Posts posted by Anonymous
-
-
.I'm sure VSA does have some merit, but there are times, it seems, when the pros are dead flat wrong. See attached chart.You are soooooo wrong here.
We have Ultra High Volume on an up bar.
VSA teaches that the market does not like high volume upbars. Why? Because there could be HIDDEN selling within that bar. Note that the next bar is down. Why? Becuase there was supply dumped on the market. The Pros were selling not buying............
I do not mean to sound harsh. But it the basic premise of VSA that WEAKNESS comes in on up bars and STRENGTH comes in on down bars. Simply, if you were looking for more upside, then you, not the pros, were wrong.
P.s. Professional money is not professional money because it is never wrong........... It is professional money because it is BETTER at being wrong.
-
Ive been messing round with some VSA indicators. Sometimes I think they are helpful other times I think just plain charts with volume and nothing else may be the way to go. heres a snap I just took.Keep up the good work. Would love more of an explanation of what the dots mean. I know some can figure it out but for the newbies it would be nice.
Thanks for the chart. Please keep them coming.
-
yes correct, calling it smart money may be a little tricky, because maybe that super volume spike was the dumb and uninformed money that bought there...1. Okay, assume the High volume is the retail trader, or dumb money. Now the real questions is this: WHO IS SELLING TO THEM?
2. You do not want to "believe" in Professional money, fine. But Does there seem to be a group that is on the correct side of a trade more often than not? When volume is high at a top or bottom, somebody was doing the selling (at the top) and the buying (at the bottom).
VSA seeks to emulate the traders that tend to be on the right side more than on the wrong one. Yet, in the book, Master the Markets, Tom Williams clearly says that some professional are wrong more than they are right. What separates them from the masses is their ability to admit they are wrong and get out of a bad position. They do not hope the market will turn in their favor. They do not curse their indicators (and most don't use any) when they are wrong, the simply reverse their positions.
3. VSA contends that 85% of a volume histogram is professional money. This is the one thing that I call the "leap of faith". Either you believe or you do not. But once you do, that means ALL volume bars are 85% professional money, even the small ones during the none regular trading hours.
4. Most traders have some idea of what the Smart Money is. One does not have to be specifically talking about trading syndicates to find value in the VSA story.
-
Through the Looking Glass:
Beautiful chart to post on what one should be seeing when he/she looks at the market through the prism of Volume Spread Analysis and WRB analysis.
In my opinion every trader should have a "story". That is, a reason "why" price does what it does. "Why" certain players behave in certain ways. "How" the players are. "What" an overbought reading on the RSI means.
VSA has a story. I believe in that story.
Let's take a look at how the story placed out last week. This chart is from Friday before the Payroll report.
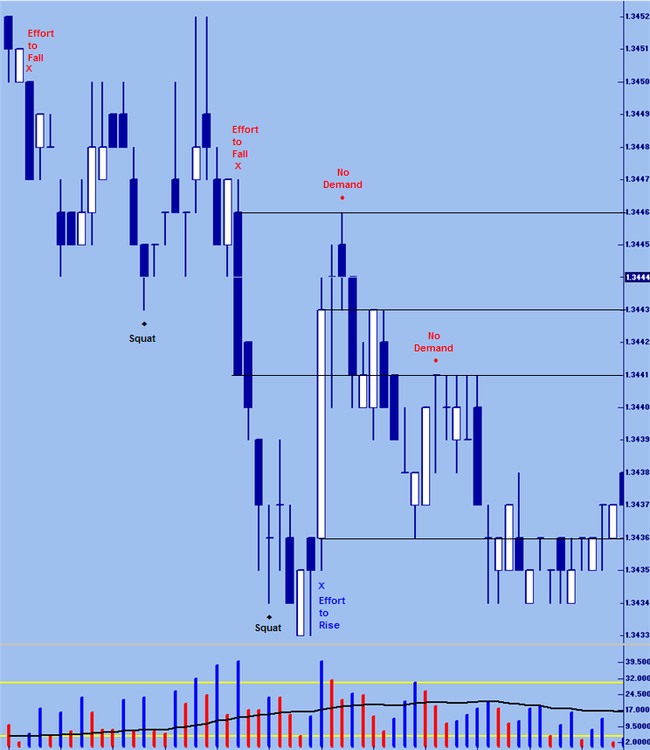
The first thing to see is an Effort to Fall bar on the left side of the chart. VSA's story tells us that effort represent professional money trying to move price either up or down. This bar is also a WRB. I have melded the concepts of effort from VSA with WRBs.
Now, WRB analysis tells us that a WRB represents a change/shift in supply/demand among other things. Therefore if there has been a shift in supply/demand it is to the downside-an effort to take the market lower would mean adding supply to the market.
Okay, we need on more thing. Professional money is not sitting around a large table in a smoke-filled room saying " Let's try and take price down on the retail trader in 10 minutes.......". No some Professional money will want to go long and some may want to go short at certain price levels. So we see the cumulative actions in price and volume. Of course, those professionals that went short (for example when price rises) also see what is going on and are usually quicker than the retail trader to 1. admit they are wrong 2. get out 3.get long.
Okay now let's skip to the squat bar. Bill Williams tells a good story about what this bar means. It is , however not quite correct. Our story is that the narrow range means that the market makers are keeping the spread narrow because they have a particular perception of value. In this case they are bullish. Hence they are willing to buy from the sellers entering. These traders thing they are getting a good price but fail to wonder why. Note what happened. Range narrowed, Volume increased on a bar that made a lower low and not a higher high (Selling Bar). However, this bar is not weakness rather strength. The market goes up.
Take a quick look at the first effort bar. We do not close above the High of this Effort to Fall bar. Simply, the high is being supported on a closing basis.
Let's skip to the first No Demand bar. This is an Ideal place to go short. It represents a low volume signal within the range of a High volume candle. Now think about the story. Supply/traders rushed in an attempt (effort) to take prices down. Price went down a bit but now has made its way back up. If volume is low that must mean one of two things:
1. All the traders that went short are still bearish. If they were not and their stops were being hit, volume should be high.
2. No rush of new bulls is taking place at this time.
Again, think about what an Effort bar means. Professional money came in at a certain area with some resolve to move price down. Low volume up bars in this area should therefore be bearish: the high volume represent a desire to move price one way, the low volume should show the opposite. That is, no desire.
Now let's move to the next No Demand bar. Another nice entry/add on point. Note that we again have low volume in the area of previously High volume. That high volume in fact, is on an Effort to rise candle. Same as an effort to fall, just in the opposite direction. The story changes slightly.
This time we see traders willing to step in and buy the market, which results in the Effort to rise bar. Yet, price moves down. THIS IS NO RESULT FROM EFFORT. So we see no result from the effort to rise, but are seeing result form the effort to fall. Then we get an Up bar on low volume (second No Demand). Volume on an up bar is falling. Those who wanted to take price higher have lost their resolve to do so.
Think about it. In this price area (range) bulls stepped in. But now in this same level they seem to be nowhere. This must be a bearish sign.
One quick note: we could also see Upthurst or Squats in the area of previously high volume. These two are usually higher volume themselves, but there is a logical and consistent story here too. This chart does not show them. It shows the low volume sign within the range of previously high volume. Moreover, that low volume sign is within the body of a WRB......
This post was in response to an PM, hope it helps.
-
You got it!I figured out that taking +2 and -1.5 on stops, I can have a 40% win rate (approx) and make money. Now, I'm not shooting for a 40% win rate, but it helps to break it down like that. If I can bat 60-75%, should be good in the long run by just simply taking out the position at +2.
I know, keep it simple, right? :p
B.F. I got to ask:
Why not do things as you were when you starting posting here? - Target 2pt and then, and only then, exit on the close of the first WRB that forms after this point.
-
........As I've mentioned a number of times here, in the end, it's all a giant mental game. And for me personally, not taking more out of a move that goes almost TWENTY ES pts in your favor is a battle that I cannot win. That's just me. Some guys won't bat an eye as long as they turned a profit, but I always push myself, esp in my trading business. I won't settle for 2-3 pts on a 20 pt move and be content. Again, it's not me.Just a few things:
* I believe in surrendering to the market, in following it. I believe in wanting what the market wants. A trailing stop therefore works for me.
* I believe one should never exit a trade with a profit. Let the market take you out. At some point it will move against you and take you out.
* Entries are therefore stressed more than exits. Exits are easy: move the stop until it gets hit. Never move the stop in the opposite direction of the trade. Use WRBs and VSA signs to move the stop in the direction of the trade.
* Under trade in both size and frequency. Here trailing a stop helps. You can stay in a trade longer and thus be forced to make fewer trades.
Now, let's talk about the real issue as I see it. If you are unwilling to trail your stop......
THE REAL QUESTION THUS BECOMES, WHY ARE YOU UNABLE TO GET BACK INTO THE MARKET AS IT CONTINUES TO TREND?
The failing is not in the fact that the WRB takes you out before the bulk of the move, the failing is that you have no way to re-enter the market. (note: this does lead to over-trading, but if we must exit, then we take this risk)
Don't throw out the baby with the bath water. Either except that some profit will be "left on the table", or be flexible enough to get back on a moving train.......
Your issues are not with WRBs they are with YOU. And in that you are NOT alone.
 The "should of', could of', would of' " game gets us all.
While your focus has been on exits, WRBs offers a wealth of information on trend, support/resistance/, volatility and supply and demand. This is of course, WHY they can be used as profit targets. They can work for you.
-
PP - ... As you said, some days WRBs work well, other days staying the trade longer is better, etc. etc. And especially after a day like yesterday where my initial long entry was nice and to extract a small portion of the move, that can bit you in the butt to say the least.Not quite what I said. What I was trying to convey is that if you choose A, there will most assuredly be times when B will seem like the better choice and vise versa.
successful traders accept this and move on.
Simply, you can not keep chasing exit methods based on the last trade.
Your first posts in this thread were raves about WRBs. What has changed? More over, do you believe the market has changed since then?
1) WRB does not appear when trade moves in your favor. You can patiently wait, but if nothing shows, nothing shows. There needs to be a plan B in place. And what that plan B is, I'm not sure.Again I have problems with this statement. There is always a WRB. It is the candle with the body (open to close) greater than the three (3) prior bodies.
If the three prior candles were dojis, then the next candle does not have to have much of a body, but it is a WRB nonetheless.
2) WRB takes you out prematurely. There are a variety of ways to work around this as well, but as you said PP, some days taking 3 WRB's will work, some days 2 and some days the first WRB is all that you can get... I've yet to find a good screener for when to take the first WRB and when to take more than one.Again, not what I said.
I keep saying that I like to trail. It takes all this doubt and consternation out of the equation.
If you want to choose based on the formation or location of the WRB whether to exit or trail, more work is involved. Just look at the above post.
As I believe in VSA, I would say you can look at the background but confine that background to what can be seen on the chart at that time. In other words, without regards to the WRBs two days ago. Assuming of course, you are trading a short time frame for day trading.
Where Mark and I agree :
1. What created the WRB-news event
2. Price action leading up the formation of the WRB.
3. Location of the WRB. Is it within the Support/Resistance zone of another Significant WRB. Here again, I would not be looking back as far as Mark might look.
4. Use of a higher timeframe. More of a move can be captured by increasing the timeframe and exiting based on the WRBs on this higher level.
Where we part:
1. Volume. Is there high volume but not Ultra high volume. You judge WRBs visually, certainly you can do the same with volume bars.
2. Tops to the left. If there are tops to the left, then a WRB thru this area may in fact be PUSHING THRU SUPPLY. If the pros are willing to absorb the supply at this level, then higher prices can be expected.
3. Effort candles show that the market wants to go one way or the other. The appearance of an effort candle which is also a WRB may signal continuation of the move and trend strength. So why exit?
Now look back at the 5 min chart you posted. Just seeing the action (Tops) to the left and knowing the volume would have been enough to know to stay in.
-
BrownsFan;
I think you are making a big mistake.
Forgive me, but I think you were on to something an now you are straying.
You should back up and ask yourself this:
"AM I A TRADER WHO WANTS TO EXIT AT AN OBJECTIVE OR BE STOPPED OUT?"
If you are going to exit at a target, then you must not say "look how much MORE the market moved in my direction if............"
You got out. Your trade is done. No time for regrets or coulda', woulda' or shoulda's.
If you do not want to learn to read price action to determine whether the WRB is an exit type or a continuation (trail stop) type, then simply exit and go to the next trade. I know that you have seen the value WRBs give. Why go back just becuase you don't want to "add on more layers of complexity"? Especially when the layers are due to the fact that you have not answered the above question fully in your own mind.
There are repeatable patterns in price action and volume or multiple timeframes or what ever to help you decide if you are going to exit or stay. Mark can comment on many of these.
Now if you want to take an easier approach, determine ahead of time if you are a trailing stop type of trader or a profit target trader. Choose one, stick with it and no regrets. And the most sure thing I can say; if you choose to trail you will find many examples where exiting at the WRB will make better sense, and if you choose to take profits, you will see many examples of the market continuing on way past your exit.
If it (trading) were easy, than eveyone would be doing it.
My friend, stick with the WRBs.
-
Different market, different day. But we can see the similarities.
Notice that the WRB that is pushing thru supply and constitutes effort to rise. This is the type of WRB that signals stay in the market, not exit as a profit target.
You can see the market has moved sideways.
A closer examination shows that there was a squat where supply came in. This supply moved the market sideways not down. There is an initial move down where we find No Supply. The low actually creates a floor. The move up signals a No Demand. The high is a bit lower than the high of the squat, but we see an area of upside resistance. That is, supply that the market is going to need to push thru to go higher.
Note that the squat is a buying bar, yet the bar is actually weak. Again, this is what the Smart Money wants. The retail trader thinks strength and calls the bar a buying bar. The Smart Money calls it a buying bar, but is talking about a positional relationship. And looks at volume, close and spread to determine strength or weakness.
The No Supply after the WRB is also a Selling bar (positional relationship: Lower low, equal or lower high and closes equal to down.) Here again, this bar is NOT weakness as the name would infer.
Of course, the WRB in question is also a Buying bar. This one is indeed strength, but one must understand volume, close, spread and see the old tops to the left to come to the conclusion of strength on this bar.
-
My friend B.F.;
You are asking a difficult task for me. I really have a hard time separating VSA from WRBs. More exactly, I have a hard time separating price bars with their corresponding volume histogram.
I can look for "effort to rise/fall bars" or Pushing thru supply situations. Both of these have VSA implications/interpretations.
Okay, let's define a specific bar type: Buying Bar. First, this is a moniker for a positional relationship between two bars. It is not an expression of demand dominance over supply on the bar.
A buying bars is a bar with a Higher high than the previous bar and a lower or equal low than the previous bar. And it also has a higher to equal close. So we are not talking about an outside bar or an inside bar.
Now, If a buying bar happens to also be a WRB we can take a closer look at it. If it also has a greater range than the previous bar and more volume than the previous bar with a close in the upper portion, that is higher than the previous bar, we have "Effort to rise". On the appearance of this type of WRB, I would want to remain in the market-trail the stop.
Think about the price action:
1. The high is higher than the previous bar.
2. The lower is not lower than the previous bar showing support and a resistance to lower prices.
3. The wide body shows positive demand pressure from the open to the close (effort).
4. Increased range shows an increased perception of value.- If the market makers were bearish, then they would keep the range narrow.
5. Bullish volume is increasing volume on up closes. Volume can not be too high, as it may mask selling pressure.
In truth, I am a trailing stop kind of guy. I want to surrender to the market and exiting on my terms is not surrendering. Letting the market take you out is. Now if you don't want to head in the direction above you need to use more than one timeframe. Here you would be looking at the price action on the higher timeframe to determine the strength of the overall market.
Take a look at one of my earlier posts. Maybe using the idea of placing your stop at the low of the WRB on one timeframe and then exiting on the appearance of a WRB on the next higher timeframe would allow you to do both get more of the move and exit prior to being stopped out.
Then again, I know you are looking to keep it simple. But what could be more simple than letting the market tell you when to get in and when to get out?
-
..........The gap down today gave another weak signal, but the last two hours changed the picture.First, thanks for posting. Please keep it up. The more interactive the thread the more we all gain.
Please take a look at that gap.
We had a gap lower on ultra high volume that closed in the middle. This is a sign of strength not weakness. If all the volume represented selling (weakness) than the close should not be in the middle of the range.
Strength enters on down bars and weakness enters on up bars..........
-
B.F.
Just a quick look at the first chart and my thoughts were:
1. I see old tops to the left. That WRB may be VSA: pushing thru supply. or Effort to rise. Not the type of WRB to exit on but rather trail the stop.
2. Chart is empty without volume.
More detailed post is on the way.
-
The essence of VSA is this:
Looking at Volume, which is activity, and the resulting effects this CHANGE in volume has on spreads and closing price (high, middle, low of bar).
Since volume is activity, tick volume can be used where actual volume is not available.
But take a look at his charts, the volume is constant as he is using tick charts. If there is no change in volume because it is held constant, it can not be VSA. The concept of Relative is essential. Today's period relative to the volume 1 bar prior or two bars prior.
Simply, It may have some value, but it is not VSA.
-
1) Under what conditions should a WRB be used to exit a trade?
2) Under what conditions should a WRB be used as a reason to stay in the current trade and not exit?
3) What is the backup plan when a WRB just does not appear, meanwhile the trade is moving in your direction?
Good questions B.F.
First I would say the answers are a bit tricky. Don't get me wrong, I say tricky because you use constant volume charts. But here are some things I look at:
1. I like the concept of "Effort to rise/fall" from VSA coupled with WRBs. If a WRB is an Effort candle, then I move the stop to just below/above the open of the body.
2. If the candle is very large and has Ultra High Volume and is not an effort to rise/fall or pushing thru supply candle, then one would look to exit. This has to do with possible supply (selling) entering the market.
As previously stated, I do not exit at the WRB I always trail. But if I did exit, this would be the type of WRB that would trigger an exit rather than a moving of my stop.
I know you use Constant Volume Candles so things are different for you. You would have to focus on things such as:
1. Overall Price Action: both in the market traded and related markets
2. different time frames (or in this case, different constant volume levels).
3. What created the WRB? If already in when the news event comes out, you might want to exit on the WRB (initial reaction to the news) rather than use a trailing stop.
Mark is truly the one to answer this question. I hope he will add is input. I would just stress that there is a way to both use a trail and an exit strategy with WRB that is both simple and consistent.
As far as WRBs not showing up. Again, I use the definition of an WRB as a candle with a body that is greater than the three (3) prior intervals. Hence it is possible to have an WRB that does not look large but meets the definition. Simply, it is rare to have no WRB for a sustained period of time. Also note that in an extreme case where there are no good WRBs (visual as you like), then a Wide Spread Candle (WSC) could be used.
-
A few months back a came across Mr. Williams first book Undeclared secerets and ever since I have been hooked on V.S.A. My first question is it necessary to read his more current book or is the original one good enough?
It is my understanding that the original book, has many mis-labeled charts and grammatical errors.
Master the Markets cleans up these errors. I do not know if there are additional concepts in the new book, but there is more of a Tradeguider (the software) emphasis.
My suggestion is to contact Gavin Holmes at TG and ask for the link to the PDF version of Master the Markets.
and yes, think about the bootcamp either way.
My question is this what are the objective ways that V.S.A. can help identify a bar as hidden supply?* On the bar itself:
1. Closing in the middle on Ultra High Volume is a good sign of supply within the Upbar. As is closing on the low.
2. If volume is too excessive, there is a good chance that supply is swamping demand.
*the real keys come in the next bar:
1. If we see Ultra High Volume on an Up bar that closes off its highs and the next bar is down. There must of been some selling (supply) in that first bar.
2. If the bar closes on its high but the next bar is down, again, some selling in the first bar.
3. If next bar is up, but the range narrows and the close is in the middle or low, there was selling (supply) in the first bar. Why else would this bar have a reluctance to go up? Reluctance is demonstrated by narrow range and middle to low close.
Also look for tops to the left. If price is trading into new ground, then there may be supply contained within the bar. IF, however, there are tops to the left, or places where supply previously entered, then the volume may mean the Smart Money is willing to absorb the supply.
Nice of you to join us. Keep posting and let's all learn together.
-
Pivot - nice chart. Here's what I see - if you are short somewhere into that nice down move, you had about 2 WRB's that gave really nice exits. .B.F., you have mentioned this time and time again: there can be some issues as to which WRB is a good exit. That is, sometimes the first one does not make the "best" target as the market continues in the trade direction.
This is one reason I like the trailing stop method.
Now, one can create a "blackjack" concept if one understands MORE FULLY the wealth of information entailed with WRBs.
Take another look at that previous chart.
The two WRBs that represent "Effort to Fall" are good places to move a stop, but not exit. After these two WRBs, there is another even larger one with ultra high volume, this becomes the one to exit the position on.
Simply, if the WRB is an "Effort to Fall/Rise" one moves the stop to just below/above the low/high of the body. If the WRB is not an "Effort" type of WRB, exit on close. It's simple. It's concise. It's repeatable.
Also, I have tried to stress that WRBs make for good profit targets because they are market generated. And as market generated information, there is a lot going on within them. So much in fact, that as mere exit targets is to belie their overall power and importance. Said power and importance is of course why they make good exits, but it is not their only use, nor their best one.
-
Primary methods:
1. Volume Spread Analysis
2. WRB & Long Shadow Analysis
We trade right by first looking left.
First we look at the higher time frame. Markets are fractal and the higher frame dominates the lower one.
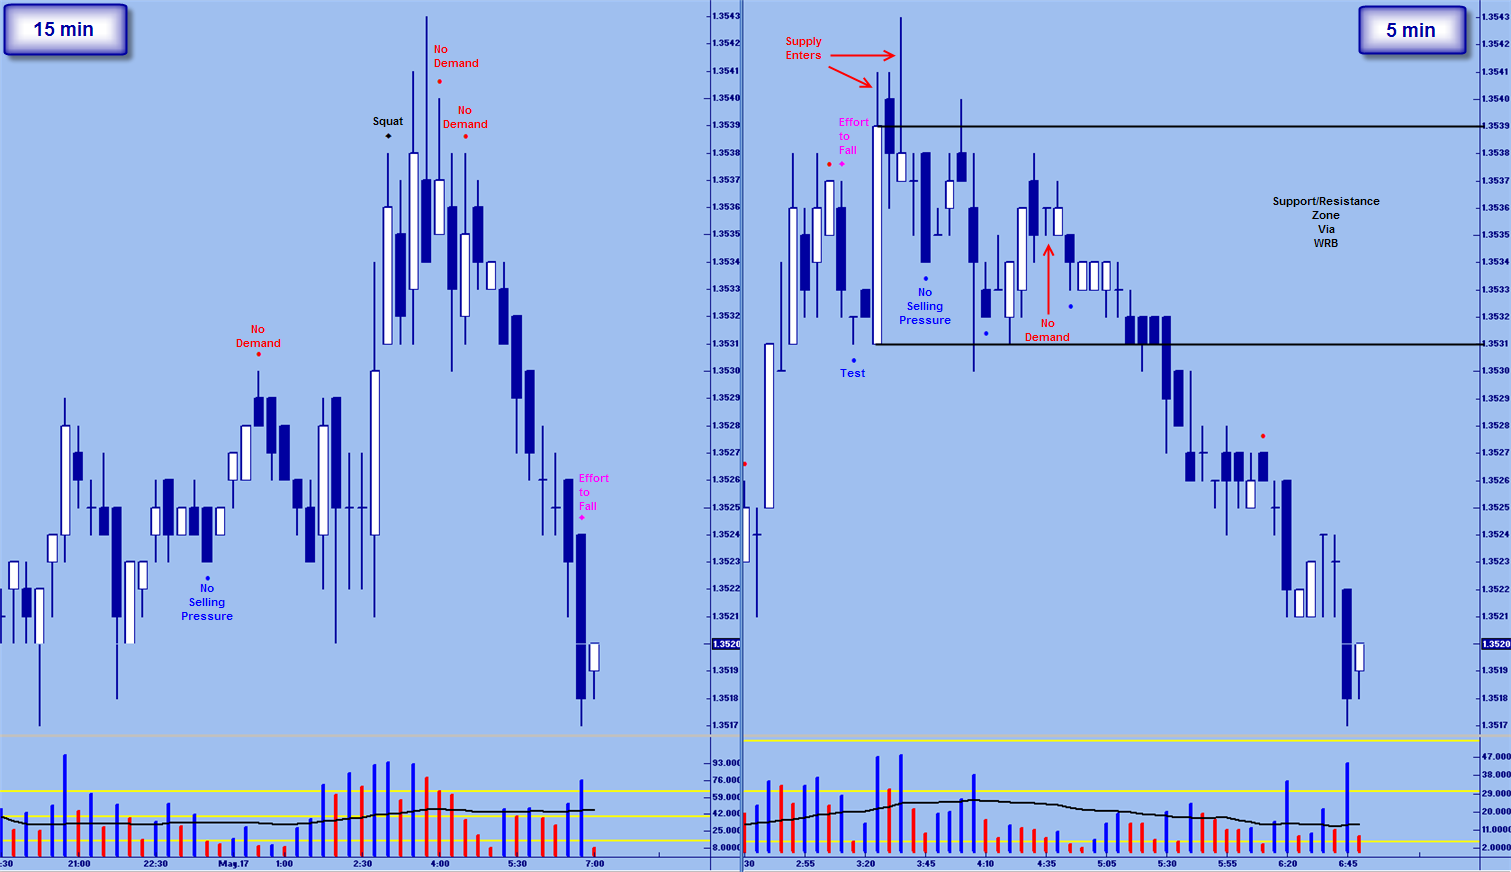
The 15 min chart . As previously stated, the start of the day should be at 0200 New York time according to Mark Fisher. This is when London trading begins.
Notice that we see a squat. A narrow range candle (narrower than previous candle) with volume greater than the previous bar. Supply is entering on this candle. At 0400 hrs we get a No Demand sign. At this point we have seen a squat and a dark inverted hammer with a Long Shadow. Supply is entering and volume is less on up candles.
At 0430 we see another No Demand sign. It is a good guess that there are no buyers in the market. If Professional money is not buying (supporting) then the path of least resistance is down.
Jump over to the 5 min.
The fist significant candle is the Effort to Fall candle just after the No Demand candle. Note that we see a test candle after this WRB, which is also an effort to fall candle. While the volume on the test is low, we have not seen strength on the 15. No reason to be looking to go long.
The next candle is up on Ultra High Volume. Markets do not like up bars on high to ultra high volume. Indeed, supply entered the market on this bar. But we now have our WRB that creates a Support/Resistance zone. This is where we would like to see an entry signal. Preferably a low volume signal where there was once high volume. Or a high volume (squat) or UpThrust.
AT 0435 we see a narrow range bar that closes up on volume less than the previous two bars. This is No Demand. We have seen Weakness on the 15 min chart and now we are getting No Demand on the 5 min. Even though there is no "vsa indicator" we are reading the candles and see our entry.
We note that this No Demand is both within the body of the large white WRB and within the body of the Effort to Fall candle. If the Smart money was trying to push prices down around this area (range), then it is a good sign (of weakness) to see little volume on a candle in the opposite direction within that range.
Hope this helps.

-
1.that squat (hammer to me) does it need to inside the body of the preceding candle and does the colour matter?
No. There are may way for it to appear. Ideally, you would like for it to be a bar that makes a higher high but not a lower low. Some call this a buying bar. The opposite would be a selling bar. There are some posts on this. If you need more just ask.
2.does the colour of the volume bars matter?
Blue bars mean higher volume than previous bar. Red means less than or equal to previous volume bar.
3on the second chart,the candle following the WRB (spinning top)would give the game away,not sure if it was you who said its "change of ownership bar".
5 bit confused about the no demand bar as its not got much of a tail,would not the upthrust bar be more of "no demand"?
thats enough for now,you,ll be pleased to learn i,m getting there,well i thought so!say nothing.
Can't make out questions 3 or 4. As for 5, UpThrusts come in two forms: 1. higher volume "upthrusts" and 2. Lower volume "No Demand".
The key is that price trades up and then closes on or near the low of the candle. Also No Demand does not need a tail at all. Note that the range is less than the previous bar. The volume is less than the 2 previous volume bars and while the close is equal, a higher high was made. Also note that the next bar was down and did not make a higher high.
The base definition for No Demand is a bar that has a narrower range than the previous bar, closes equal to up and has volume less than the previous 2 bars.
-
Just found this a bit interesting.
First, there is a chart in the VSA thread that shows an entry set up into this market much earlier. This is later in the move to be sure, but none the less telling.
Check out the chart below.
There are two candles that constitute Effort to Fall. Effort to Fall means that the Smart Money wants to take prices down. They are interested in falling prices. As it happens, these two candles are also WRBs. WRB represent possible changes/shifts in supply and demand.
Notice that within the shaded area we have white hammer line. The next candle closes up, but on volume less than the previous two candles. And on a very narrow range. Plus, the volume is less than average. Simply, it is No Demand.
Now the interesting thing happens on the dark inverted hammer line.
Many people will say that the shadow on a candle means price rejection.
Take a look at it here. Note that the Long Shadow is as high as the high of the first WRB (effort to fall candle). In other words, price moved into an area of weakness (downside strength) and was rejected. Also note that the second WRB also covers a good deal of the Long Shadows depth.
If you were thinking the move is over, there is evidence to the contrary.
Kinda' cool how that worked out.
-
First:This is not a picture of the futures, but the spot.
Second:
1pip = 10 dollars
10=100
5*10=500 (5 contracts)
10*10=1000 (10 contracts)
You want more money, trade more contracts. I am not calling you a losing trader, but that is a losing trader's mentality. A trader could be set for life if he could make 10 pips (net) a day every day. Not all trades need to be 150 pips. Greed may be good but it gets traders into trouble.
Third:
If you believe that an Upthrust is created by professional money, then you can not turn around and say that it is just happenstance. That is, if you believe that bars are manipulated by the smart money when the day session is going, you can not turn around and say just because the day session ended that same bar is somehow not manipulated. Simply, an Upthrust is always an Upthrust.
Four:
I have stated the time of day to trade many times before. I do not feel the need to post them in every post. Moreover, this is a post about reading the chart.
forgot five:
This is, in my opinion, the only real "leap of faith" required by VSA. VSA states that 80-85% of a volume histogram bar represents Professional Money. Or Professional activity. Hence if 100 contracts are traded, 80-85 are Smart Money (To be sure this is not how that info is to be used). If 1000 contracts traded, 800-850 is Professional money. If 10 then 8-8.5 are professional money. In short, Professional money IS ALWAYS ACTIVE. As long as there is a histogram bar, there is Professional activity present.
Now that does not mean all times are idea for the retail trader or all volume levels are ideal. It does mean they, the smart money, are there none the less.
-
..... I have done some testing and found that by counting the number of bullish WRBs compared to bearish WRBs you have a pretty good trend/bias filter. Spark any ideas?Nice to have a new voice with us. Welcome. Thanks for posting.
One question: how do you determine a Bullish WRB from a Bearish one?
I have attached a chart that has a number of white (close>open) WRBs. But of the 4 shown (there are more), 2 are actually bearish in nature.
The first WRB on the left hand side has ultra high volume and supply entered the market on that candle. Hence I would say this is a bearish WRB.
The Next WRB is the best of all. While it is not large, it does engulf the previous candle and is Effort to Rise (VSA). In fact, a valid Engulfing pattern is formed. With this engulfing WRB within the body of the larger WRB, there would be a signal to get long.
The Next WRB is Large with Ultra High Volume as well. But this time, the market is pushing thru supply, hence the high volume. Where the first WRB was bearish because of high volume, this one is bullish because of high volume. Smart Money is willing to absorb the supply here, hence the high volume. If the Smart Money is willing to buy at higher prices, they must be expecting even higher prices.
The final WRB shown is another large white WRB. Here we do have Effort to Rise as seen in volume and close. But this time we end up with No result from an Effort to Rise. This is bearish. In fact, what can not be seen is a No Demand signal that comes within the body of this WRB which could of signaled a short trade after seeing the weakness of no results from an effort to rise.
So, I ask again, How are you determining the nature of the WRB? I hope you are using more than just open vs. close.
-
How much more do you need?
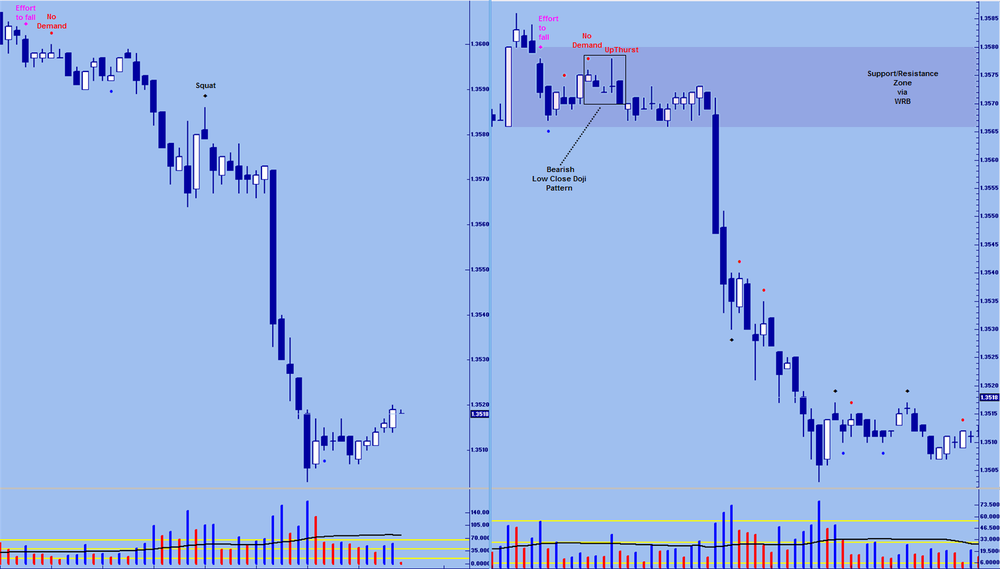
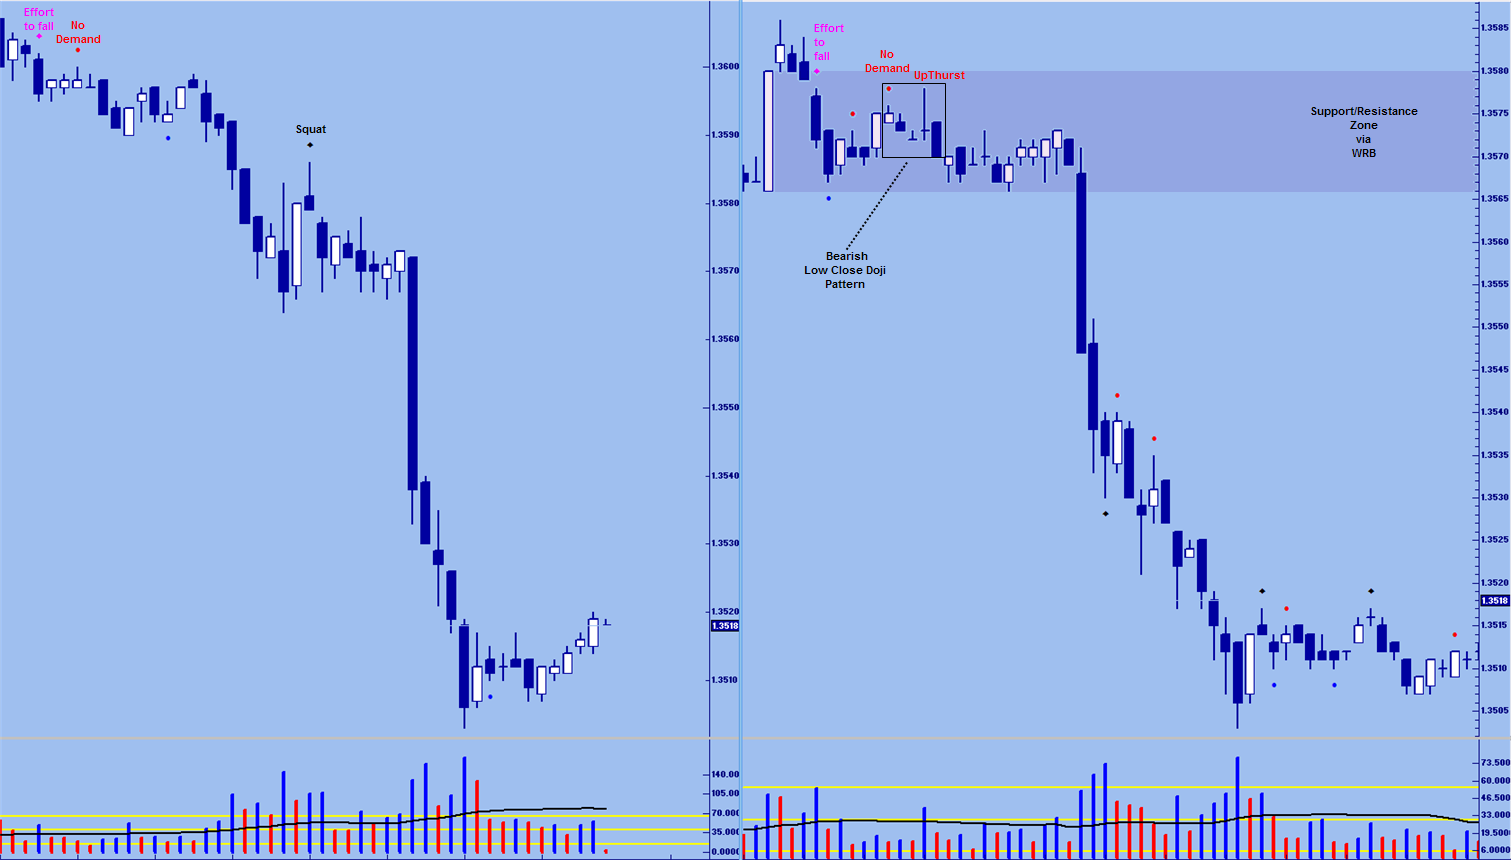
Wow. Here is an example of a great short trade that was signaled in more than one way.
As this thread is VSA, I will not say much about the Low Close Doji pattern, but it too signals a short entry. I would say that the pattern happens where we would want it to be: within the range of a WRB.
Fist let's start with the 15 min. Notice the Effort to fall sign followed by a No Demand. See how the No Demand is within the range of the Effort candle. This is a sign of weakness.
Next, we see a narrow range bar with increased volume: a squat.
At this time we now have seen supply enter the market and some downwards price action that will make us predisposed to be short on the trading chart.
The trading chart.
First Note the large white WRB. This sets-up the support/resistance zone. As I must apparently repeat things, we want to see something happen within the range of this candle.
Price trades higher after that white WRB on high volume, but the range of the bar narrows, so we know that there was some supply (selling) in the high volume WRB.
Now the key bar. A dark WRB (although smaller than the white WRB) appears. WRB: body greater than the three (3) prior intervals. This WRB happens to be "effort to fall". In other words, the Smart Money wants to take prices down.
Note that we then get a No Demand bar within the range of this dark WRB and within the range of the large White WRB. Time to get short. Upside weakness where the market previous showed downside strength.
If you missed that, There is a doji that also happens to be an Upthrust 3 bars later. Get short. Weakness in the background and an UpThrust a classic short signal. Did I mention that the Upthrust is within the body of the WRB? (well, the one's I favor would usually be
)
-
Do you really think Professional Money is active in the Euro futures market when it's 2200 New York time and 0300 in the morning London time? A 10 pip move is nothing. It looks more like the natural ebbs and flows of a sleeping market.First:
This is not a picture of the futures, but the spot.
Second:
1pip = 10 dollars
10=100
5*10=500 (5 contracts)
10*10=1000 (10 contracts)
You want more money, trade more contracts. I am not calling you a losing trader, but that is a losing trader's mentality. A trader could be set for life if he could make 10 pips (net) a day every day. Not all trades need to be 150 pips. Greed may be good but it gets traders into trouble.
Third:
If you believe that an Upthrust is created by professional money, then you can not turn around and say that it is just happenstance. That is, if you believe that bars are manipulated by the smart money when the day session is going, you can not turn around and say just because the day session ended that same bar is somehow not manipulated. Simply, an Upthrust is always an Upthrust.
Four:
I have stated the time of day to trade many times before. I do not feel the need to post them in every post. Moreover, this is a post about reading the chart.
-
(As I am not the thread starter, I have no compulsion to keep the thread alive. With the lack of interaction, my posts and enthusiasm have dried up. Which is why this one sucks.............)
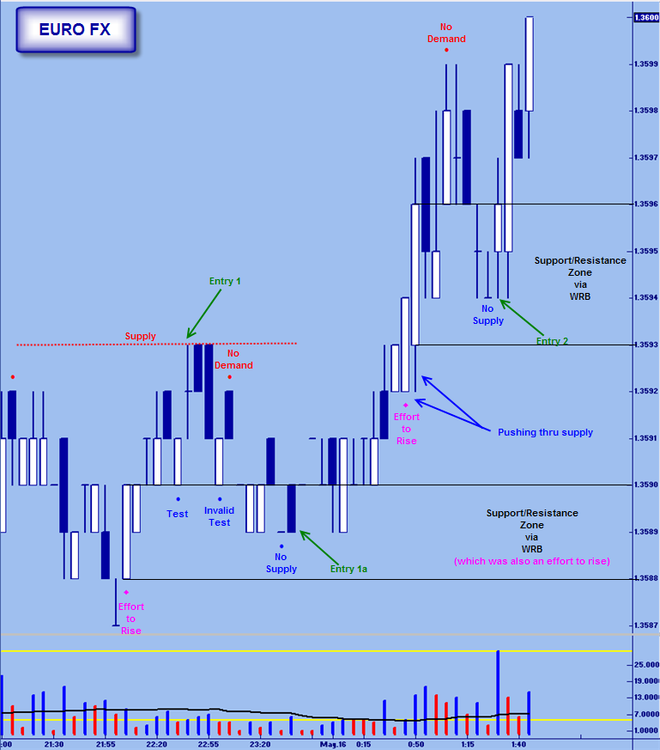
Cool Chart here.
The first key is what is not shown: 15 min chart. From there we see that price is moving is a sideways channel from a down trend. Said channel may be accumulation or distribution.. only time will tell.
At 2200 hrs New York time we get a No supply bar on the 15. This bar is confirmed by an up bar at 2215.
Now let's look at the trading chart, the 5 min:
The first thing we see is a white WRB that constitutes effort to rise at 2205. Things get a bit tricky next. Entry 1 is a test. The bar closes on its high has volume less than the previous two bars, closes equal to the previous bar and is confirmed on the next bar. This is a low volume test that happens to be within the range of a Long Shadow (not shown) and at 2240 hrs. We know that there is No Supply on the larger timeframe and we now know there is no supply (based on a valid low volume test) on the 5 min. One could of entered here.
Depending on where you placed your stop, you could still be in or taken out as price moved down. Entry 1a is labeled as such, because once the WRB was formed and you saw that it was also "effort to rise", you could of opted to look for something to happen within the range of this candle rather than the Long Shadow. Note also that the volume on the long shadow candle was not that high. And since neither high volume nor news events created it, it might be missed.
No matter, consider 1a as a second chance entry. You were either stopped out, missed the test bar or choose to ignore the test bar. Notice how the market gives us a No Supply bar within the range of the WRB (see any previous post
).Before we get to Entry 2 we see Professional Money push thru supply. This is the channel area mentioned before. On the 5 we get another white WRB that represents effort to rise. It is followed by a larger white WRB which sets up the support and resistance zone where Entry 2 is signaled after the appearance of No Supply. Entry 2 is really more like add-on 1, but if you did not want to take a trade within the sideways channel then this would be your entry (this could also be a reason not to take entry 1 and 1a).

[VSA] Volume Spread Analysis Part I
in Volume Spread Analysis
Posted
First, I did not mention that it is nice to have you on board. Nice chart set up you have there. Please keep the chart examples and posts coming.
Now for the meat.
As I have mentioned, I do find the 85% idea as the only real "Leap of faith".
Now, let's look at you nice chart again. I do not know if that large volume spike candle was made due to a news event. VSA asserts that professional money uses news events to manipulate price and market direction. Suppose that there was a news event that was "bullish", well the professional buying was on the left side of the chart. The professionals would be buying at wholesale, and the large volume spike would be the bar that they sold on. They would be selling at retail. On that news event, the herd would rush in and be bullish.
So in truth, the volume surge is more likely to be the herd. The question, as always, is WHO IS ON THE OTHER SIDE OF THE TRADE?
If there was more buying on this bar than selling, then the next bar should not be down. More over, the bar after that is a Hidden Upthrust/Trap UP Move. This is a manipulated bar designed to get traders long and is a good place to short (with the weakness seen in the background).
Basically, you have to get away from the idea that large volume on an up bar is inherently bullish. You need to look at:
1. the range of the bar (spread)
2. the close of the bar
3. What happens on the next bar and sometimes even the bar after that.
Also note that there are no old tops to the left that can be seen on your chart. This is more reason to assume that the high volume is masking selling, rather than actual buying by the Smart Money.
Remember, we (VSAers) are not saying that professional money is sitting in a smoke-filled room conspiring together. We see the composite of their actions thru volume and price. So in practical terms, it is possible that some Smart money trader did indeed buy on that bar , if that makes you feel better.
One more thing:
The retail trader is now wondering if there is something to the adage: "buy the rumor and sell the fact". The Smart Money bought the fact ( while it was rumor to most) and sold the fact when it was widely known.
But this may not of even be due to a news event as I do not know exactly when this chart pic was taken.