
Welcome to the new Traders Laboratory! Please bear with us as we finish the migration over the next few days. If you find any issues, want to leave feedback, get in touch with us, or offer suggestions please post to the Support forum here.


Anonymous
-
Content Count
459 -
Joined
-
Last visited
-
Days Won
1
Posts posted by Anonymous
-
-
JJ;
You chart tells me you have a grasp of some of the VSA concepts but lack a trading plan. That is not VSA's fault but yours.
You could only take signs of strength or weakness around certain Market Profile areas. You could take signs that occur on one timeframe and are simultaneously occurring on a higher timeframe. You could take signs that happen in conjunction with moving average crossovers.
In the book, Master the Markets, Tom Williams does give some ideas for entries. He talks about waiting for a down bar after a sign of strength. I would point out that after the first Sign of Strength, I would at least like to see either a Test or No Supply to use as entry. Ideally the test would be on a down bar, which would be consistent with Tom's view of entering long on down bars. (although I would wait for the confirmation which would be up). As the father of VSA, he doesn't need to wait for confirmation.
The question thus comes down to, Why would you enter after the first sign of strength?
Posting real-time charts without first having a trading plan wont answer that.
-
First the legal stuff: If this post is ever used in an SEC investigation, I, as writer of this post have no personal knowledge of the thread starter or the company involved. I offer a strategy based on a hypothetical presented in the first post.
No, I kid. Or do I?
Sounds fishy to me. But if your premise is true, why not just sell the stock short? With options there would be the issue of time decay and Volatility. I am not an options guy, so I could be wrong here. But in a sure thing situation that you present I would think the most bang for your buck is to just sell at the current market price and watch the price go down 3 dollars. Along the ride down, add to the position. Normally, I would not recommend adding on by more than the original buy, but rather reverse pyramiding- adding on be less and less each time you add on. Yet, since this is such a SURE THING (unlike everything else in the market
 ) just keep adding on by as much as you can.
 -
Correction jjthetrader, Reading VSA is not easy in realtime either i.e as a signal to go long or short, It is only easy to read them and justify them once next few bars are in view and even then you end up with a successful test or a failed test Nice fancy term , failed test but did you know that at the time:crap:Could it be that it is the application of VSA, bid/ask, up/down vol etc in realtime trading be the reason for the paucity/reluctance to post realtime trades
 It was the same on T2W and Elitetrader.
Could somebody answer me this? If a trade set-up is occurring in real time, how does one:
1. place an order
2. place a stop (always use stops)
3. begin to monitor position
4. take a snap shot (screen shot that shows the trade as the most right bar on the chart)
5. Makes comments on the chart
6. Posts the chart in the thread
I am much more concerned with the first three.... Nobody on this thread pays my bills.
-
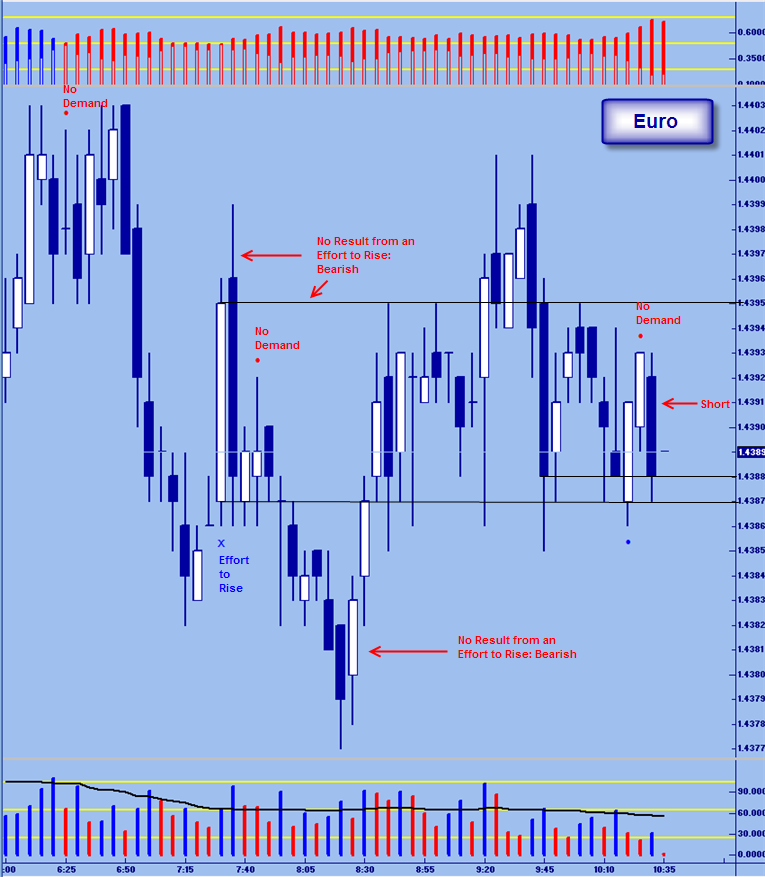
Short trade signal in murky market.
I think the overall market here is in a distribution phase, preparing for another "wave" down. The 15 min chart (not shown) certainly looks like price is moving sideways which is the hallmark of a distribution or accumulation period.
Some things of note on this chart.
1. The No Demand on the left that represented a change in the market.
2. We get an Effort to Rise candle, but we do not get any result from it. Note that the very next candle makes a higher high, but closes lower. Then 2 candles later, we get a No Demand which is also a buying bar. Volume is low so this is a weak bar despite making a higher high.
3. The No Demand which signals the trade happens to be within the bodies of two WRBs. The most recent dark WRB and the WRB formed by the Effort to Rise candle.

-
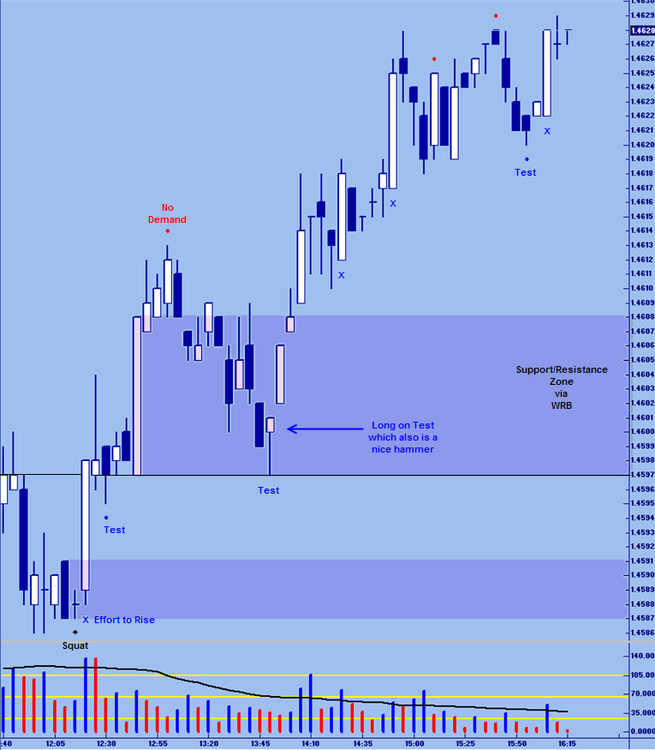
This chart has a lot on it.
1. For the canlde crew we see a valid Dark (Open>Close) hammer pattern as per Mark. I have added three (3) Profit Targets using WRBs. This is not my prefered method but I know some use this type, so I placed some on here. Remember, Mark would be exiting as the candle becomes a WRB which is why PT3 is on what is not a WRB at the end of the period.
2. For the VSAers: First, we see demand enter on a down candle with Ultra High Volume candle with the close in the upper portion and the next bar up. This is the Dark Hammer of our Valid hammer pattern and We call this Stopping Volume. The next bar forms a WRB and the bar after that gives us a No Supply within the body of a WRB.....
-
Hi BF! Its great to be talking WRBs with you again. I known this is not the WRB thread, but if you're okay with it- I am game.
First, you missed one. Check out the large white candle just prior to the Test candle. That's a WRB. Quick definition for those reading this, a Wide Range Body is one where the body (open to close) is greater than the prior three (3) bodies. Therefor 4 candles are involved. One can choose more candles like 4 or 6, but 3 seems to work best and three (3) is the least ammount one should use. Also note that it appears that BF has highlighted the candles next to along with the WRB itself.
Now, based on what I have been saying in the VSA thread, there are only two trade set-ups. What this chart does not show is a No Supply that forms within the shadow of the Long Shadow of the hammer line. Hence, for me, most of the WRBs are going to be ignored as no VSA signs are within their bodies. As already pointed out, the No Demand on top of the S/R zone was confirmed by action on a higher timeframe. This is not the case with the Test candle, so despite the fact that we get a beautiful Test (hammer) within the range of a WRB, it is not taken.
On what makes one WRB more significant than another.
1. Volume associated with WRB. The more volume the more significant.
2. Size ( sorry, guys but size does matter here too).
3. Was the WRB created on a news related event? A WRB created on the release of the jobs report is more significant than a WRB created 2 hours later over the lunchtime for example.
4. Location. A WRB that forms at an old high is more significant than on that appears where there are no obvious areas of support or resistance.
-
I know my posts here will be unwelcome but here is a great example of a dark hammer pattern.
I think many people think lower timeframes are not good for candle patterns, but the problem is not timeframe it's the patterns themselves. The pattern that can be found on typical internet candle sites are simply not that reliable, regardless of timeframe. One needs to understand the underlying PRICE ACTION that creates the pattern.
While this is not a VSA thread, I would point out the Demand entering the market as the hammer pattern is being formed. Those who follow the VSA thread might notice the valid short at the No Demand on the top of the chart. This short was validate by weakness on the 15 min timeframe as well (this is a 5 min chart).
-
Jaybird,
Yes and no.
Strength comes in on down bars and weakness comes in on up bars. You correctly picked up that the bar had demand (strength) despite the lower close. However, the fact that the volume is greater than the previous two bars matters little. That is to say, with a No Demand bar volume less than the previous two bars is part of the definition. That is not the case when defining high volume. Of course we do look at volume relatively but every volume bar that is greater than the previous two isn't automatically high volume.
I would still like to see either a Test or No Supply bar after. Or I would like some sort of strength on another timeframe.
Having said that if this was an known news release like the up jobs report, you could simply wait to see if the next bar was up.
With respect to wether the data is correct, it doesn't matter in that you have trade what you see.....
-
PIvot, can I ask you about your analysis in post 1104 - after the initial effort to rise bar (straight after the first squat) there is a high volume bar that is basically a gravestone doji (easiest way to describe it - I know the open and close are not at the same price but only one pt apart makes it close enough for me). What are your thoughts on this bar - it would have had me looking for a down move follow through in the immediately following bars (which didn't come). If I could get your feedback on this question would be appreciated as this bar really "stuck out" for me.Notice that this next bar makes a higher high but closes equal to the previous bar. The volume is about the same as the previous bar and High. And the close is near the lower portion of the bar. This is a Hidden UP Thrust (although we would like to see an even lower close in the range). The key here, however, is where we have just come from. That is, there are signs of strength in the background. With an UpThrust we want to see weakness in the background.
The very next bar is key here too. We see a pattern that appears many times. The bar after the UpThrust is a Test. This is a sign of Strength, not weakness. The Smart money creates an UpThrust, but test for supply on the very next bar. That means that the supply was swamped by demand on that UpThrust.
Lastly, I would note that the candle fails to close below that black line and is closing up from the open which was on the black line.
For me, After the Squat and the Effort to Rise bar there is reason to be bullish, not bearish. Hence I dismiss the Hidden Upthrust on first sight. But one bar later I get a Test. This Test in and of itself is bullish. But if it is coupled with the UpThrust it is even more bullish. As for the rest of my thinking, it is in the post.
One more note: a lot of people are missing the fact that if you wait for confirmation things make sense. On an Upthrust you want the next bar to close lower than the close and preferably lower than the low of the UpThrust (remember in a perfect UpThrust the close is on the low). The profit lost by not being in "early" or "at the beginning" is more than made up for by those times when early entry results in losing trades. Losses that could of been avoided with patience. Patience is a virtue and a trader's best friend.
-
Taz et all,Look at this bar on ESH8. The Ask volume is almost double the Bid volume and the bar is a down bar and closes off the low. What do yo make of it?
Also looking forward to Sebastian's recap of the day. Sebastian, maybe you can touch on this bar in your analysis.
Regards,
Bert
My 2 cents. When I first looked at the chart two things entered my mind:
1. Bad data quote
2. Was there some news event at this time?
I do not know if either of the two are indeed behind the candle. So I assume the candle and volume are correct and go from there.

-
Would you short this upthrust ? If not or if so, why?We should not be looking at signs in a vacuum.
What the background says is important. I do not agree with your interpretation of the chart. I see much strength and would be looking to go long, not short. Hence my answer to your question is no.
Take a look at the highest volume bar on the chart. This is a down bar with the next bar slightly up. Demand entered on this bar. Also note that the market begins to move sideways a bit.
The Trap Up move you labeled, to me is No result from High Volume (strength in this case as the high volume bar was down.) The bar is down on high volume and a wide spread but the next bar is up. Thus showing no result from all that volume on the down bar.
What I would like to see is a higher timeframe to aid in my decision making. To be clear, I would not short this bar but I would not be going long here either. In fact, for me, If that large bar is a WRB and then we get a No Supply or Test within the range of the body it would be a go.
-
So many post I want to reply to-looks like a long weekend. Of course, by Sunday this thread might have 5 more pages of brillance to wade thru. LOL
I love it!! Now this thread is a dream come true.
The first couple of posts be Sebastain have a link to open the charts by clicking on the post itself. Can we get that option back? I do not want to be downloading more software and registering at more sites to get the analysis. Sebastain, please include that "m".
-
JJ:
Very nice. I can not say this enough- Every one here is top notch. Thanks for sharing and caring as we walk this journey together. The market may be zero sum, but we are clearly made stronger by our numbers.
P.S. Is there a Metastock version in the works?
-
"For the haters"
Most people here are not haters but some who read this forum are. That's okay, the market is full of abundance and not every will find the same path to that abundance. Every now and then, however, the market does something that really reassures the VSAer of the validity of Volume Spread Analysis. Paradoxically, of course, being valid and working are not necessarily one in the same. But when one has something that is both valid and works then one can trade any market or any timeframe........
The following chart, shows me one reason why I must believe that VSA not only works but speaks to a fundamental truth of how markets work.
First notice the black line that I have drawn on the chart. This is really a key "line in the sand" area to certain market participants. Note I have no idea why and really don't care, but it is important as the chart itself tells us.
If we start with the first Effort to Rise bar on the left side. Note that this candle closes ABOVE the black line. Now let's back up for just a second. To get past this line (area) more volume (demand) is applied. In other words, to get past an area of support/resistance we can expect to see more volume. Which we generally can call effort. So the market has closed above this line on higher volume just after we saw a Squat which was in the body of a WRB. Note that there is no closes below this line after the Effort to Rise candle.
Which brings us to the next telling candle. 2 candles later we get a down candle. This candle trades lower (makes a lower low), closes lower than the previous candle and closes in the middle of its range on volume less than the previous 2 candles. In short, it is a Test. Again, where is the close? On the line. Where was the test for supply? Below the black line. So the 2 candles after the Effort candle, trade slightly below the black line, but the line holds on a closing basis. Of those two candles, the second one is a Test. At this point no other candle trades below this line. We do not know this yet, however.
We then get a white (open>close) WRB. This candle opens on the black line and is immediately repelled upwards away from the black line and where the previous Test found no supply. We know what WRBs represent changes in the supply/demand dynamics in the market. This is a significant WRB. I have previously stated what makes some WRB more significant than others, so I will not restate here, but one reason is size. What I now would like to see is a No Supply, Test, or Squat within the body of this WRB. We get that. Upon closer look, what do we see? This Test trades down to the black line but not below. Thus the previous test, tested for supply below the line and this next test only test to the line. But this makes sense. The first Test found no supply underneath the line and closed on the line. So the next Test should really only need to go as low as the line. Not to mention that this is where the WRB begins. And WRBs represent changes in supply/demand dynamics. Did I say that already?

This may not convince all that there are Smart Monies and syndicates involved in the market, but it has to shake the ground underneath the random walkers.
*** On a completely different note, Welcome Sebastian and thank you for your willingness to share and enlighten us. I believe you are giving away the keys to the kingdom and am sincerely grateful.***
-
Tasuki and others,
Please use the other thread for such discussions. This thread is about Volume Spread Analysis. VSA can be used in a multitude of ways and this thread promotes all of them. What you are talking about is NOT VSA period. Could there be some value, maybe. But this is not a forum for that discussion.
We all know what Tom and Todd say about Up/down volume. If you feel differently, that is your proagative. And in fact, you may correct. But let's try to keep the stuff here germane. Post on the VSA aspects of your analysis with links to another thread for the more "specialized" stuff.
-
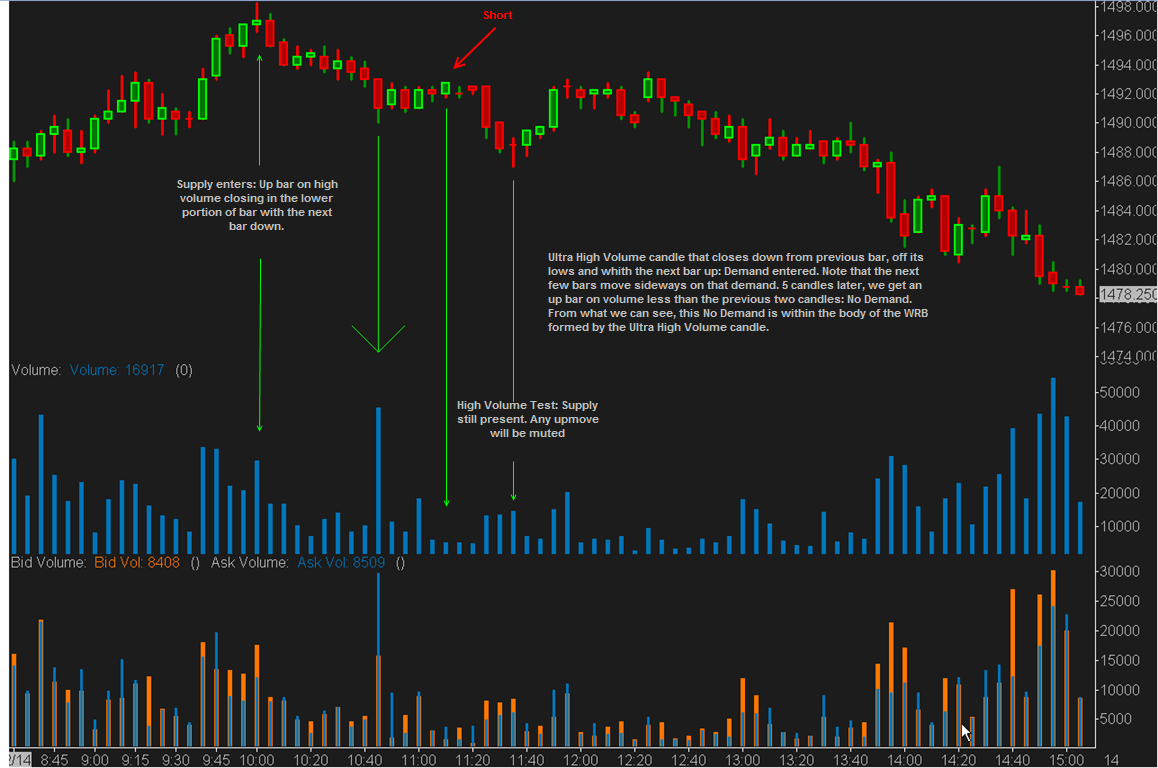
Can anyone shine some light onto why I might have misread (VSA wise) this trade I took yesterday?We had a nice run up (this in on the ES), got an ultra High Volume Up bar followed by an upthrust on huge volume as well.
We broke the low of the upthrust so I started watching for a short entry. Once I saw that no demand I took it.
The next bar moved up against me on increasing volume to close near the top so I put in a break even order and got out on the bar following that.
In hindsight you could say I was clearly wrong but in real-time it looked so right. Any ideas about what I may have missed? Was it the no Supply bar 5 bars back from the no demad that signaled higher prices?
Thanks
Obviously this is after the fact. However what I will say can be seen in more than one post in this thread-at the very least it is consistent.
1. Ultra High volume on the up bar. Markets do not like Ultra High volume up bars because they can hide selling within them.
2. The next bar is down, confirming that there was some supply entering on the previous bar. This bar also happens to be an Upthrust. Another sign of weakness.
3. The very next bar is the key. It is a narrow range bar on volume less than the previous two bars. It closes lower than the previous bar and the bar that follows it closes up and does not make a lower low. Simply, it is No Supply and is not confirmed until the bar after it closes.
Take a look at what you have as No Demand. Notice that the bar after it is up and makes a higher high. This negates the bar as being No Demand. While the base definition of No Demand would be a narrow range up bar with volume less than the previous two bars (a 1 bar signal), one really needs to wait for confirmation by the following bar. This is how TG works.
Back to the No Supply. This is a repeating pattern that is a good sign of strength. A No Supply bar immediately after the Upthrust that followed an influx of supply.
Since I filter this through my own perspective, I would add that it appears that the No Supply bar would be with in the range of a WRB (the up bar on Ultra High volume if in fact that is a WRB). More reason to be looking to go long not short.
**edit***
Just wanted to add this. There is a sign of supply coming into the market that only moves prices sideways (a sign of overall strength). This is where the triangle on the chart is. Now if you look at the Up bar in question, it is more likely Absorption volume and therefore a sign of stregnth not weakness in and of itself.
-
Let us be clear: Up onto a few days ago when Sebastian made his first post, there were no Volume Spread Analysis experts posting here. Only students on a journey like everyone else.
-
Hi Tasuki;Tom only has one book, and the name is ' the undeclared secrets'
Regards Sebastian
Play fair Sebastian.
The name of the book is Master the Markets (now). I know you had/have a site that sold the book under the original title, but the most updated book without many of the typos is sold exclusively by TG.
Both of us have issues with TG, but anybody looking to buy the book should be told to start there.
-
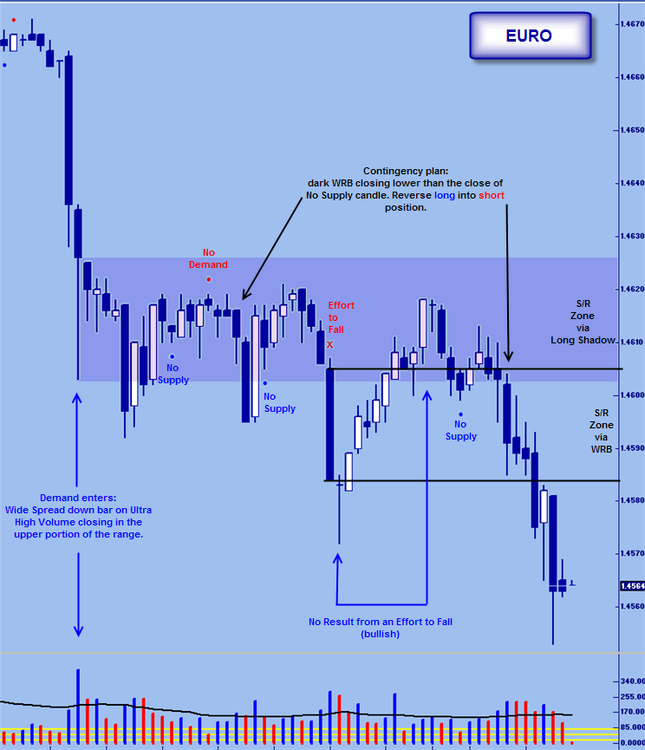
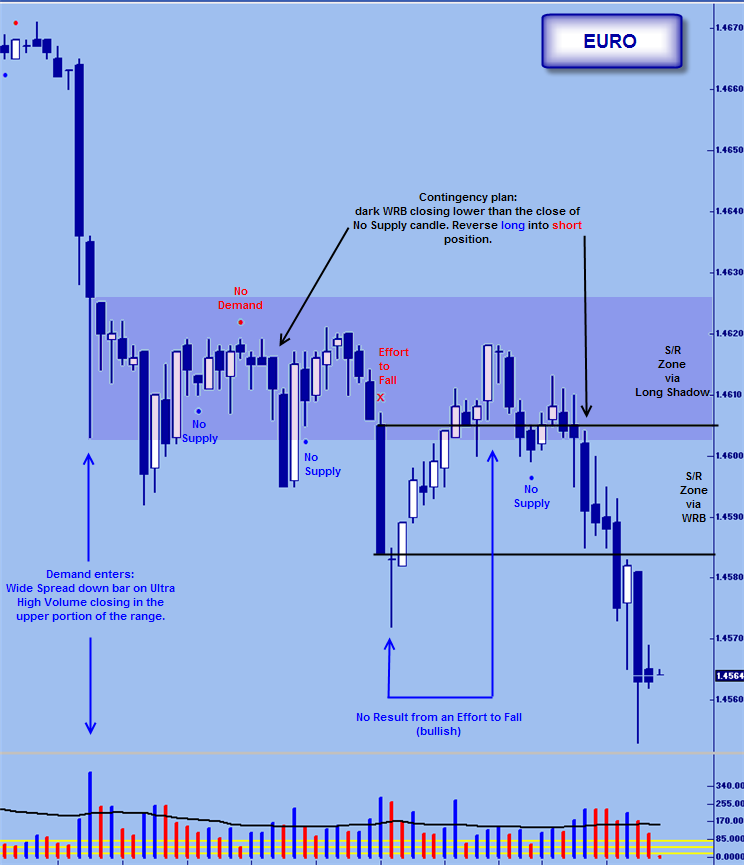
Tricky market action here.
Ultimate lesson: as traders we need to remain flexible and not marry ourselves to a position. When the criteria for a contingency plan arise, we take advantage of it and don't focus on why the original analysis failed.
Let's focus on the Effort to Fall candle.
This candle is a WRB and thus creates a Support/Resistance zone. Within this zone, we would want to see a low volume signal as per usual. What happens is the market goes down on the next bar, but then proceeds to move up. Once price closes above the high of the Effort candle, we have No Result from an Effort to Fall. This is bullish. Now the market gives us what we want a No Supply sign within the body of a WRB (Effort Candle) and it makes sense. Clearly, the No Supply indication makes sense when taken in conjunction with no result from an effort to fall. More over, we have seen demand enter and take the market sideways.
But we soon are faced with a dark WRB that closes lower than the close of the No Supply candle. This is our contingency plan signal. Something has changed, or we were wrong from the get-go. Either way, be flexible. Be quick. Or be dead. Reverse position and surrender to the market. Let it take you where it wants to go, not where you think it should.
-
jjthetrader:I have been reading a good deal of this thread. There is a lot of negative things said about TG. I'd like to run a few things by you.
1. Several guys claim that signals in TG change depending on the next bar. So, a signal that looks good after the fact may not have actually been at the same spot real time. True or false?
2. How is the customer training? Do we get a lot of Todd?
3. Do you see TG as an indicator based system or are a signals just a guide to use simplify and use VSA effectively.
4. Could you get by effectively, at this point, without the signals?
Thanks
These questions were not posed to me, but I would like to chime in on a couple.
1. This is the biggest issue of all. First, I do not like TG software and believe it is not necessary. Now for the answer. Most "signs" of strength or weakness are two bar signals. Like many candlestick patterns, certain requirements need to take place both before and After a particular candle or bar on many of the signs. Now, when a person looks at a static chart on the web, they may see a No Demand on the highest bar and just before the price fell. This looks good and makes them think the exact top can be called. Which is of course, what the uninitiated newbie and losing trader is looking for.
What they do not understand is that the No Demand bar is only no demand if certain criteria are met on the next bar. So the software will wait for the next bar and then place a sign on the High bar (1 bar ago). Now it looks like it is late in real time and in a static chart it looks like it is a perfect fit. So while it may appear that the high tick or the low tick is being called it really is not.
Take a look at the work of John Pearson on High/Low close Dojis. Obviously by the name, you can see that while the doji is the point of interest something must happen AFTER the doji: a high/low close. If the lowest candle is a Doji and the next bar closes higher, then it may look like the entry was on the bottom bar (the doji). But by definition the entry is two bars later. The 1st bar after the doji must complete the pattern on the close. Suppose your software places a dot on the doji. It would look pretty dead on and some would mistakenly assume that was the entry point. This is where people go wrong.
I do not use TG. Here is what my software (vt) does on one of my definitions of No Supply:
A. It will look for a bar that has volume less than the previous two bars that is has a lower low than the previous bar and closes lower.
B. To be No Supply, the next bar must not make a lower low or close lower. Hence as soon as the next period opens, and does not open lower than the previous close, a dot will appear. If the current price trades equal to the previous close, the dot disappears. If it then trades up, the dot re-appears. ONLY AT THE END OF THIS NEXT PERIOD WILL THE DOT BE EITHER PERMANENTLY AFFIXED THERE OR NOT. It is therefore possible to look at a bar and see a sign, turn the computer off and come back and find the sign no longer there. Why? because the first time was DURING the interval of the next period and not on the CLOSE. TG works much the same way.
2. Todd is no longer with TradeGuider.
3. TG does not give buy/sell signals they are indications of strength and weakness. However, the red/green bar paint is basically an indicator based buy sell method if one wanted to use it that way.
-
ranj, I found the test that contained that bar on the 5 min and it had low volume.Beautiful.
A test as price trades around R1. All one has to do is focus attention on what happens around certain predetermined levels (like pivots or Market Profile).
I know its after the fact, but look how logical the Test is.
1. Price is moving up towards the pivot
2. Price breaks the pivot
3. Price moves down below pivot again, but the volume is drying up on the downside action. Price closes on the high on a Test bar.
It makes logical sense that once the Resistance is broken that a Test of that area would occur. Now some may say that resistance did not truly act as support as price got below R1, but we can see that the move below was false in the first place. Hope you were able to take advantage of it.
-
The only question I have is whether or not a true test should close below the close of the previous bar. There are examples of tests from this thread which go both ways--some closing above the close fo the previous bar, some below.The best case senario is for a test to close lower than the previous close. However, a test can close equal to and even higher than the previous bar.
That does not look like a test to me as it does not make a lower low. Just looking at the chart, it looks like the candle opened up on the low, and equal to the previous close, and then traded up for the period. While VSA does not look at the open, the open here shows that no time was spent to the downside, and thus when where they testing?
Tests go lower before closing on or near the highs.
I would be looking to see a low volume test in the range of that Long Shadow.
-
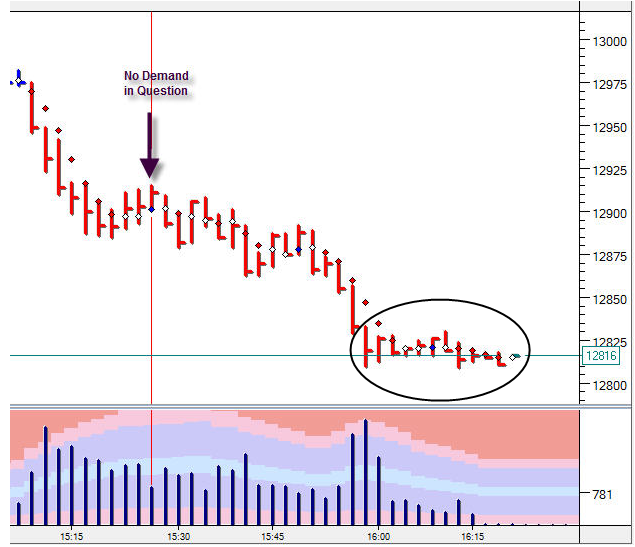
JJ
Note the area in the ellipse. The first bar is down on Ultra high volume and closes off its lows. BUT the next bar is up. How can this bar be up if all the volume as downside (selling) volume? It could not be. Hence there most of been some buying in that volume. What we have hear is No Result from high volume.
Notice that since that bar price has drifted sideways. This further confirms that demand must of entered within all that volume. Said demand is not pushing prices higher, but it is keeping them from falling at this point.
With all that red on the chart, I would not be quick to jump in on the long side just because of the Ultra high volume bar. Especially since this is only one timeframe.
-
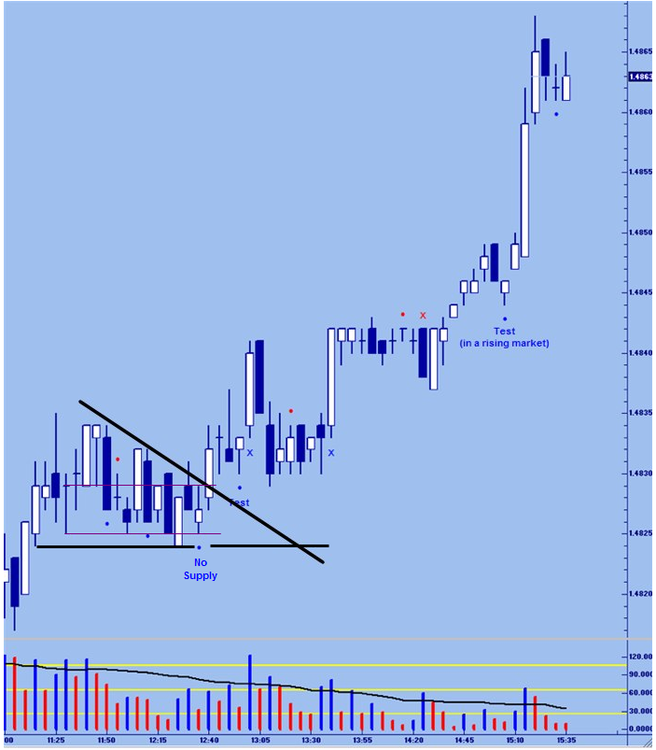
TG.
While my post was to show a difference between a Test and a Test in a Rising Market, you brought an interesting point to light.
But first. Note the quick (and tradable) pop in price action after the Test in a Rising Market. This type of Test benefits from BACKGROUND strength which includes a trend in place as opposed to a change in trend.
Now for the really cool thing you alluded to. Note that I have drawn another black line to complete the pennant formation. Also note that we have a Long Shadow that forms a resistance zone and we get a No Supply that is completely within that shadow. The bar after the No Supply breaks the pennant, signaling a long trade for the price pattern watchers. VSA and WRB & Long Shadow analysis is doing the same.


[VSA] Volume Spread Analysis Part I
in Volume Spread Analysis
Posted
What has been illustrated is a lack of a trading plan. Nothing more.
Suppose somebody here had said once you see a wide spread bar on ultra high volume that closes down, you have demand entering the market. Then you should look for a Test of supply, which is a low volume sign, within the range of that high volume bar. Now you have an entry signal......
Oh, I think somebody has said that a time or two.