Welcome to the new Traders Laboratory! Please bear with us as we finish the migration over the next few days. If you find any issues, want to leave feedback, get in touch with us, or offer suggestions please post to the Support forum here.
-
Content Count
112 -
Joined
-
Last visited
Posts posted by Robert2617
-
-
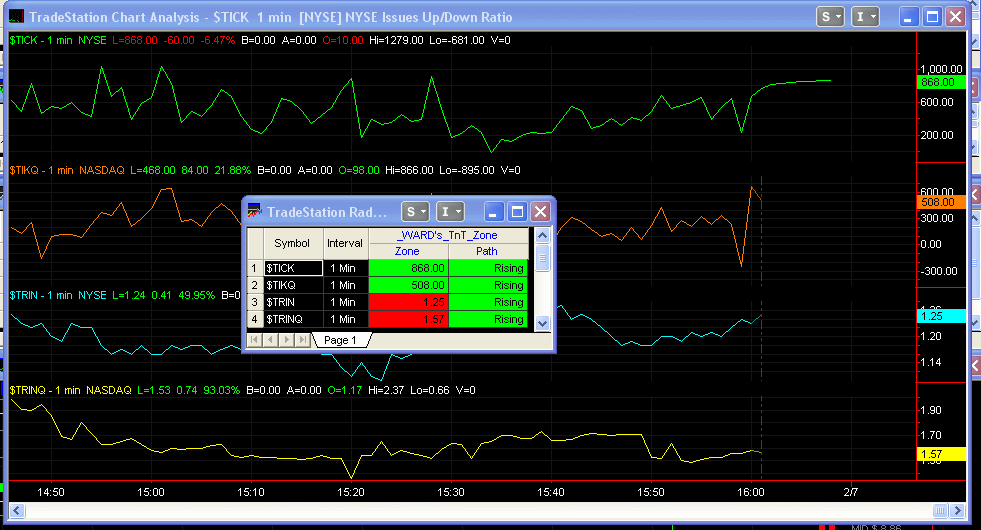
As set by the example of TheRumpledOne, I am paying it forward by giving you guys this RadarScreen I wrote tonight. My first!
I know other's have written Radar for $TICK and $TRIN but because I am new to trading and just learned what these things are myself, I had to write an indicator to prove to myself first that I could do it and because I wanted to add a few bells and whistles.
You can totally customize it with the user inputs I added. No programming needed. All of the inputs default to what I have read/learned to be the advised settings so you shouldn't have to change much unless you have some super secret way of trading.
The special features I added are the color changes when the TICK , TRIN, TIKQ and TRINQ get into Bullish, Bearish or Neutral levels. Also I added a second Plot that makes it easy to see if they are rising or falling.
I got interested in the four T's when I watched SoulTrader on his videos. Thanks for inspiring me! I've learned a lot.
Enjoy. I hope you will find this indicator helpful.

-
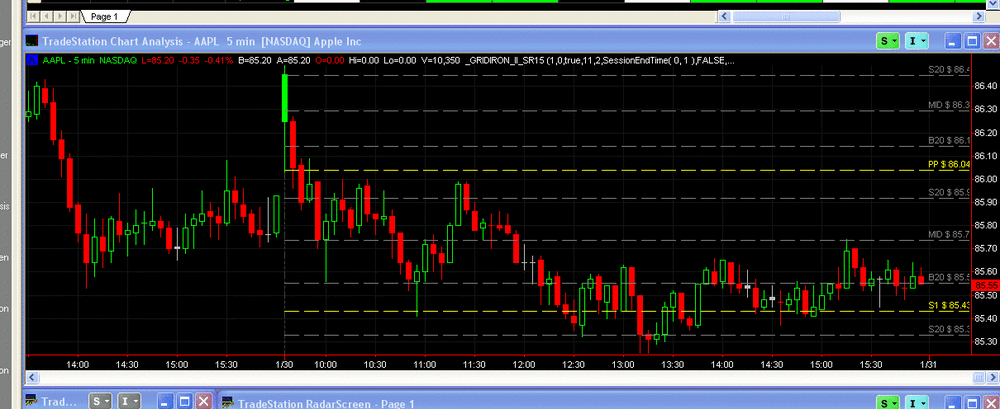
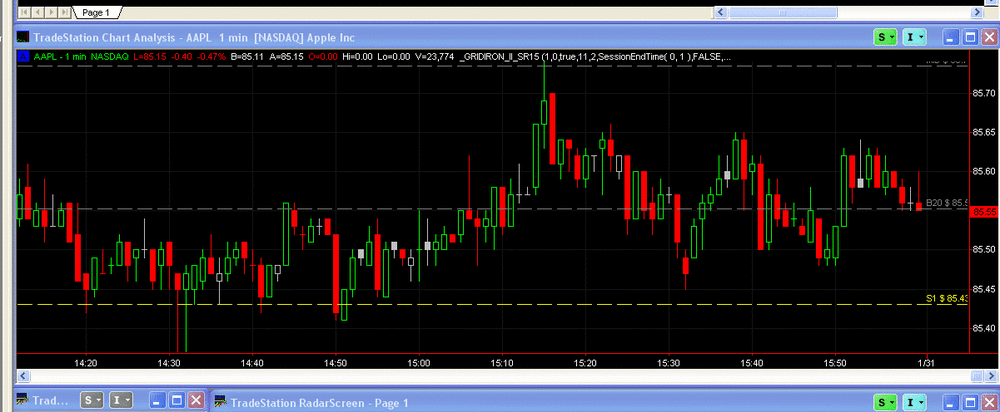
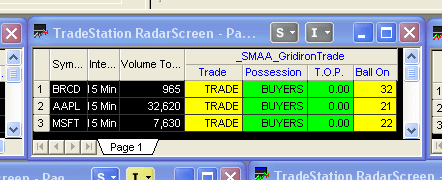
Here is TRO's version (automatic floor pivots) with a radar trade indicator. The radar indicator should be set on 15 min time interval. It's a football analogy to trading. On the radar screen, Trade tells you when the alert hits, Possession is who has the ball (who is in control), TOP is the time of possession and Ball On is where the price is on a 100 yard field. Both are included in the eld.
-
-
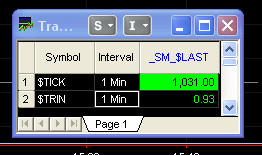
I found a TS Radar indicator for Tick and Trin. If going up it turns green, going down it turns red. It's not the same as looking at the actual chart window but you could shorten the tick chart a little and put it at the bottom left of the workspace. May be a little overkill but its sort of neat.
[LegacyColorValue = true]; {_SM_$LAST USE TO DISPLAY CLOSE FOR TICK AND TRIN } {*************************************************} { DETERMINE DISPALY } {*************************************************} Plot1( CLOSE, "LAST", white ) ; SetPlotBGColor( 1, BLACK ) ; IF CLOSE >= 0 THEN BEGIN Plot1( CLOSE, "LAST", green ) ; SetPlotBGColor( 1, black ) ; END; IF CLOSE < 0 THEN BEGIN Plot1( CLOSE, "LAST", red ) ; SetPlotBGColor( 1, black ) ; END; IF SYMBOL = "$TIKQ" OR SYMBOL = "$TICK" THEN BEGIN IF CLOSE > 100 THEN BEGIN Plot1( CLOSE, "LAST", BLACK ) ; SetPlotBGColor( 1, GREEN ) ; END; IF CLOSE < -100 THEN BEGIN Plot1( CLOSE, "LAST", BLACK ) ; SetPlotBGColor( 1, RED ) ; END; END; IF SYMBOL = "$TRINQ" OR SYMBOL = "$TRIN" THEN BEGIN IF CLOSE < -1 THEN BEGIN Plot1( CLOSE, "LAST", BLACK ) ; SetPlotBGColor( 1, GREEN ) ; END; IF CLOSE > 1 THEN BEGIN Plot1( CLOSE, "LAST", BLACK ) ; SetPlotBGColor( 1, RED ) ; END; END; -
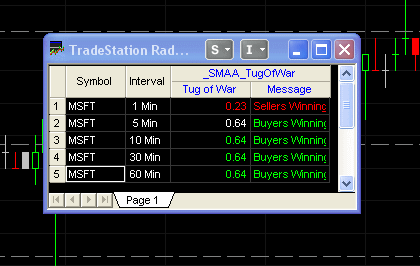
Here is a radarscreen one called "Tug of war". It shows who is in control, buyers or sellers. It does multi time intervals as well.
[LegacyColorValue = true]; {_SMAA_TugOfWar } {*************************************** Written by: Hondo Description: For Intra Day Use Only ****************************************} {Modifying Programmer: Avery T. Horton, Jr. aka TheRumpledOne, gifts and donation accepted, PO Box 43575, Tucson, AZ 85733 } { © Copyright 2006 Avery T. Horton, Jr.} Inputs: iDecimals(2); VARIABLES: Last_Close ( 0 ) ; variables: xTug(0), xPeriods(60), xInterval(0), sFirstPass(true), xMRO( 0 ), xIndMin( 0 ), xIndAvg( 0 ), xInd(0), tInd(""), FG1(white), BG1(black), fg2(white), bg2(black), fg3(white), bg3(black), fg4(white), bg4(black), vdummy(""); {commentary variables} variables: xcomm(0), oComm1( "" ), oComm2( "" ), oComm3( "" ), oComm4( "" ), oComm5( "" ), oComm6( "" ), oComm7( "" ), oComm8( "" ), oComm9( "" ), oComm10( "" ); {first time through} if sFirstPass then begin sFirstPass = false; {bar test} If bartype = 4 then xInterval = 94 else If bartype = 3 then xInterval = 93 else If bartype = 2 then xInterval = 92 else If bartype = 1 then begin xInterval = BarInterval; end; { If bartype = 1 } end; {if sFirstPass} { INITIALIZE } tInd = ""; FG1 = WHITE; BG1 = BLACK; fg2 = WHITE; bg2 = BLACK; fg3 = WHITE; bg3 = BLACK; fg4 = WHITE; bg4 = BLACK; { PROCESSING } { calculations } if bartype <> 1 then tInd = "error - intraday interval only" ; if Last_Close <> Close or BarStatus(1) = 2 then begin // Calcs, Plots, Buy/Sells go here {Tug of War} Value1 =((HighD(1)-LowD(1))+(HighD(2)-LowD(2))+(HighD(3)-LowD(3))+(HighD(4)-LowD(4))+(HighD(5)-LowD(5)))/5; Value2 =(HighD(0) - Value1); Value3 =(LowD(0) + Value1); value5 = Value3 - Value2 ; if value5 <> 0 then xTug = ( Close - Value2 ) / value5 else xTug = xTug[1] ; end ; // update only on price change of last tick of bar Last_Close = Close ; { Alert criteria } xInd = xTug ; If xInd > xInd[1] then begin Fg1 = green; Bg1 = BLACK; end else If xInd < xInd[1] then begin Fg1 = red; Bg1 = BLACK; end else begin Fg1 = white; Bg1 = BLACK; end; If xInd > .50 then begin tInd = "Buyers Winning" ; Fg2 = green; Bg2 = BLACK; end else If xInd < .50 then begin tInd = "Sellers Winning" ; Fg2 = red; Bg2 = BLACK; end else begin tInd = "Draw" ; Fg2 = white; Bg2 = BLACK; end; Plot1( xTug , "Tug of War", fg1 ) ; SetPlotBGColor( 1, bg1); Plot2(tInd, "Message", fg2 ) ; SetPlotBGColor( 2, bg2); { Plot3( oSlowK, "oSlowK", fg3 ) ; SetPlotBGColor( 3, bg3); Plot4( oSlowD, "oSlowD", fg4 ) ; SetPlotBGColor( 4, bg4); } xComm = _fCommentary(oComm1, oComm2, oComm3, oComm4, oComm5, oComm6, oComm7, oComm8, oComm9, oComm10); CommentaryCl(oComm1 ); CommentaryCl(oComm2 ); CommentaryCl(oComm3 ); CommentaryCl(oComm4 ); CommentaryCl(oComm5 ); CommentaryCl(oComm6 ); CommentaryCl(oComm7 ); CommentaryCl(oComm8 ); CommentaryCl(oComm9 ); CommentaryCl(oComm10 ); CommentaryCl( " Tug Of War ", NumToStr(xInd, iDecimals) ); -
I watched the tick and trin pretty much all day today and find that I agree with you guys that there is definately a relationship in the price action that occurs. Thank you for pointing this out to me. I'm 100% positive I will be a better trader always keeping in mind the tick and trin.
I'm sure this is old news to most of you but to me, this is a HUGE breakthrough!

-
How many of you subscribe to the TradeStation RadarScreen? And if you do, do you use it very much?
-
-
NYSE:
$trin - General market sentiment
A Trin reading below 1.0 is ""healthy"" i.e. the bias is up.
A Trin reading above 1.0 is ""sickly"" and the bias is down.
In general a range between 0.75 and 1.25 is flat or neutral.
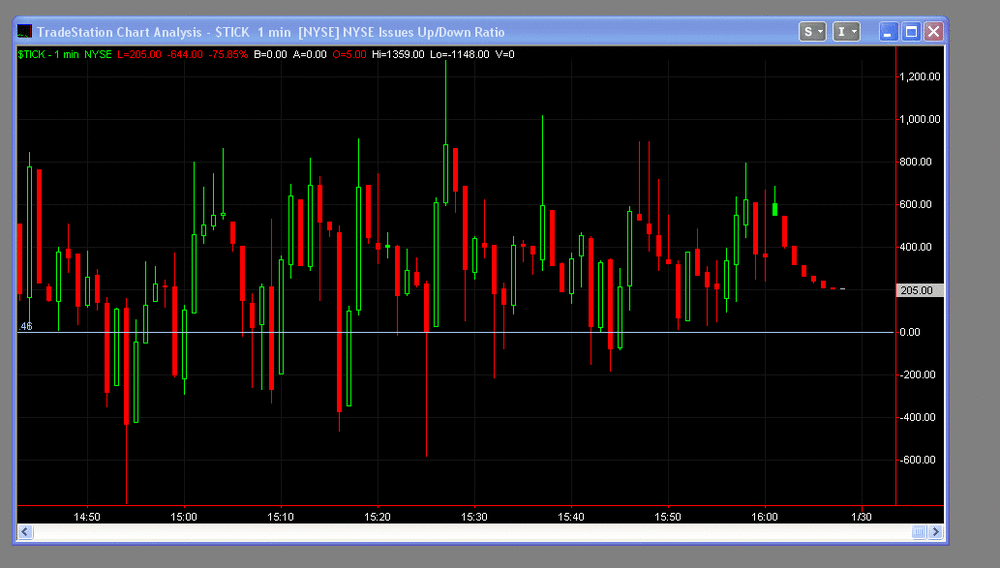
$tick - TICK is a very simple indicator measuring the number of NYSE stocks currently trading on an uptick vs those trading on a downtick. It provides a very nice snapshop view of who is in control in the battle between the Bulls and the Bears.
Nice, short but pretty thorough. Day Trading - a leading day trader teaches you day trading
NASDAQ:
$TICT TICK Indicator <---- does not work on TS
You can find all of them for all indicies here:
-
So... Theres not one for each symbol! Ha! That's very interesting. Is there one for the nasdaq too? What is the correlation with the symbols? Is it the sum total of all ticks from the exchange or is it when you have it sync'd up with one of your charts it correlates to that symbol? I guess I know what I'll be reading about tonight.
I was watching one of the videos you did and every time the tick hooked down, the symbol hooked down. I guess that is why I'm confused about this. It seemed if they were connected in some way.
-
-
-
-
OK, thank you once again. I'm going to fiddle with this and see if I can figure it out. I'll report back with a screen shot in a few.
-
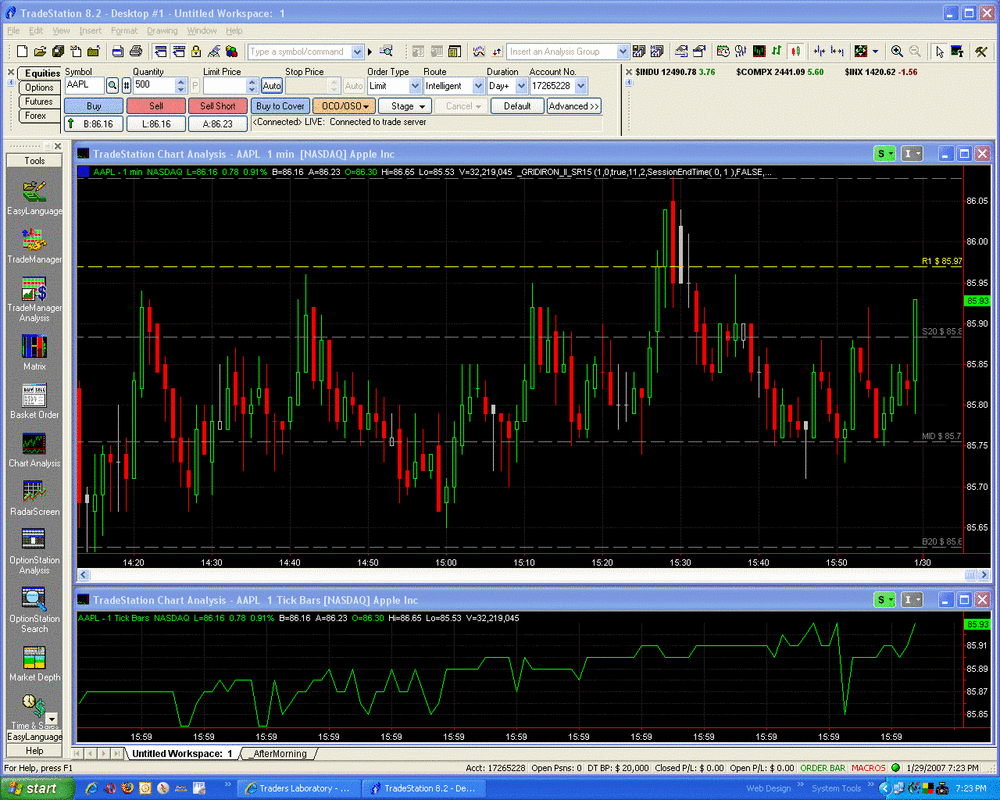
I'm trying to get the tick window for a single stock. One like you have at the bottom of the screen shot for the NYSE. Sqiggly line crossing zero line.

-
I think you are on to something here. I must learn this!
 Great video
 -
Very nice! I really do appreciate you guys making these videos. I'm learning little by little. When you explain things it seems so clear. Then when I'm looking at my computer by myself, I feel unsure.
-
SoulTrader, I have watched many of your trading videos and I like your style. It make perfect sense. Plan your trade, track the price and trade with the tide.
On that note, I would like to watch the tick window like you do but I don't know how to get it going. Today was the first day I was able to really watch a few stocks with TS. I think I'm really going to like it. I'm coming from ScotTrader (not Scottrader Elite) and this is a whole new world for me.
I looked at most of the chart indicators today but haven't found the tick indicator. Where the heck it it? Thanks
-
I noticed that every once in a while, after clicking a link, I will get the "Site not found" browser page. I have seen this before and my best guess is that it has something to do with the MySQL database. It may need to be "Optimized" and "Repair any errors".
-
Oh I see them. It's working well! Looks good!
-
Awesome, I think it will make navigation much easier for everyone.

-
Thanks Robert. I have Adobe Photoshop also but have no idea how to use it. I would love to get some of your icons here on the forums
Here they are! I took the liberty to rename them to simple names and converted all of the jpg's to gif so they are all the same file type now. For each one you have the original and an orange shaded one to indicate new posts in that particular forum. I have made a zip file that contains the icons and it is located here: http://planetreload.com/forum_pics/tl_icons.zip
-
I should be up and running on TS either this Thursday or Friday (new user). I will test and check mine to see if I have the same issue. I hope not.
 Hopefully it is just a setting you have missed.
 -
Thank you Robert. Matching sounds like the best idea. I do appreciate.... Im not coder or web designer myself so I tend to receive alot of help organizing the site from my members
Once again, thanks!
I have the full version of Photoshop so I will tinker with these icons and we'll see if I can make something you like. I don't mind helping at all. I'm a new trader and have been enjoying your site.



TS RadarScreen
in General Discussion
Posted
Updated the ELD a little. Notify me if you find any errors but I think I got them all.