
Welcome to the new Traders Laboratory! Please bear with us as we finish the migration over the next few days. If you find any issues, want to leave feedback, get in touch with us, or offer suggestions please post to the Support forum here.

TheNegotiator
-
Content Count
3239 -
Joined
-
Last visited
-
Days Won
2
Posts posted by TheNegotiator
-
-
Here's a chart anyway:-
So we didn't initially get any massive responsive selling, but then that wasn't followed by any confident buying either hence the subsequent selling.
-
does anyone here look at cumulative delta?this intraday drop (right now) to test swing Low of 02.50 (at 11:10am ET) has (what I guess) is a positive divergence, CD well above level seen on the first swing Low.
Does this mean anything to anybody (I have just started for the 3rd time in 4 years) to try to incorporate CD in my trading and I am only spouting crp I've seen talked about on the internet.
any comments (pro or con) on CD would be greatly appreciated.
I find it can help me in seeing a change in order flow and momentum of order flow. So if I take a trade the I get a break in price structure and a thrust in cumulative delta, it is a positive sign that I'll be able to take at least something on the trade. The cumulative delta momentum in particular when it slows, is useful in highlighting a deteriorating level of interest and can foretell some kind of reversal. Someone once told me that people liked MarketDelta as with it they could tell whether a move was 'real' or not.
As for divergences, yes I do look at them especially when I already see we've overstretched and maybe hit good levels. I also like to see when price is trending (used loosely) one way and delta is going the other. This usually leads to a pop and I see the action as passive aggressive (or aggressive passive
 ) OTF action. Not that it happens too often though.
 -
Hi,I know that Delta volume bid/ask is the difference between Market ask volume and Market bid volume. And this doesn't take in account the volume traded on Limit orders.
Am I right ?
Raymond,
Delta volume is indeed the at ask volume minus the at bid volume. This can be a summation per bar (for example a 5 min bar or a 4 tick reversal bar) or it can be delta per price per bar (i.e. the amount of volume traded at the price when it was offered minus the volume traded at the same price when it was bid, again within a set period).
The reason for looking at it is that supposedly market orders are aggressive and limit orders are passive. It doesn't explain who is being passive or aggressive though and to what purpose. The volume traded at limit is just the inverse of the market order trades. If a market order for 1000 lots in ES hits the bid, then someone (or probably in this case someones) must be filled by a limit order.
But I am not sure what Delta volume upticks/downticks means in terms of Market order and Limit orders.Thanks for your light,
Raymond
Delta volume in terms of ticks is slightly different. A tick is one trade or transaction. So if I sold a 1 lot or a 100 lot at the bid, that would count as 1 tick - i.e. it happened in one single transaction. If I had a limit order for a 100 lot on the offer and someone bought into me a 17 lot then a 38 lot then 43 then 2, that would be 4 ticks even though I had one order. So tick delta is the number of aggressive transactions versus volume delta which is the volume of aggressive transactions.
Hope this helps.
-
At some point I'll put a resource together for some tutorials for basic and intermediate spreadsheets for traders using excel/libre and perhaps create some templates to work off too - if of course there's any interest...
-
Okay, well maybe stress isn't entirely to blame. Lack of preparation, focus and general understanding of the market and strategy you use can also play a big part. But even with these things it's possible that subconscious stresses can be at the heart of the problem. Fear of being wrong or losing for example might change the way we prepare or even worse, prevent us from doing so at all.
But ultimately anything we do in trading, from planning to execution to journalling to research is potentially affected by stress. This doesn't necessarily mean stress in the obvious form (like getting stressed because your boss shouts at you for doing something wrong) but it can be much more subtle. It could be through pushing yourself to work too hard or the discomfort of uncertainty you might have. The trouble is that until we take the time to notice whether or not we are "stressed" in any way, we'll probably never notice it and how it influences our every action (or inaction). You can kind of get stuck in a loop.
So how do you recognize potential problems and alleviate them? The two most obvious ways perhaps are mediation and exercise. Part of meditation is about mindfulness and being aware of situations as well as yourself and your reaction to situations. The act of noticing stress can go a long way towards negating it. The act of physical exercise won't help you recognize stress (although perhaps I could be wrong here) but it is the body's natural method for destressing itself.
I'm sure there are additional methods people use to be conscious of their own stress and I'd be interested to hear how they do it.
-
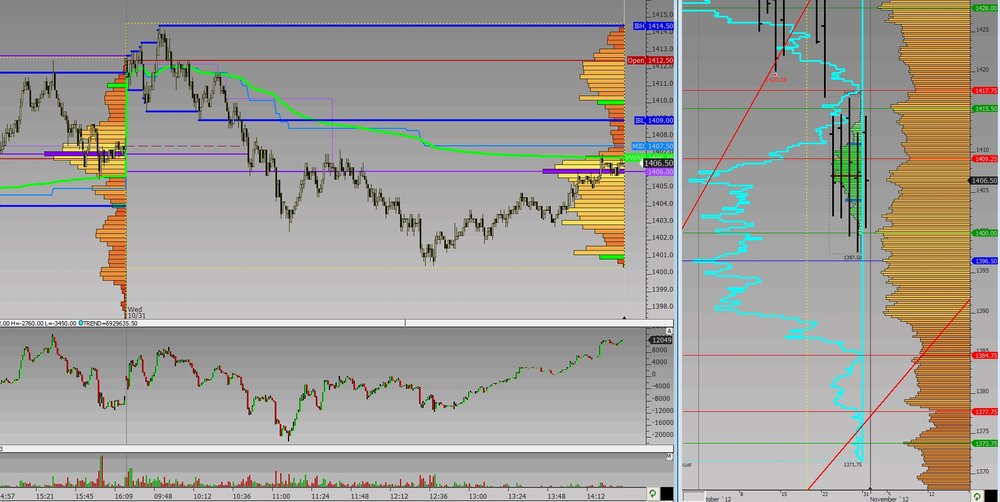
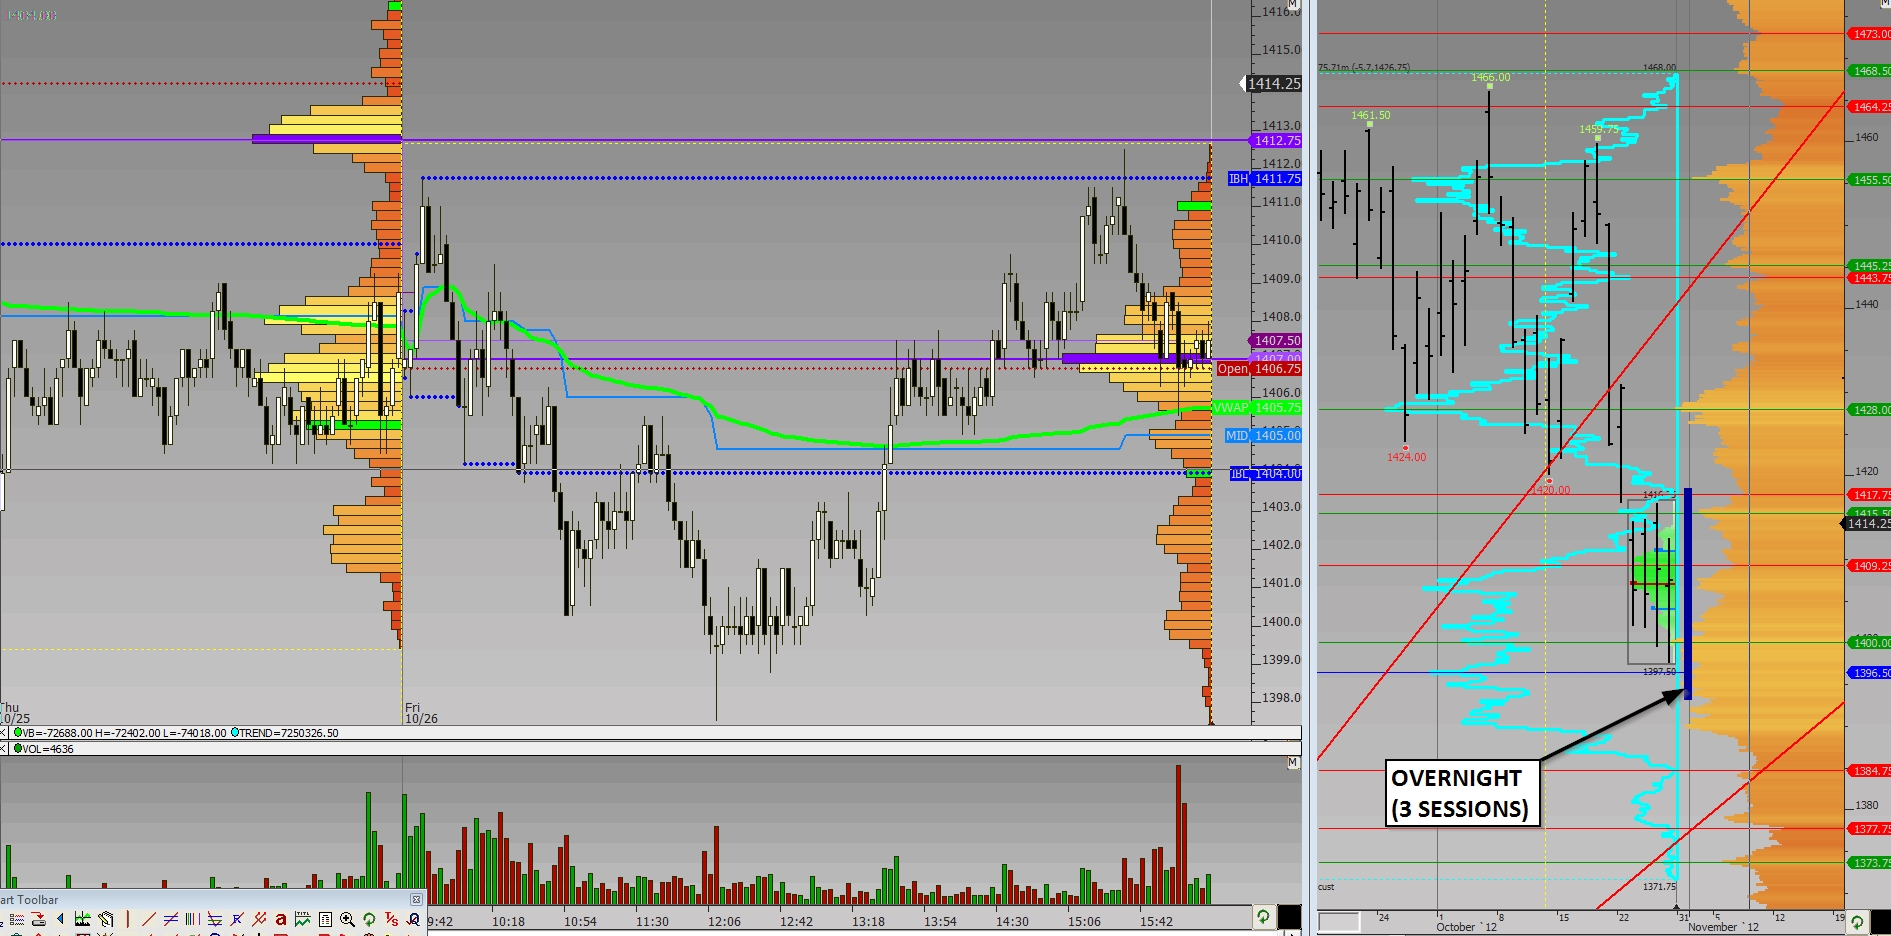
Sandy put the spanner in the works but my feeling is actually maybe people are more looking for opportunity than fear actually growing. Not sure, just a feeling. The 3 overnight sessions have basically tested and pushed a little on both sides. It would seem a stronger responsive action came in at the lows so far. This isn't to say that if we do explore higher it couldn't just end up a short covering rally in an otherwise broader correction. It could and it could also be a rejection of lower value. We'll have to see. We could well also get RTH responsive selling with stocks trading for the first time in a few days, with traders covering their risk. If this does happen, there's a decent chance we'll move down quickly and at some point see responsive buying again (not necessarily this session). In all, watch the market and see what it looks like doing and does in respect to your plan.
Here's a chart:-
-
ok here is a quick which one is better questionCore2 Quad Q8300 vs i3-3220
and
GTX 650 vs HD7770
Using a basic comparison from PassMark Software - CPU Benchmark Charts & PassMark Software - Video Card Benchmark Charts on the surface it would seem that the i3-3220/HD7770 combo is the winner. I would point out though that with the gpu in particular, it depends on whether the card is a reference design from nvidia/amd or it's a partner design. Non-reference usually see a nice boost in performance. But then it depends whether it's needed for the task you want it to perform. If it's for a trading/charting pc, the important thing to check for is really likely to be the number of supported monitors. It looks like the gtx 650 supports upto 4 via dual link dvi and the hd 7770 upto 6 via display port (although using standard connections I think 2 is probably what you'll get for either).
-
Hi everybody,I am writing this post out of frustration. I am reading Mind over Market for the 2nd time and I just can't understand some relations between the Day types and Open types.
For example, a Normal day is primarily characterized by a wide initial balance caused by the swift entry of other timeframes participants.
Then in the open types chapter, the author defines an "Open-Auction" as the least convictionnal open type, and says that it generally leads to...Normal Days!!
Well I've tried to read and re-read those definitions, put those definitions into an excel spreadsheet in order to try to see it clearer, but it seems that it just doesn't make any sense. And it's not the only problematic point, in fact almost every time Dalton make a relation between Day types and Open types it seems either obscure or incoherent:
- Open-Drive and Open-Test-Drive lead to Trend or Normal Variations days: "A Normal Variation of a Normal day is characterized by market activity early in the trading session that is less dynamic than that of a Normal day".
So how can it be that these 2 opens lead to Normal Variation days but not to Normal days??
- Open-Rejection-Reverse lead to Normal or Normal Variations days: leave alone the fact that there is almost no difference between a Open-test-drive and an Open-rejection-reverse (the author seems to miss completely that these opens as he describes them are almost exactly the same). But again why Normal days?? Aren't they suppose to be characterized by a very convictionnal opening, pushing strongly the market in one direction?
I really feel frustrated because I like the author approach and I feel like this book is full of very valuable informations.
I do understand that these are concepts difficult to grasp, not carved in stone. and I am OK to try to put the pieces of the puzzle together, but only if the pieces of puzzle fit at some point !
Do you have any coherent explanation about these points?
Thanks in advance !
Don't get too hung up on normal days. If you do a study on any particular product, most would have a very small percentage of normal days. The point he's trying to make is that if lots of business enters the market early on in the form of otf and creates a very wide IB then that IB is more like to stay in tack over the course of the day. I'm not so sure that this sort of thing happens so often these days, but why not just test it? Do a study of what an extremely high reading of an IB range has looked like over say the past two years and then identify what the percentage of these days ends up being a Normal Day. If you find a abnormally high percentage (if) then you have an edge. Look to fade extremes on days where you've got an extremely large IB.
I do think that the book has some not particularly clear parts to it but you should see past that. When I first started trading I read it and wasn't best impressed I have to say. However, re-reading it later I understood that the profile was merely the tool that he was using to see the auction and the principles could very well be applied (in most cases) with other types of charts. The principles are sound, but they're not a strategy. What they do is help you to see what is happening in the market. It's up to you to then find a way to profit from that (and you should be able to do that). I agree that maybe the guy doesn't trade and maybe things have changed to some extent and that there's a lot more to coming up with a coherent trading strategy (and plan), but I'd stand by the book as a good way to learn how to get context from the market. Read "Markets in Profile" too I'd suggest.
-
Some interesting replies so far. I'd probably home in on colonelb for a minute though. I think that by organising things in a consistent mechanical way, it becomes easier to objectively assess and compare things in your trading (and in life). But what if the market (or life) throws you a curveball? If something totally unexpected comes up, what do you do to remain objective in these situations? After all, it's these extreme situations that may well make or break us.
-
It is there - on the ES 4 tick rev chart, there are 8 bars, 5th has a blue box followed by 6th &7th which have red boxes.
-
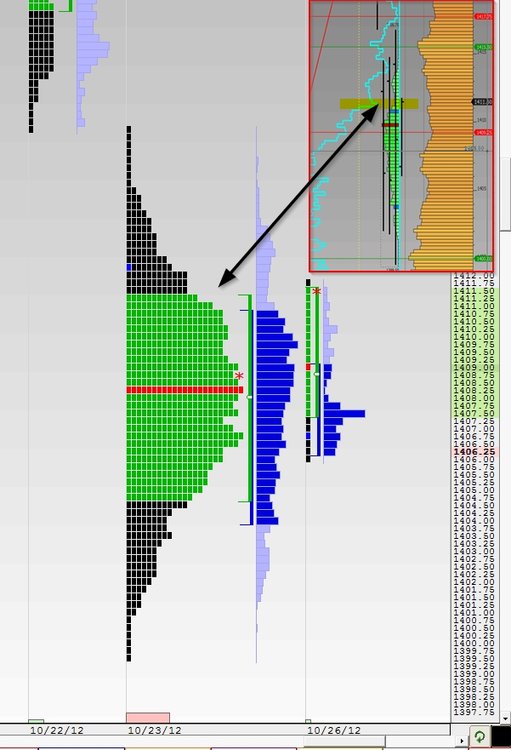
Okay, so far we have basically tested both sides of 'value' more or less. I don't normally look at value areas too much but when a profile looks like the one from the last 3 days, it's worthwhile doing so - especially when the value area extremes line up well with other levels.
-
Time to start crushing them The whys....What? James Bond? Sucka? Lol.
Anyway, not surprising we got a reaction there at the low end of the balance from 1pm onwards yesterday RTH.
-
This is the reason why the 11.25 area is important:-
(and the fact that it's a low volume area from yesterday)
((remember michigan's at 09:55))
-
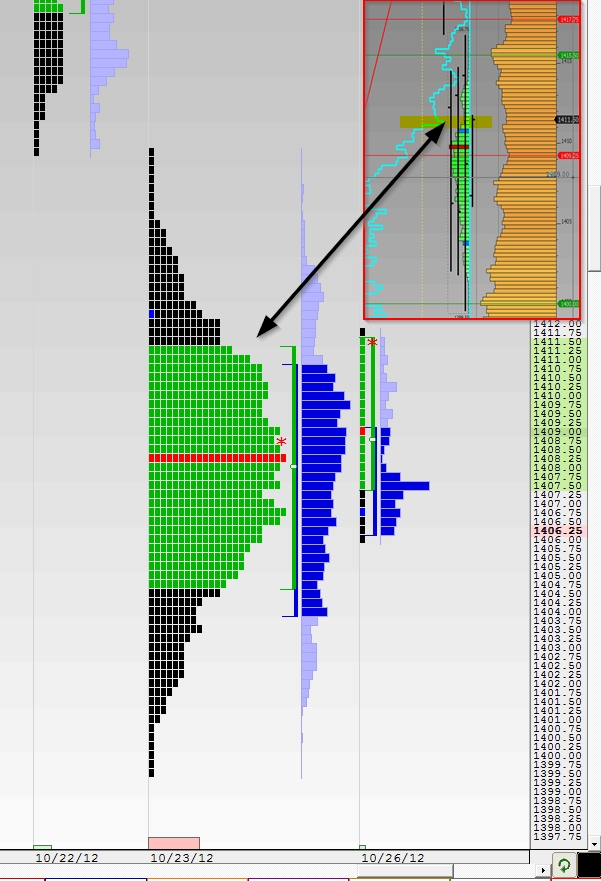
Forgot to mention that the APPL SOC was also the 3-day balance VPOC!
-
I like the suggestion of explaining the trades..no offense but I just don't think the web needs more people posting without giving the reasons for trades....so thanks to those who are taking the extra effort...great thread..been lurking here a long time !!Glad you like the thread John! You should get yourself involved and post a few ideas

-
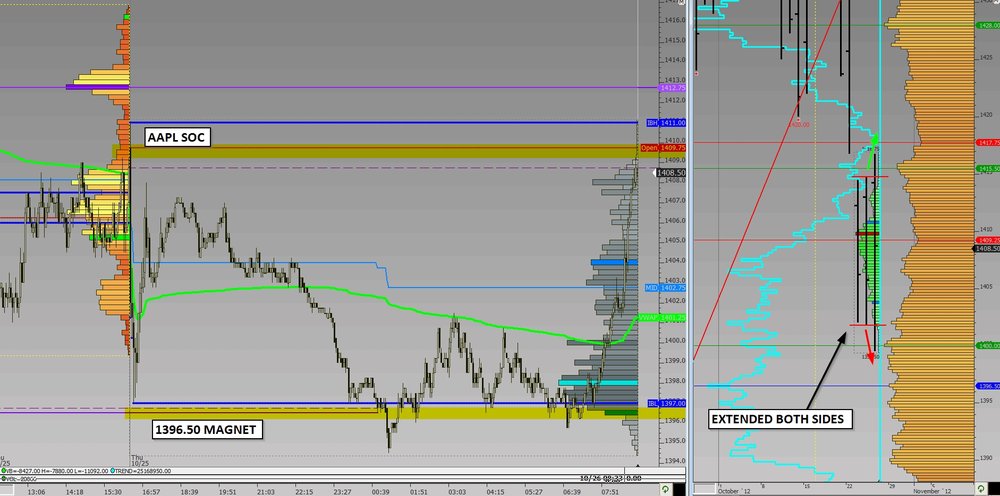
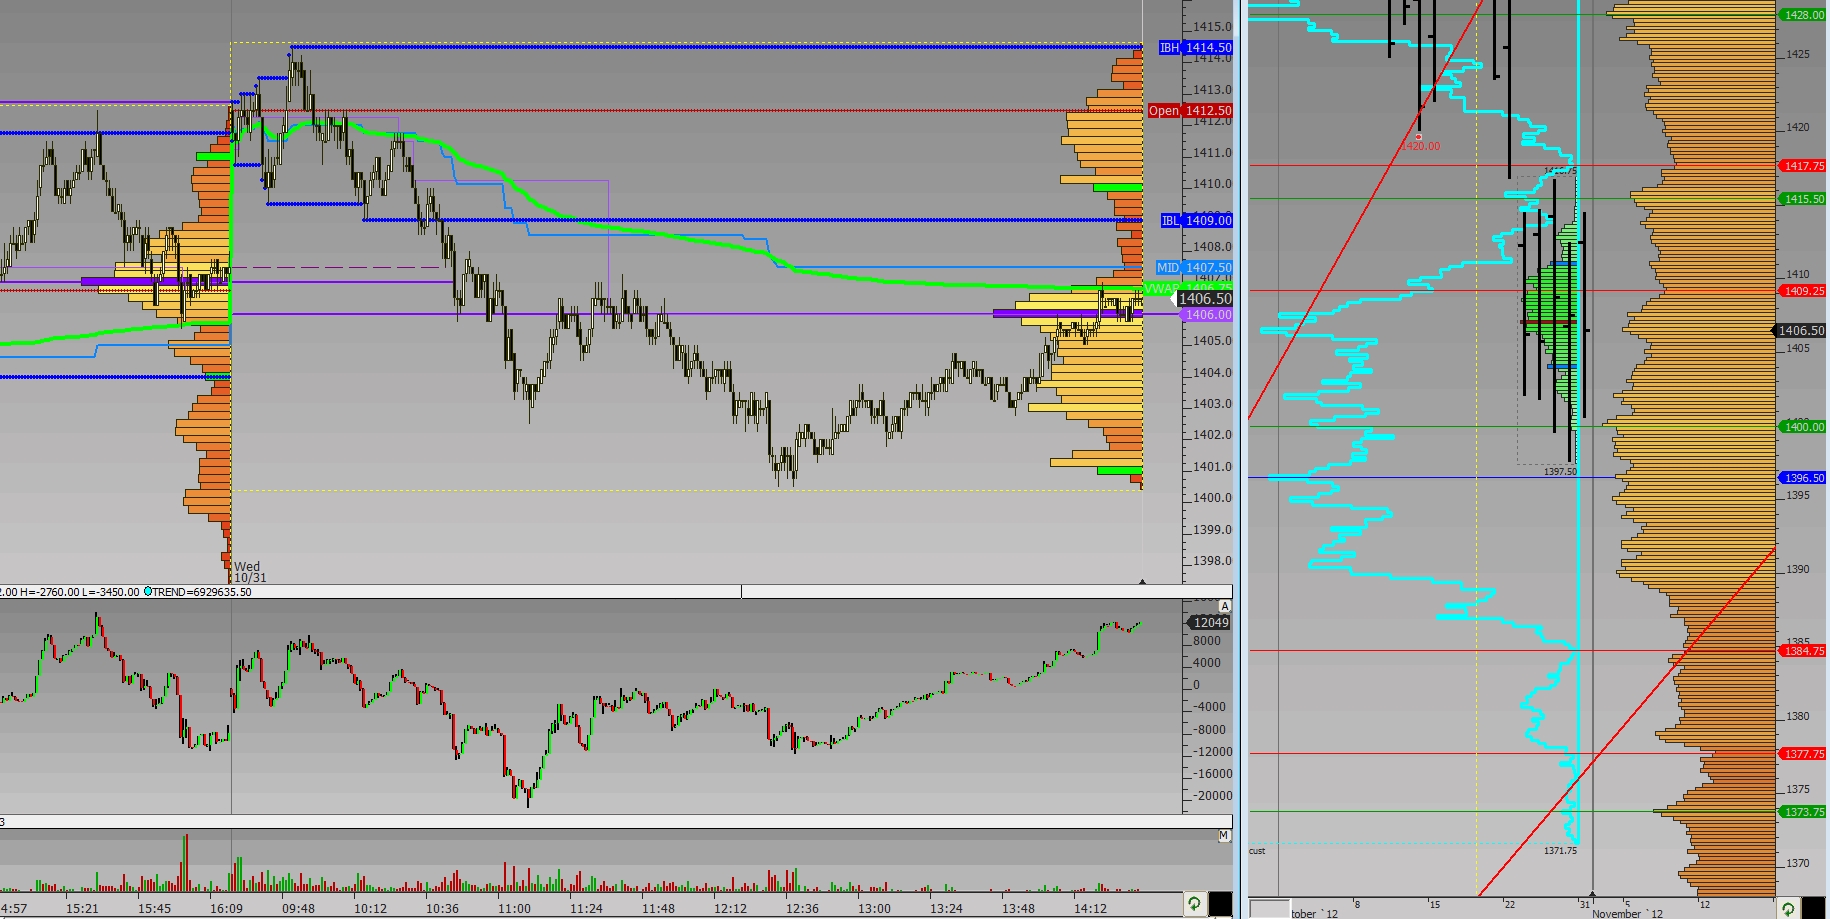
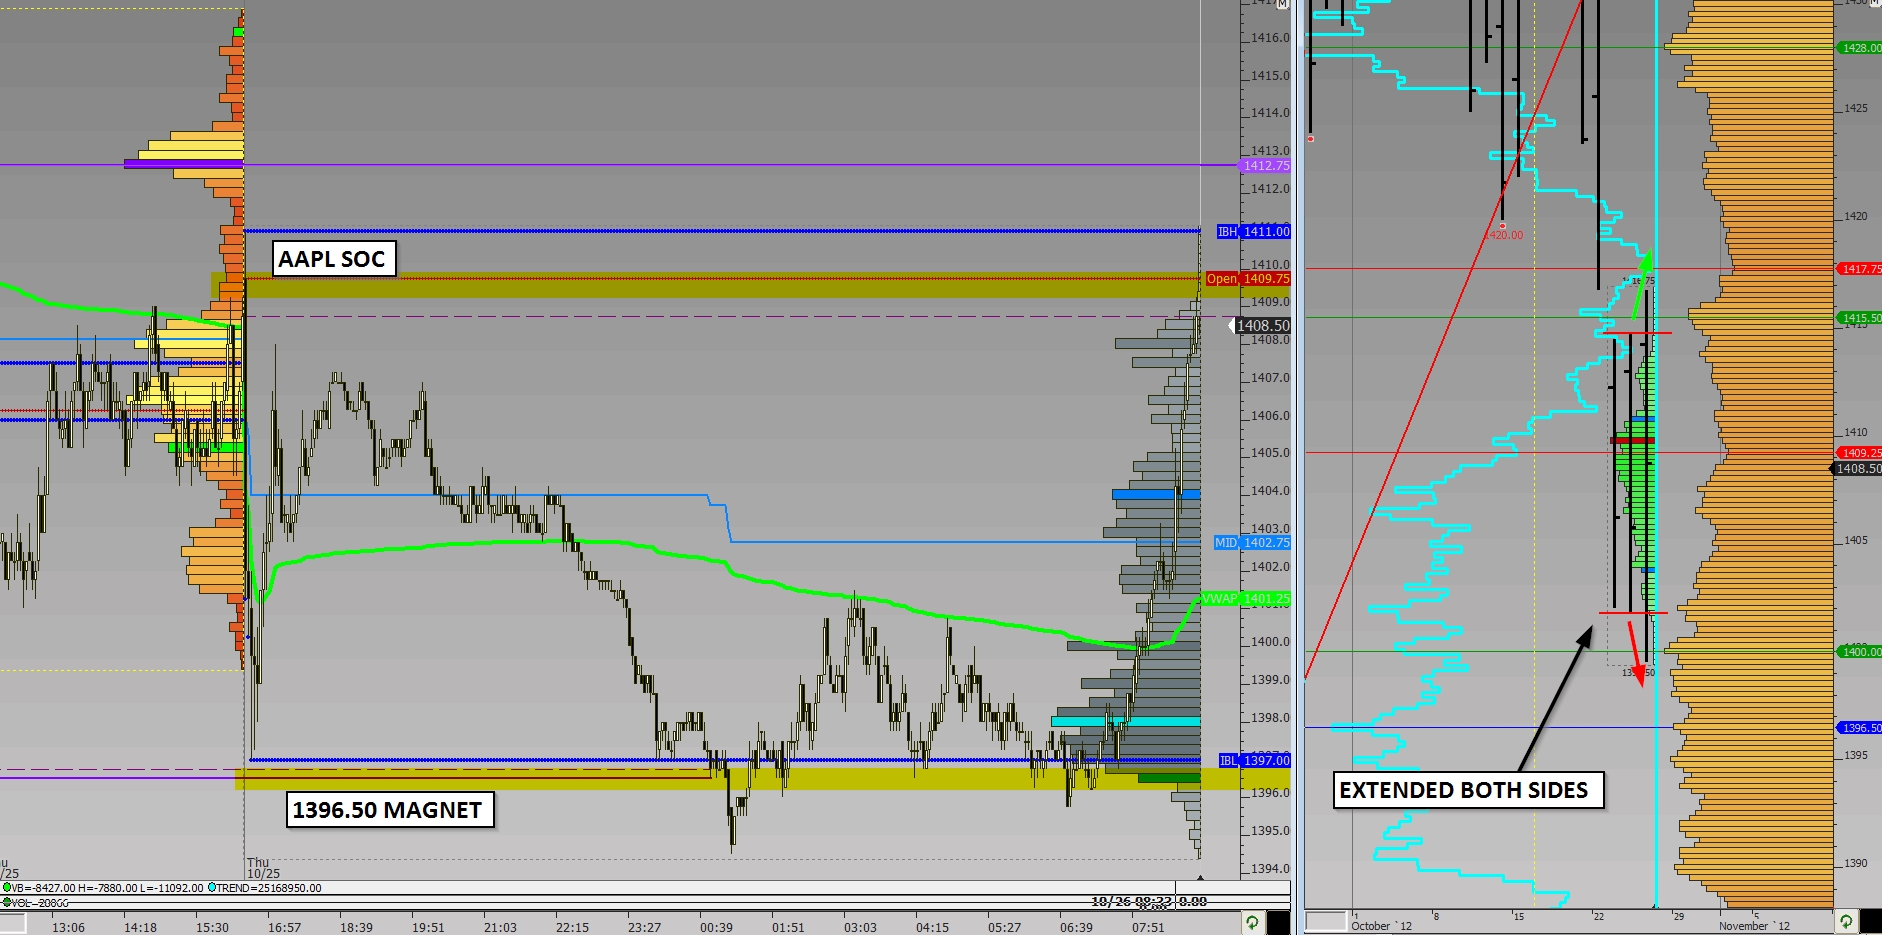
Interesting session yesterday and overnight. Yesterday tested and extended both sides of the balance but couldn't get to the 1396.50's and the high was at 16.75 10/22 rth low, on the low end of the area up to the balance low vol 17.75. Possibly AMZN/AAPL tipped the balance after close as seen in NQ. The 96.50's were then tested and the momentum took it through a couple of points to 94.50 before clearly holding well on the retest. Q3 GDP came in higher and now, we've swung back up to test the aapl scene of crime (SOC) and all of this before the rth open. Don't forget we have michigan @09:55. It looks as though we'll open somewhere in the middle of the balance now. I'm taking that o/n test of 96.50 as done for now and that means a test higher potentially on the cards. Possibly to 11.25 then 17.75. Does that mean we're going to be out of balance and break out? I don't know. I think there will be some decent movement though so pick your spots and work with the market context. Good luck!!
-
It was obvious to the world and his wife given it was the low of the recent range, I agree.What threw me was the Open-Drive off the level. For some reason I expected a bit more of a test.
OD's can turn into OA's or ORR's if they fail to follow through. At that point you have to decide whether you are willing to stand or wait for a pullback if it does reverse. I think you could have probably done either in this case given the context although if you're unsure then there's nothing wrong with holding fire. The second retest of 1414.00 for me would have been a pretty reasonable location and clearly with what did happen, timing.
-
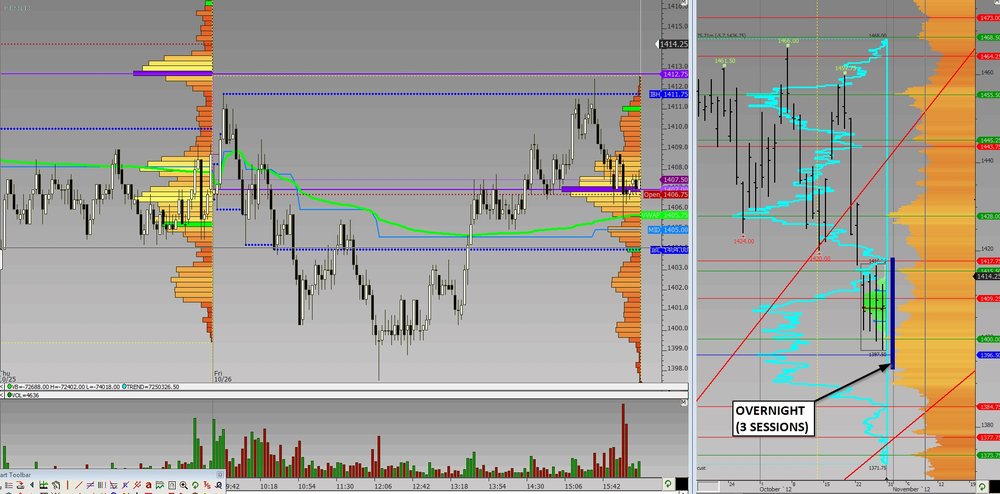
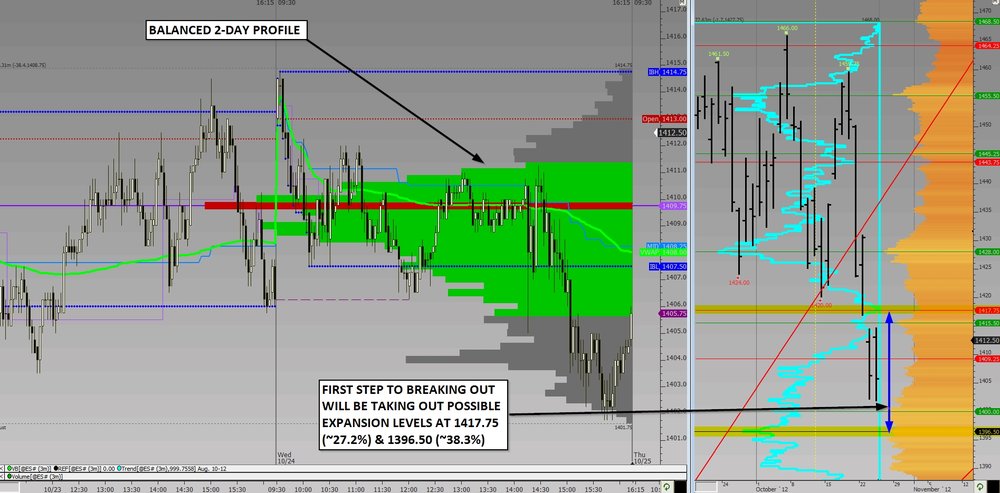
Very balanced 2 days just gone and we could break either side. My view is that we could remain in the same balance if either 1417.75 or 1396.50 contain the range. I think both sides of the range could be tested again (not necessarily both today).
Here's a chart:-
-
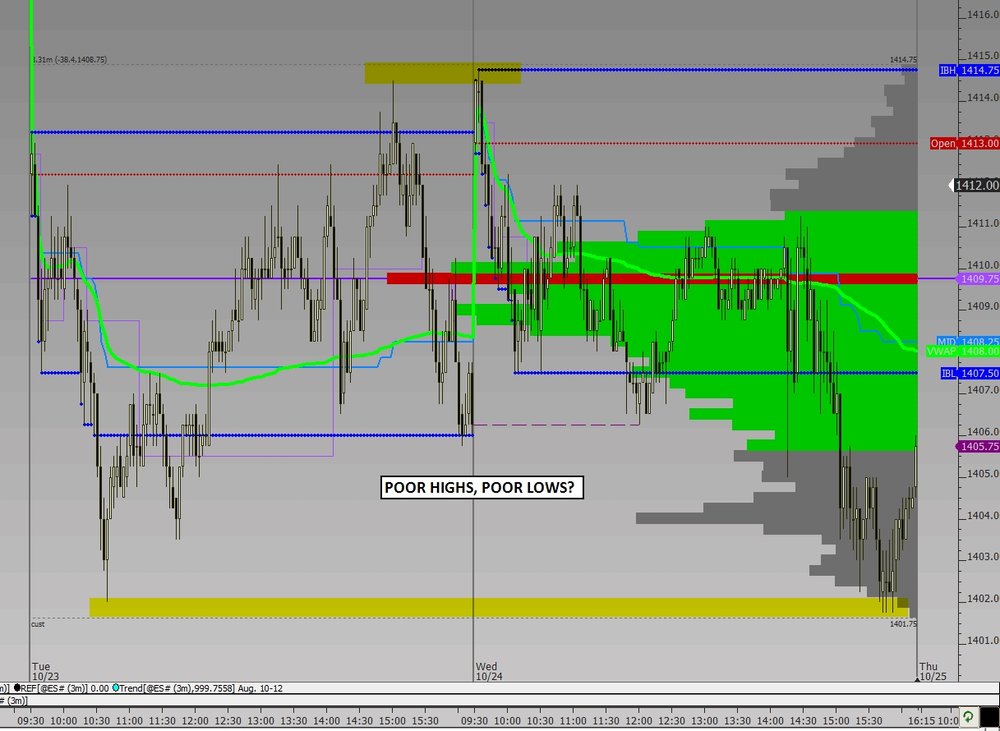
I think the low is in. But, I would like to see a change in direction. I will take a long at 17.75 on a stop. The volume over the last few down days was decent. Maybe overdone.The last two days have been very balanced. To me, the highs aren't great but then neither are the lows. We're probably building up for a move. Are we waiting for something in particular and which way will we break? Does it even matter which way we break?
GDP and Michigan are Friday and NFP's are due next week. Clearly this whole Greece thing yesterday ("do they don't they" have a 2-yr budget plan extension) had people second guessing things. It could just be that the market is pausing for thought on the way down. So the next question is "which way is it easier for the market to move?"
Although the momentum should be down, new lows weren't forthcoming yesterday, but this could also tie into the pause theory. Tuesday's highs were also not taken out and that was an area between the last balance profile and the old one which we're now exploring. The lows haven't yet hit fantastic targets imo either so I would probably lean towards a further exploration lower. Whether and how that happens is up to the market. If we were to break higher and hold above 17.75, there could be at least a few short-term shorts in trouble and I'd look for a test of the 28's and go from there. We could break higher and fail back lower to catch a few breakout players off guard. I'm also now looking at the proximity of the 1396.50 area and my gut feeling is telling me that it's too close to hold if we do get there. That could also catch out a few bulls. In all, nothing is certain and we as always must plan for different eventualities. Uncertainties can be difficult to decide how to trade, but then you pay your money and take the chance you know?
We are higher again overnight but still not breaking (yet). I would point out that these ideas are mainly based on RTH and although the market may hint at something if it moves higher overnight, what's most important to me at least is what it does in its primary session.
-
Hey I read the first page of this thread. Chances are that im not going to read 700 or however many pages there are already. Are you still posting stuff on the ES in the same fashion as the first page? BTW I saw some of the charts posted and want to post some of my own.Post away. The only thing I ask is that if you really must post a trade, you explain why you took it so that others might (or might not
) benefit. -
Hm - and this is coming from a guy who said:"...In the same way that pointing out that you need to find a strategy that fits your personality* (which also is kind of silly imo)..."
:rofl: ;razz;
My point is that 'personality' is potentially a hindrance. How do you get closer to seeing things as they really are?
*personality - one more time... it goes far beyond personality...:haha:I believe the use of that term herein is revealing of limiting beliefs
Yes I thought you'd pick up on that one zdo! Note the use of inverted commas.
-
I'm sure the psychologists out there will have (and probably already have had somewhere) a field day on this one. What is it that makes different people look at the same thing and come to vastly different conclusions about implications or meanings etc.? From watching your favourite sport to talking about the latest news item in the pub. From observing markets to forum posts. People see different things and these different views can sometimes be beneficial and sometimes not so beneficial. Sometimes someone can say something very different to what you've interpreted and actually, both things can be useful. Sometimes of course we can or somebody else can misinterpret something and come to an incorrect viewpoint. But the differences are usually there in either case. Is it emotions? Is it objectives? Is it indoctrinations? Is it just 'personality'?
Getting to the heart of it, how do we mechanically identify our own objectivity and remove obstacles to viewing the world for how it really is?
-
Not necessarily going to be something which continues, but it is worth noting at least that in spite of the lack of directional conviction in the ES it has actually been one-timeframing all session thus far...
-
Waking up beside that would be a little scary.on the other hand, it could give you great insights into the markets for the day


CPU and Graphics Card Question
in Tools of the Trade
Posted
So this means you shouldn't trade with an i5-3570k or even an i7 920? Sorry Eddie but that's just not true. It depends on what you want. If you have an all-in-one charting/trading platform and have a whole load of different charts and studies open at any one time, then yes the processor is going to take a beating, but even a 2600k or 3770k might struggle. Then if you're going to do backtesting etc. a multi-threaded cpu is likely to be helpful. It's basic comparison with passmark because it's not separating tasks at all. For a specific use, a cpu with a lower score might therefore be more than adequate in performing the tasks required of it. In any case, there's been no mention so far of what the pc is required for!