
Welcome to the new Traders Laboratory! Please bear with us as we finish the migration over the next few days. If you find any issues, want to leave feedback, get in touch with us, or offer suggestions please post to the Support forum here.

taq
-
Content Count
56 -
Joined
-
Last visited
Posts posted by taq
-
-
Hi TAQ,Regarding your drawing of Bearish Butterfly pattern, I would not fit ratios to draw the pattern. In my view, it is opposite as pattern must show the ratios. If the ratios agree within a defined range, then you conclude as a certain pattern. I never consider intermediate pivots (like your drawing of X pivot) to be a key level part of the Bearish Butterfly pattern.
I understand your point.Thanks, I will remember that.
Here is the ES daily chart, I draw the swing Highs/Lows.I would like to know Which pivots you consider as not valid & why??
Regarding Median Line. I am watching downward red fork if reverse from upper downsloping line than I would consider going shorts here problem is the blue upward sloping fork is still valid will watch price @ quartile & lower ML .Let us see how it will unfold .
Regards,
TAQ
-
Hello Suri Sir,
Thanks for the charts .
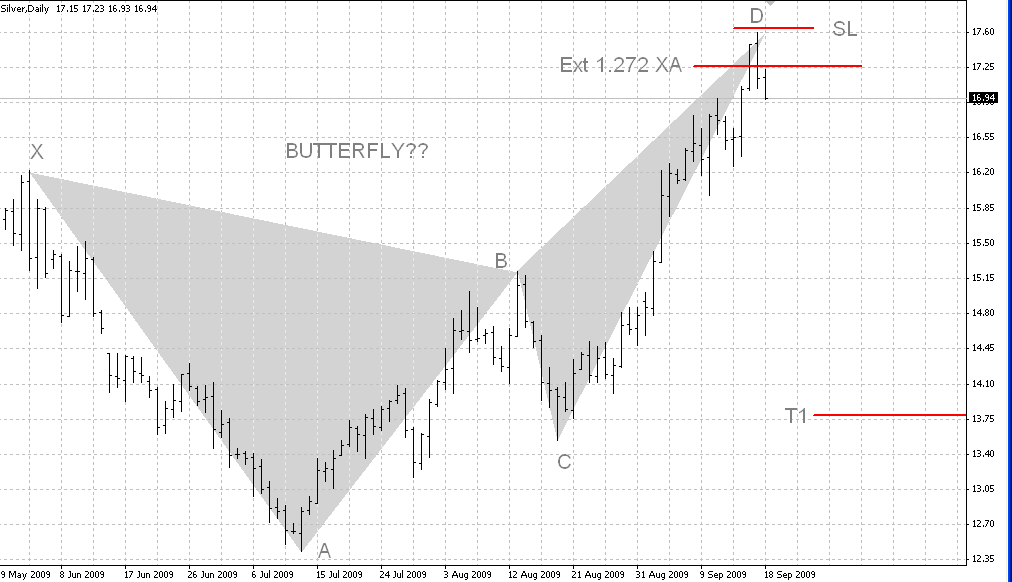
I would like to know your view on this bearish butterfly?? Can we consider it a valid one, price made a double top here but still PA is not strong enough in this PRZ.
[if you don't mind I am using your chart to make my point ]
I am also adding one more chart with andrew's median line.
Let us see how it will unfold.
Regards,
TAQ

-
Another thing to keep in mind about using correlated pairs or equities to trade is that you must know how to trade without using correlations and use the correlated pair for insight into pattern interpretations. Since they move simultaneously if the correlated pair has been moving down you would want to be looking for an exit to a short rather than an entry. Or if the correlation is inverse then you would be looking for an exit for a long position but the correlation would not tell you to enter a trade any more than looking at the equity by itself. Correlations do not necessarily tell you when to get in or out of a trade any more than looking at the equity by itself.Not many traders use this concept . I use this in forex trading everyday.Almost all major pairs are correlated some pairs show movements before others.
For ex. EU & GU have positive correlation coefficient +94
while EU & UCHF have -97 on dailies so i will avoid going long in both this pairs at the same time. I will go with strong signal & than look for opposite trade in other pair.
Hi,when you say hrly data is -0.50 , what that exactly means?
The correlation coefficient highlights the similarity of the movements between two parities.
If the correlation is high (above 80) and positive then the currencies move in the same way.
If the correlation is high (above 80) and negative then the currencies move in the opposite way.
If the correlation is low (below 60) then the currencies don't move in the same way.
On hrlys or short term its -50 which is not significant while on dailies or in intermediate terms -90 is almost perfect negative correlation.
-
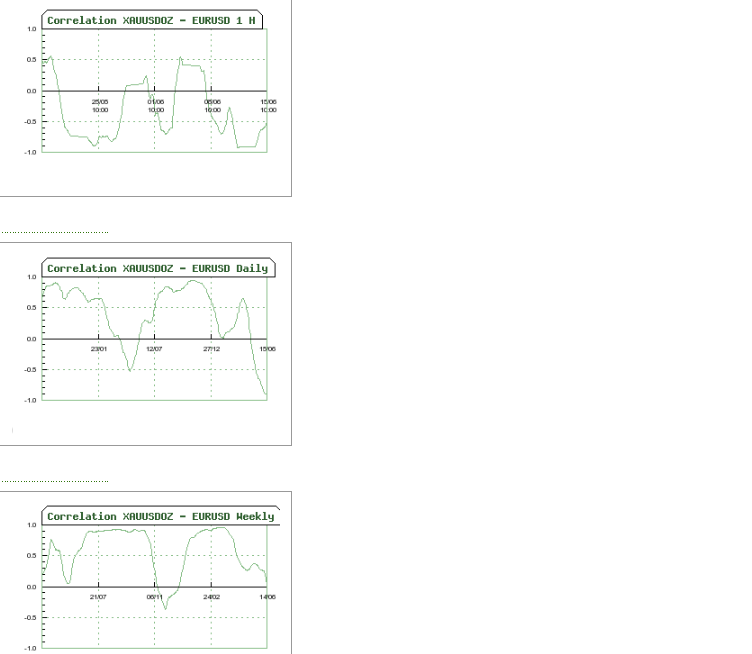
Gold is more or less inversely correlated with the dollar. I doubt if there is a precise calculation for its relationship with the dollar and the Euro. But the patterns are more chaotic and more difficult to trade. Trading a currency pair is much easier and produces much more profit.It depends on the time frame we are talking about.
Here I am updating the correlation analysis of last 100 hrs, 100 day & 100 week data.
As you can see in the short run (hrly data) correlation is -0.50
For intermediate (daily ) its -0.90 while on weekly it is showing 0.06.
Hope it might help.
Regards,
TAQ
-
HiSilver Weekly Comex shows Ascending Triangle formation(Bullish) with positive RSI divergence.
Regards
Vishal
Your Gold Symmetrical Triangle tgts done.
Here in Silver Weekly chart you posted there is no +ve divergence, both price & RSI made Higher low. Infact both MACD & RSI made -ve divergence last week (price made HH while indicators made lower high).
Here is the chart
Regards,
TAQ
-
Eur/Usd------------------------------ -------------
Long-Term Wave-count
-------------- ----------------------
all your tgts done.
looking forward your updated charts.
Regards,
TAQ
-
Great charts & all the best with the thread.
Regards,
TAQ
-
One pattern is made in S&P daily index.
Let us see how it will unfold.
Yesterday

Updated

Regards,
TAQ

-
Hello Suri sir ,
Thanks for the chart .
Can we cosider this as bullish Reciprocal AB=CD pattern?? if yes what probable tgts you are looking for.
Regards,
TAQ
-
Similar pattern is showing in DJIA-CBOE(VIX)

Regards,
TAQ
-
It looks like we made a intermediate top here for this last upmove (Indian market).
NSE NIFTY daily

-
got answer
Happy Trading
Regards,
TAQ
-
I haven't smiled in days, but that made me not only smile but laugh out loud. Imagine that ... I've been trading improperly all this time! Reminds me of something Larry Hite said in his Market Wizards interview - something to the effect that "it is amazing how much money you can make from being wrong."Best Wishes,
Thales
PS Please do keep posting to the thread. Your EURJPY example was excellent.
sorry about my language(english is not my first language) & happy atleast i made you laugh
i was not able to communicate it properly.
its not about being wrong or right but how much you make when you are right & how much you lost when you are wrong.
I know that breakouts and the traders who trade them are often held suspect by the general trading community (and I presume the general trading community includes the majority of traders, and we know how successful the majority of traders are).....
i never suspect your strategies(atleast we have our own strategies) i am pattern trader
i use weekly for breakouts & old support & resistance levels & retesting of them
daily for patterns & probable tgts in the direction of BO & trend & 240-min to initiate & trailing my SL.
& one thing more i use triangles a lot (ascending, descending & symmetrical) & trading on triangles are based on breakouts only.
Best Wishes & Happy Trading
Regards,
TAQ
-
Hi Taq,I know that breakouts and the traders who trade them are often held suspect by the general trading community (and I presume the general trading community includes the majority of traders, and we know how successful the majority of traders are) but I have found that life is much more simple and pleasant when I respect the breakout.
Best Wishes,
Thales
PS Nice trade on the EURJPY, by the way!
I am following your threads from quite some time & this one is the best on TL.
my trading strategies are not different from yours only difference is you initiate trade at the breakout but i wait for proper entry point & probable tgts so that i can get atleast 1:3,5 RRR
but when i am looking for reversal trade than i expect 1:7,10 RRR (less than 30% of my trades are like this)
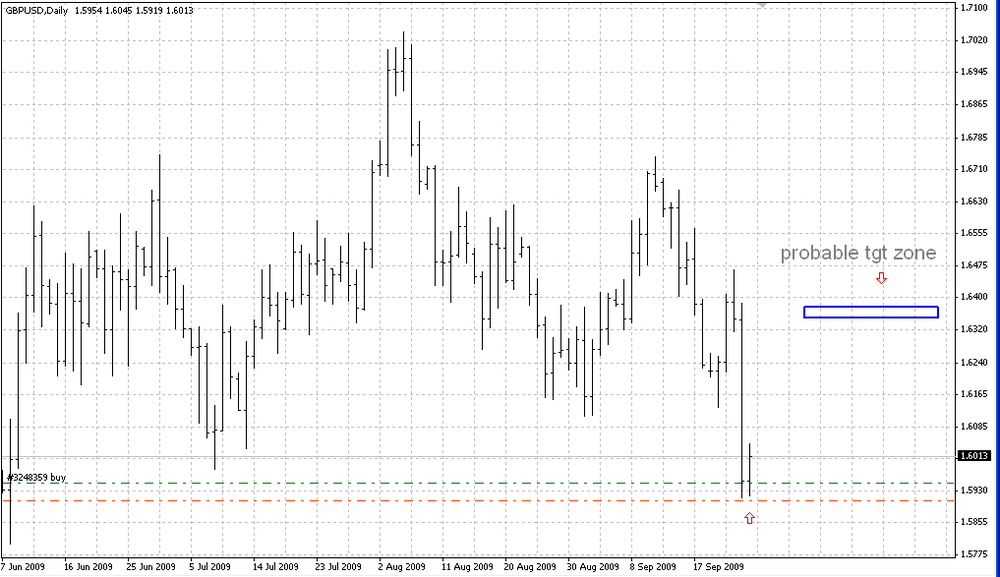
for ex. in last trade in GBPUSD RRR was 44:400 (i lost 20 pips bcz i closed at 5930 at closing time)
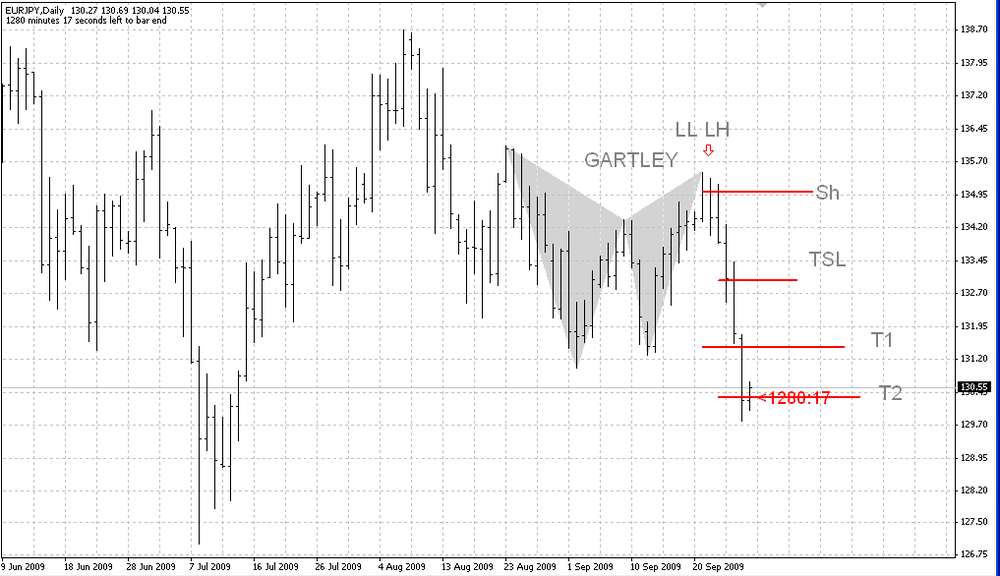
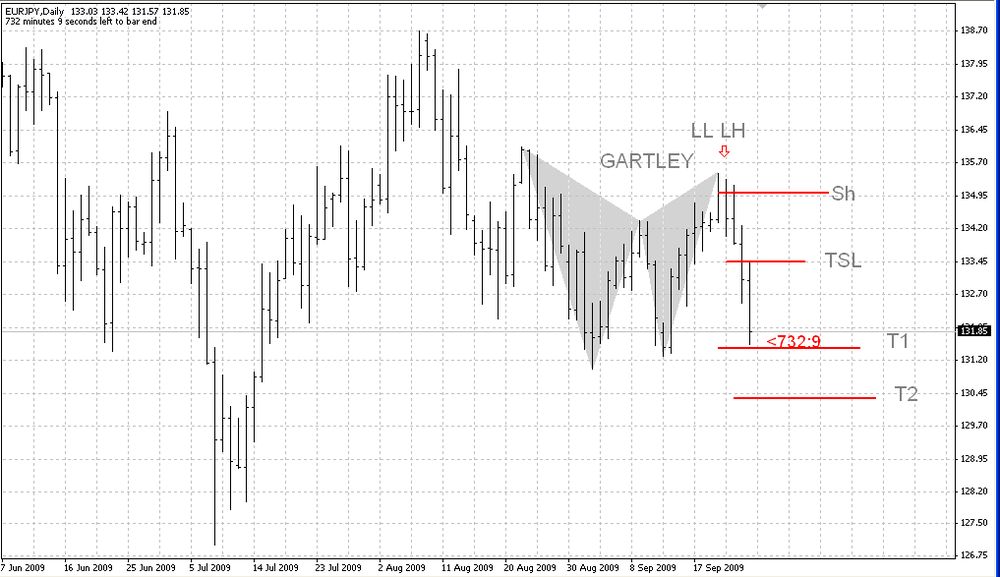
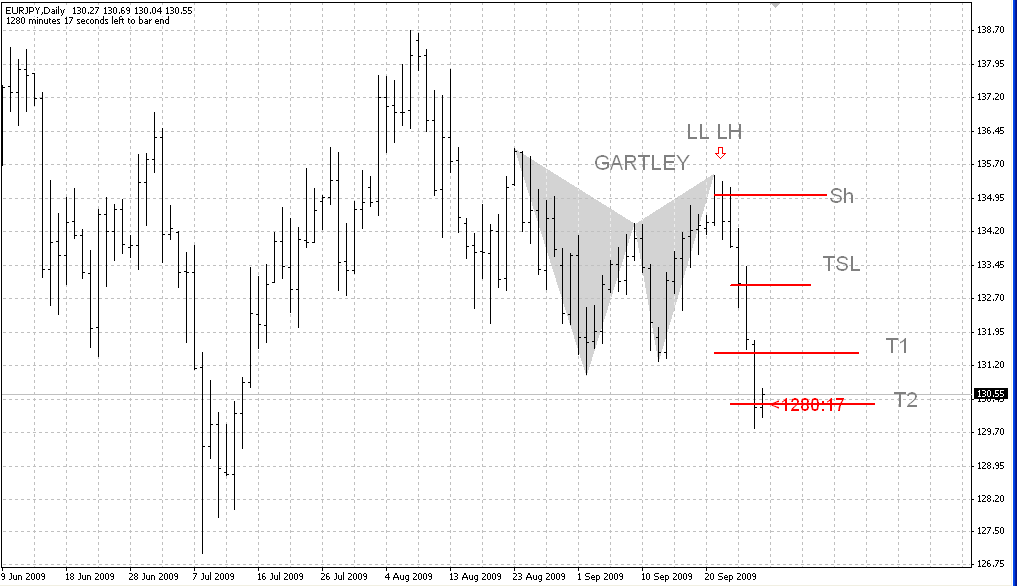
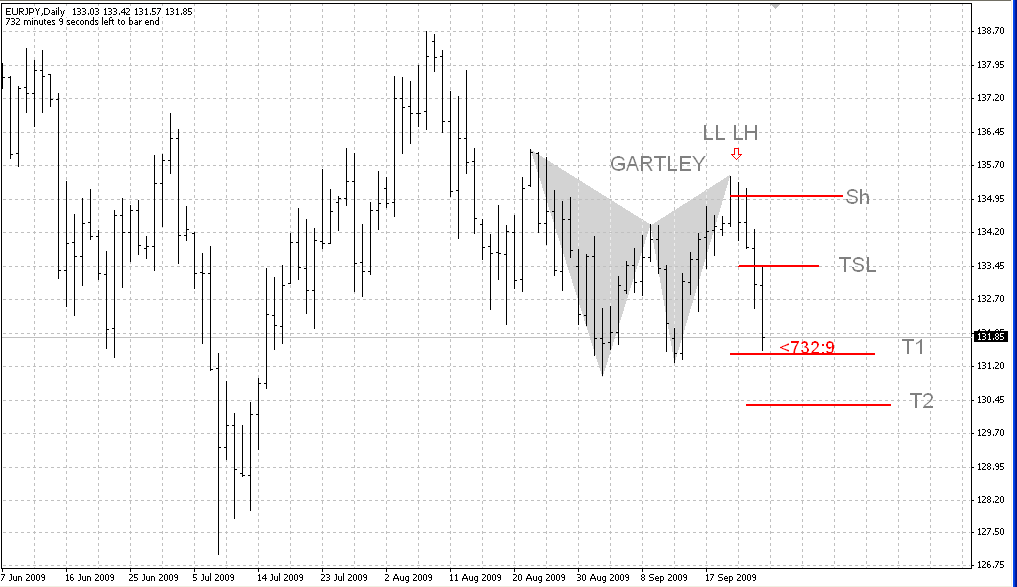
here is updated EURJPY covered at 130.05 500 pips in 6 sessions.
-
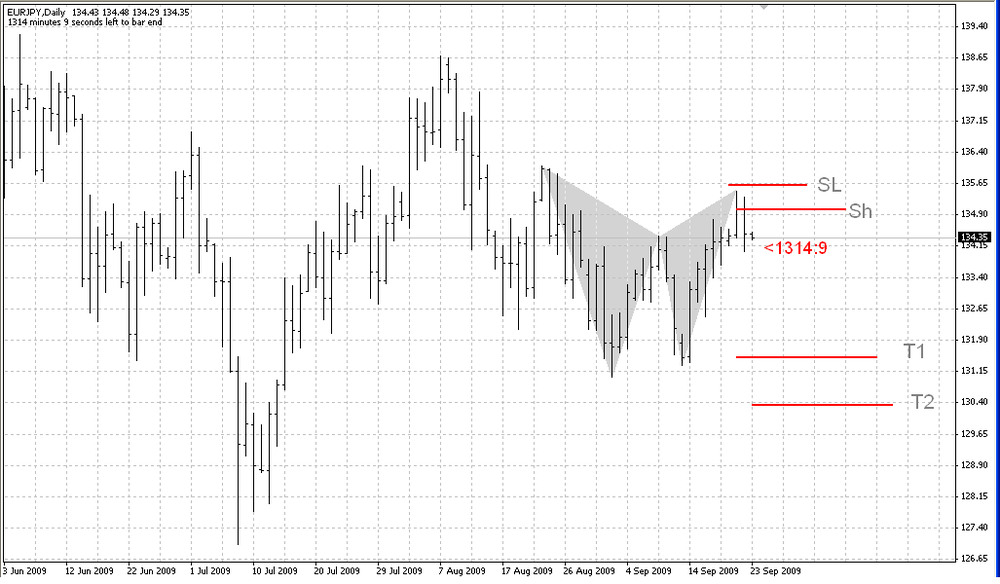
Great charts thalesHere is my Updated EURJPY Chart
trail SL to 135.25 Shorted 135.05 t1 131.50 t2 130.05
RRR (Risk Reward Ratio) 20:355 , 500 time period 5-8 sessions not bad
updated EURJPY chart +300 pips
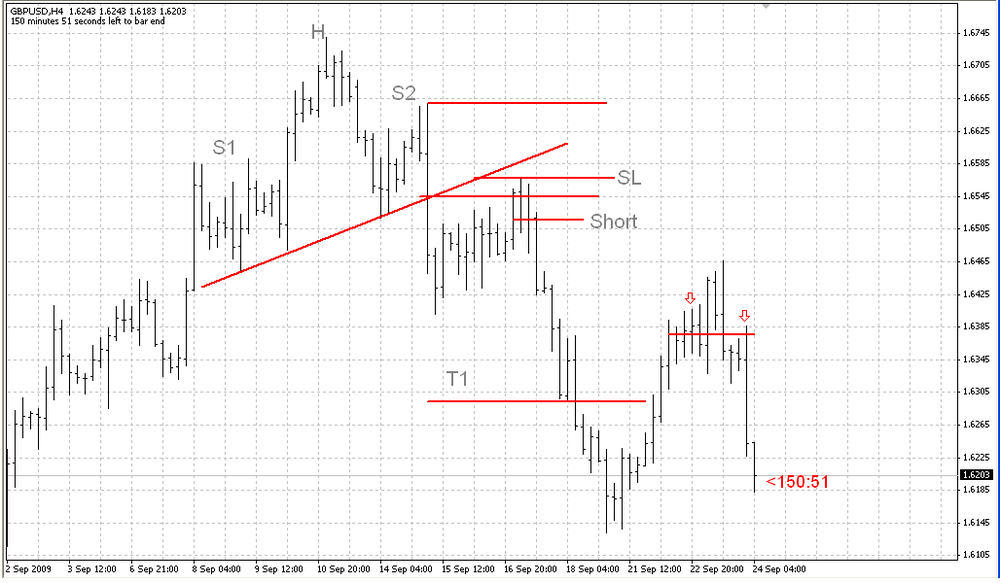
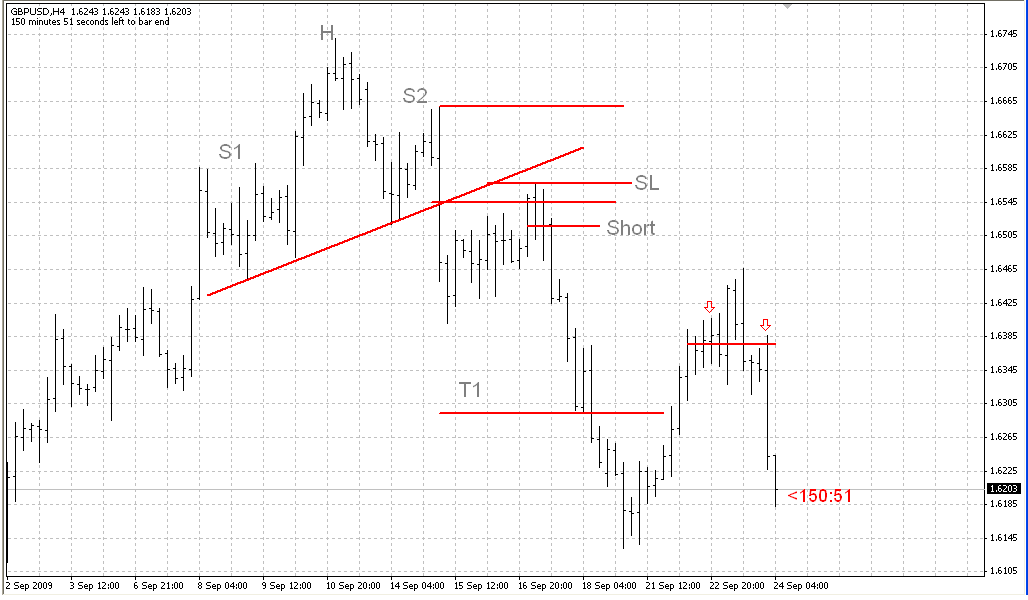
here is GBPUSD initiate long at 1.5950 expecting a bounce back upto 1.6375-80 zone
Regards,
TAQ
-
In GBPUSD case it looks like we are watching the same levels
if it close below 1.6100 it looks it can break its jan 09 low of 1.3512 within an year.
Regards,
TAQ
-
Great charts thales
Here is my Updated EURJPY Chart
trail SL to 135.25 Shorted 135.05 t1 131.50 t2 130.05
RRR (Risk Reward Ratio) 20:355 , 500 time period 5-8 sessions not bad
-
Hi TTM
start reading balan & will start paper trading some forex pairs for next three months need your help in understanding & applying the EW concepts
can you suggest any material which provides probable tgts in EWT so that i can calculate RRR before initiating any trade?
Time frame 15-min
Regards,
TAQ
-
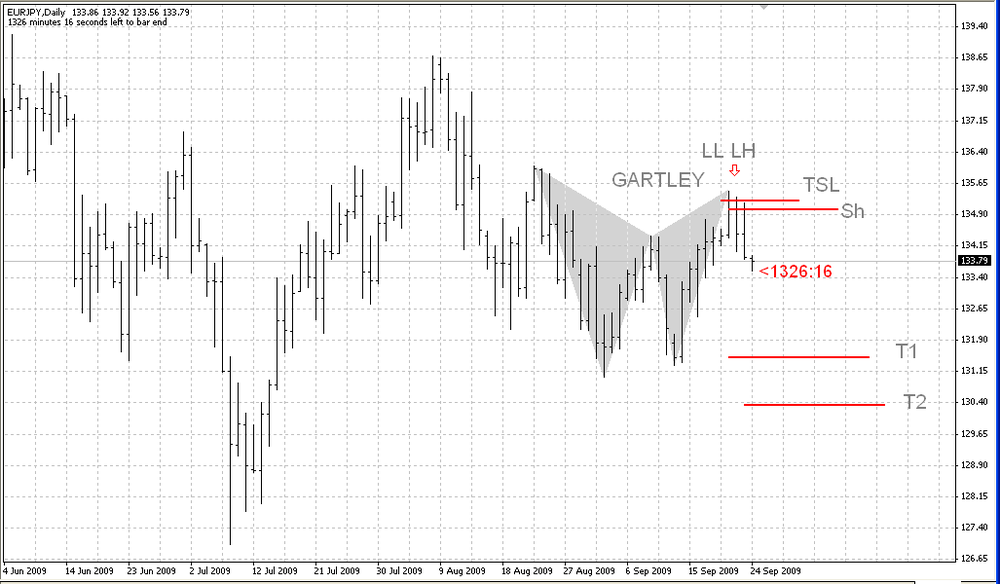
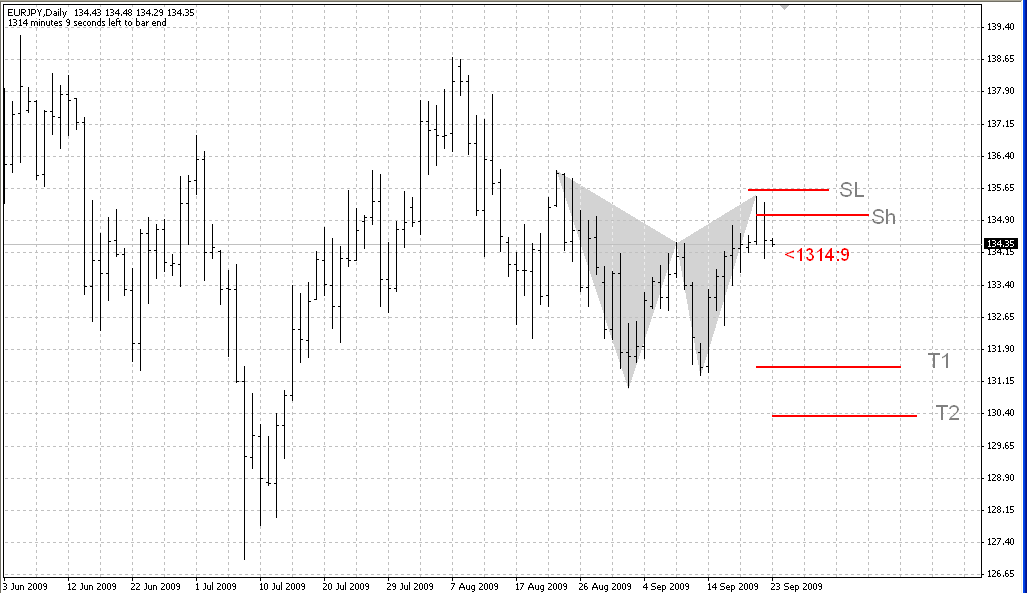
Here is what I am looking in EURJPY
Bearish Gartley entered short at 135.05
Probable tgts i am looking at 131.50 & 130.35
Regards,
TAQ
-
great thread TTM
I have two questions regarding EWT
1- Are you using any other indicator or something as a confirmation before initiating any trade or just on price based?
2- How you decide your stop loss is it fixed pip based or the last swing H-L in EWT?
-
Hi Suri Sir hello vishal
Gold Daily is looks like can go uptp 1030-35 zone but Silver Daily is made bearish butterfly pattern I am looking for tgts 14.70 & 13.80
let us see how it will unfold ?
Regards,
TAQ

-
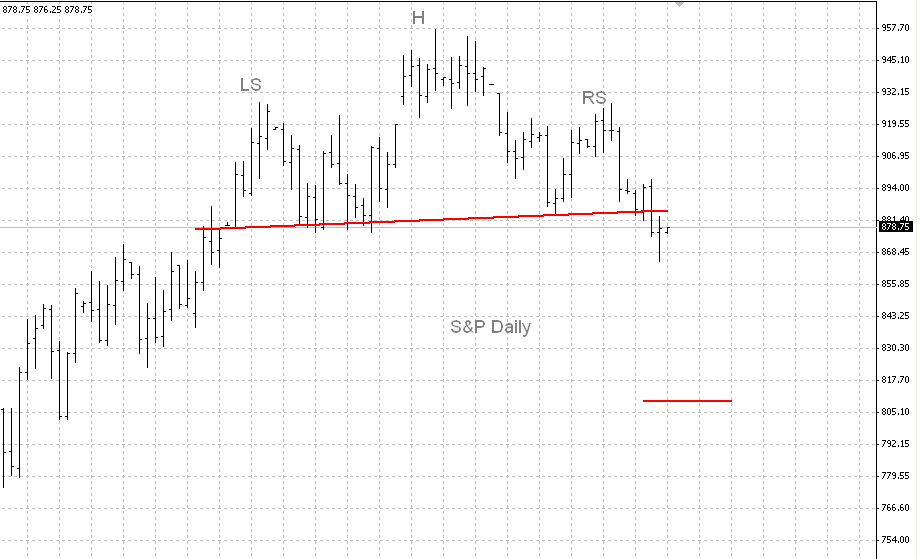
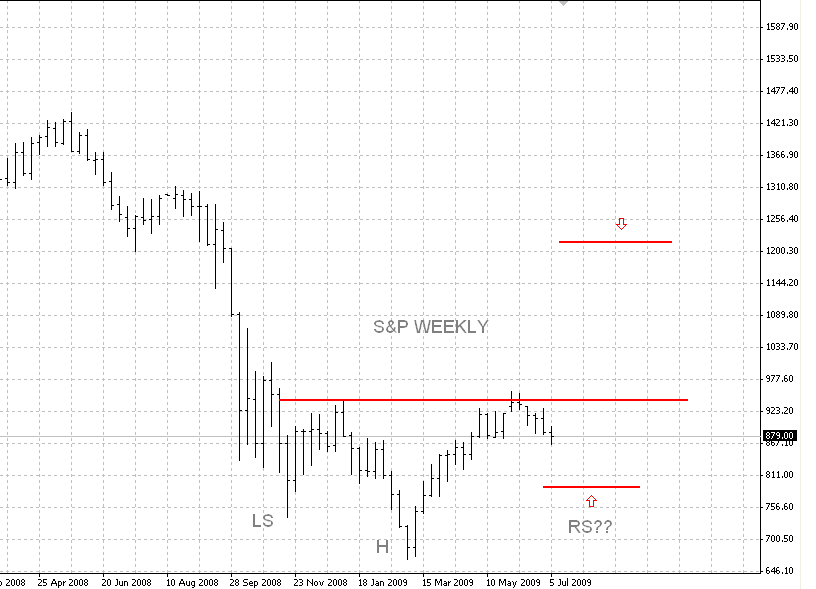
regarding S&P i am uploading Daily & Weekly chart
yesterday we break H&S neckline for probable tgt 807-10 let us see how it unfolds
once again thanks for your charts
-
Files are gone - any chance of hosting somewhere else?here you go
Episode 1 - Make Me a Trader
Hotfile.com: One click file hosting
Hotfile.com: One click file hosting
Hotfile.com: One click file hosting
Hotfile.com: One click file hosting
Hotfile.com: One click file hosting
Hotfile.com: One click file hosting
Hotfile.com: One click file hosting
Hotfile.com: One click file hosting
Episode 2 - Profit and Loss
Hotfile.com: One click file hosting
Hotfile.com: One click file hosting
Hotfile.com: One click file hosting
Hotfile.com: One click file hosting
Hotfile.com: One click file hosting
Hotfile.com: One click file hosting
Hotfile.com: One click file hosting
Hotfile.com: One click file hosting
Episode 3 - Traders
Hotfile.com: One click file hosting
Hotfile.com: One click file hosting
Hotfile.com: One click file hosting
Hotfile.com: One click file hosting
-
this one worked perfectly for me
Bank Of India Hrly


Patterns in S&P500 Index
in Technical Analysis
Posted · Edited by taq
Thanks Sir,
If possible an example would be appreciated.
Here What I understand from differnet readings & your points.Correct me if I am wrong.
For 5-point structure XABCD, X & A has to be major Swing High/Low & B & C intermediate SH/SL , Point D can be intermediate SH/SL (in gartley & bat) or Major SH/SL (in butterfly or crab).
Regards,
TAQ