
Welcome to the new Traders Laboratory! Please bear with us as we finish the migration over the next few days. If you find any issues, want to leave feedback, get in touch with us, or offer suggestions please post to the Support forum here.

Blu-Ray
-
Content Count
512 -
Joined
-
Last visited
Posts posted by Blu-Ray
-
-
Thanks guys for the support, it's much appreciated.
Cheers
Blu-Ray
-
You would need to have 2 lots of data running on your chart, then you could use, for example 5 min RSI as data2.
Hope this helps
Blu-Ray
-
blujust little another thing
if you can and if it not so hard to make the bars fat or thin if it for example more or less then 100 contracts so we can see if it push up hard or low
thanks
Sorry, I don't get what you're trying to portray, as we'll just be showing contracts over 100 anyway.
Cheers
Blu-Ray
-
Nice feature & appreciated, but if I want to ignore the business forum, I then have to go into 24 sub forums & ingore them........ can you not just introduce a feature within our user profile so that we can just ignore it.
I feel I speak for many on this subject, as the amount of new threads all on business, while it is impressive for the site to gain more traffic, it's really annoying if you only want to read trading related stuff on a trading based forum.
Cheers
Blu-Ray
-
Unsure if MC is the same as TS in this example, but you can use the following before you enter your strategy code, Easy Language will therefore not read that part if a position is already live.
If MarketPosition = 0 then begin
{enter strategy here}
Hope this helps
Blu-Ray
-
Hi Blu-RayI went through the Tradestation forum, and I found this code, please correct me if I'm wrong, I think it dispalys contracts based on users input. Would you mind having a look at it , I've plotted it on my machine, and I think it might do? But it would be better if it was like an oscillator, and color coding it i.e. green/red for buying / selling.
What do you think?
Thanks
Inputs:
Level  (25);

Variables:
VolQty  (0);

if BarType >= 2 then begin
if Volume >= Level then VolQty = Volume;
if Volume < Level then VolQty = 0;
end else begin
if Ticks >= Level then VolQty = Ticks;
if Ticks < Level then VolQty = 0;
end;

Plot1( VolQty, "Volume" )
Hi theman
That code won't do the trick, basically what that code is doing is showing volume over 25 for the whole bar, if the volume for the whole bar is less than 25 it will plot 0.
I know how to code it up, but have been struggling for time a little bit lately, I'll hopefully get around to doing it at the weekend.
Cheers
Blu-Ray
-
Hi
I tell you what I'll do, I'll meet you half way.......
I'll tell you what indicator it is and I'll leave it up to you to mess about with the settings, as I haven't got time to try and match them up with his specific settings**.
The indicator is called the "Ergodic" indicator and it's posted here within the forums
Hope this helps
Blu-Ray
** Hint : you might find that his settings change from chart to chart ...
a) because of different markets.
b) to appease the viewing public of his system.
-
hi bluraythnks so much for ur help..
wanted to ask u sumthing...how do u use the middleline along with the squeeze in ur trading...got sum idea from the website but its not complete.
if i use the middle line with the HMA & the squeeze without the countertrend mode on,will it be ok to trade on it...
unabl to find out how to synch the mid line along with the histogram for entries & exits.
I don't use these in my trading, I only coded them up. I would say that you'd have to forward test some ideas you have to trade them effectively.
Cheers
Blu-Ray
-
He is your man for the job.Just ask nicely.
 I think some around here take his work and generosity for granted.
LOL....... Thanks mate

-
Let me know what you're after and I'll see what I can do.
Cheers
Blu-Ray
-
Hey Blu-Ray, I'm working with your squeeze indicator, thank you for the download. Have one question: What is the significance of the "true/false" choice on the counter trend, and the change mid line? I primarily trade the mini-Dow, on 89 or 144 TICK charts, and would like to know the utility of modifying the "true/false" parameters.Thank you,
Bruce
Hi Bruce
This is indicator is based roughly the same as PBF's version. If you take a look at their website, it shows you the difference of having counter trend mode on ( basically changes the color of the histogram ) and also the change midline ( this is because you can have the "original squeeze" which is based on BB's and Keltner channels or their version of the midline which is based around a HMA ).
Hope this helps
Blu-Ray
-
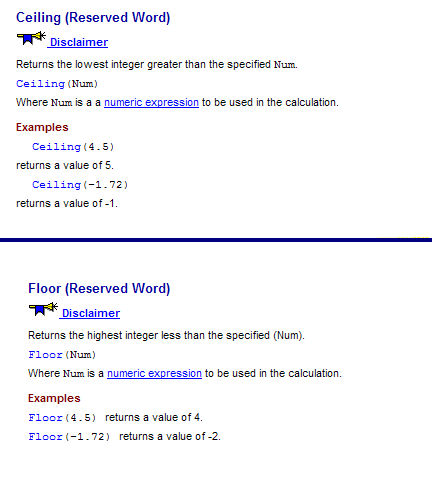
Hi ppl, im pretty new tothe easy language syntax but have some limited experience programming in general.The above code has got me stumped tho... i cant seem to figure out what "ceiling/floor" is. Is it a function? or a variable?
does "ceiling(length /2)" mean i want to create a variable named ceiling and assign the value of length/2? If im right, then the line where it goes "halvedLength = ceiling(length / 2)" is just strange cos its reassigning length/2 to ceiling twice.
thanks could use a little help
" Ceiling/Floor " are reserved words in Tradestation, below is the definition for them.
Hope this helps
Blu-Ray
-
Me not, because I've been bought this with data base implemented, so you can make a reset during running the session.http://www.codefortraders.com/Trades...idAskDelta.htm
:rofl:
I thought that this was your code for sale.
Cheers
Blu-Ray
-
I can't seem to open this .eld file. I'm using Multicharts which should be same as Tradestation. Do you have in word format? Thanks.Mike
You are winding me up ????????????????????????????????????????
just scroll up a few posts from yours..................................:o
-
Yes, it can be done.... leave it with me & I'll see what I can do.
Cheers
Blu-Ray
-
So is this Holy Grail indicator going to be useless when it's really choppy, just like almost everything else?Just an observation.............
They've invented an indicator called the "Holy Grail"....... so you would think they'd be pretty confident in it, to give it that name.....Well.......... if they were that confident in it, why are they now up to version 9 of it.........
Answer: it's NOT the Holy grail, it's just 4 or 5 indicators bunched together and they show charts of amazing setup's, but are finding out through different market conditions that it has its flaws like everything else, so they are now just curve fitting it.
and this leads to us to the obvious question:
If you'd invented the Holy Grail, would you sell it ?..................... of course not.
Hope this helps
Blu-Ray
-
I've got one from "lakdghshya"
-
thrunner,Thanks. so this is a simple moving average, obviously. I presume the same principles can be applied to exponential and weighted, right? I looked at the EL codes on TS for the simple and exponential MAs but I couldn't figure out, well, pretty much anything. Your code is so different from either of them that I can't figure out how to transpose the more efficient code to the exponential MA. Is it true that the exp. MA calculation is alot more complex (it's got exponents in it?)?
Taz
The code thrunner has posted is the same one as I've sent you via email, as the boys on the TS forums have done extensive testing via different propositions and found this one to be the most efficient.
The code I sent you for the EMA is also found to be the most efficient by the TS guru's, I'll post it here so anybody else interested can see the code.
{XAverage-Fast Indicator}
[sameTickOpt = true]
Inputs: Price(Close),
Length(8);
Vars: SmoothingFactor( 2 / ( Length + 1 ) ),
XAverageFAST( Price ) ;
XAverageFAST = XAverageFAST[1] + SmoothingFactor * ( Price - XAverageFAST[1] );
Plot1(XAverageFAST,"Ema");
Hope this helps
Blu-Ray
-
Blu-Ray,I appreciate your generous contributions and TS coding savvy. It is especially helpful to a TS newbie like me.
I am using your Squeeze and Squeeze Radar Screen indicators. I have loaded a 60 min ES and was wondering why the chart shows a squeeze fired at 10:30 am CST today. However, no alert has been posted in the RS. Any ideas or suggestions?
Thanks
Chaz
Obviously without seeing your set-up, it could be you've got the RS code setup differently to your chart code..... just a thought or alternatively have you got your RS set to enable alerts.
Cheers
Blu-Ray
-
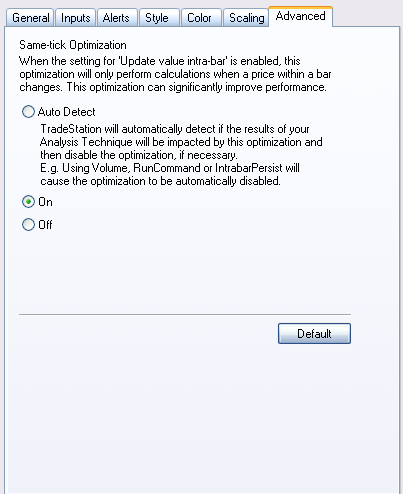
How do you know if an indicator is updating on every tick? I can't tell myself by looking at the code. Is there some way to tell the indicator only to update if the value changes, rather than every tick whether the value changes or not?
Hi Taz
I've sent you an email about it, but I'll quickly explain it here for anyone else reading this.
Format the indicator and select the "Advanced tab", then select the "On" rather than "Auto Detect"..... but there is a bug within TS 8.3 build 1631 so this feaute won't work unless you get the fix via request from TS.
Hope this helps
Blu-Ray
-
Have a search on this forum and there's a thread called " MP on Excel" and you'll find a file in there.
Cheers
Blu-Ray
-
You are not going to get it to change immediately as the MACDAvg could be sitting it between the values of the MACD of now & previous bar.
Cheers
Blu-Ray
-
Blu-Ray,Thanks for your responce. I made the change to the code as you suggested but it still gives the error message when trying to verify that it is expecting "(" at the >= operator. In all the code I looked at to try to do this I don't recall that I have see the operators in (). What is this trying to tell me?
Yes, sorry, my apologies, I didn't read it correctly, again it's a fault as it just says MACD without the bit afterwards:
Here this should work:
if MACD( Close, FastLength, SlowLength ) >= XAverage( Plot1, MACDLength ) then SetPlotColor (1,Cyan);
Personally I would have coded it up like this and it would have saved you a bit of trouble.
[LegacyColorValue = true];
{ CW MACD }
inputs:
FastLength( 12 ),
SlowLength( 26 ),
MACDLength( 9 ) ;
Vars:
MyMACD(0),MACDAvg(0);
MyMACD = MACD( Close, FastLength, SlowLength );
MACDAvg = XAverage(MyMACD, MACDLength );
Plot1( MyMACD,"MACD", Red ) ;
Plot2( MACDAvg,"MACDAvg", White ) ;
Plot4( 0, "ZeroLine", Yellow) ;
if MyMACD >= MACDAvg then SetPlotColor (1,Cyan);
Hope this helps
Blu-Ray
-
Well, you TS gurus were very helpful to me the other day and so I started to work on a MACD code to change the colors of the MACD when it is greater than the MACDAVG. I have attached what I have so far but it will not verify. It gives me a grammar error stating that it expects "(" at the place where my >= operator is. Can you suggest what I have missed?[LegacyColorValue = true]; { CW MACD } inputs: FastLength( 12 ), SlowLength( 26 ), MACDLength( 9 ) ; Plot1( MACD( Close, FastLength, SlowLength ), "MACD", Red ) ; Plot2( XAverage( Plot1, MACDLength ), "MACDAvg", White ) ; Plot4( 0, "ZeroLine", Yellow) ; if MACD >= XAverage then SetPlotColor (1,Cyan);This part is the culprit.
if MACD >= XAverage then SetPlotColor (1,Cyan);
As that sentence is saying if MACD is greater or equals to an xaverage, but it's not stating an xaverage of what.
Here's how it should look:
if MACD >= XAverage( Plot1, MACDLength ) then SetPlotColor (1,Cyan);
Hope this helps
Blu-Ray
Various Indicators (Squeeze,2FastMa's,etc)
in Trading Indicators
Posted
Yes, I am familiar with it, but have not coded it up. The version I posted here were based around 2 hull ma's.
Cheers
Blu-Ray