
Welcome to the new Traders Laboratory! Please bear with us as we finish the migration over the next few days. If you find any issues, want to leave feedback, get in touch with us, or offer suggestions please post to the Support forum here.

Blu-Ray
-
Content Count
512 -
Joined
-
Last visited
Posts posted by Blu-Ray
-
-
Hey, Blue Ray...A Big Thank You, for these PBF indicators. I am trying to port the code over to Sierra Chart (C++), and not sure where to start for PBF_OSOB indicator which is in the trend bars panel. Do you have any idea...?BTW, Thanks again,
Mark.
Hi Mark
The OSOB looks like it's based off the ergodic indicator, I would imagine there should already be a version for sierra chart for you to then modify.
Cheers
Blu-Ray
-
I know this is not the ideal solution since you've already purchased TS & Owndata, but why don't you give MultiCharts a try, they're offering a free 30 day trial.
That way, you can have a look at range bars and even play about with easy language strategies and go from there.
Just a thought .......
Cheers
Blu-Ray
-
Hi, no it will not plot momentum bars either.I have tried every possible combination with the datafeed and ts settings blue ray, but they still will not plot.
If anyone could point me in the direction of an indi that will construct range bars I would be most gratefull
Can you post a screenshot of your settings and also one of your chart to show what it's plotting please.
Cheers
Blu-Ray
-
Blu-Ray1/
the Long term chart is my daily chart (the exporting chart)
the Short term chart is my 60 min chart, (the importing chart)
2/
I will try your example.
Can you explain me why was incorrect in my code
why:
- On your first indicator , replace the words ADE.BarInterval to ADE.Daily
- on your second indicator replace the word interval to ADE.Daily
With ADE.BarInterval it is looking at the exporting chart for a number based in minutes, but since the exporting chart is a daily, it's not based in minutes, hence the reason they made the function ADE.Daily.
3/
"Just out of curiosity, why are you using ADE for the pivots when you could get the same results using a normal pivot point indicator ...... or are you just wanting to learn about ADE ?"
I want to learn about ADE and how importing daily values in a 60 min chart without ADE
Nuno
Good to hear your keen to learn about ADE.
The reason I was asking is because on certain things, for example daily pivots, you can get that information straight from a 60 min chart using the H,L,C from the previous days worth of data like the floor pivots indicators does.
Cheers
Blu-Ray
-
On your first indicator , replace the words ADE.BarInterval to ADE.Daily in these lines
Value10 = ADE.PutBarInfo(Class, GetSymbolName, ADE.BarInterval, ADE.BarID, InfoMap);


to

Value10 = ADE.PutBarInfo(Class, GetSymbolName, ADE.Daily, ADE.BarID, InfoMap);
and on your second indicator replace the word interval to ADE.Daily like this :
Value9 = ADE.GetBarInfo(Class, GetSymbolName, Interval, ADE.BarID, InfoMap);

to

Value9 = ADE.GetBarInfo(Class, GetSymbolName, ADE.Daily, ADE.BarID, InfoMap);
This should work okay.
Just out of curiosity, why are you using ADE for the pivots when you could get the same results using a normal pivot point indicator ...... or are you just wanting to learn about ADE ?
Cheers
Blu-Ray
-
Nuno
What time framed charts are you putting these on, so I can test it out.
Cheers
Blu-Ray
-
nab999
I think you'll need to open quote manager for Owndata and then edit your symbol and adjust the price scale accordingly.
This happened to me in the past when using Inifinity data through MultiCharts...... so just thought it might be the same problem...... worth a go.
Cheers
Blu-Ray
-
To get it working correctly, you need to seperate the class string, for example, instead of this :
Class("Pivot&Support1&Support2&Support3&Resistance1&Resistance2&Resistance3")change it to this:
Vars:
Class("Pivot"),
Class1("Support1"),
Class2("Support2"),

and so on........
also you would need to number the infomap's too, to match the relevant class's.... for example :
Vars:
Class("Pivot"), InfoMap(MapSN.New),
Class1("Support1"), InfoMap1(MapSN.New),
Class2("Support2"), InfoMap2(MapSN.New);


Value1 = MapSN.Put(InfoMap, "Pivot", Pivot );
Value2 = MapSN.Put(InfoMap1, "Support1", Support1 );
Value3 = MapSN.Put(InfoMap2, "Support2", Support2 );

Value4 = ADE.PutBarInfo(Class, GetSymbolName, ADE.BarInterval, ADE.BarID, InfoMap);
Value5 = ADE.PutBarInfo(Class1, GetSymbolName, ADE.BarInterval, ADE.BarID, InfoMap1);
Value6 = ADE.PutBarInfo(Class2, GetSymbolName, ADE.BarInterval, ADE.BarID, InfoMap2);
Then on the receiving indicator, make sure the variables for the class & infomaps are matched to the send indicator....... and then alter your code so the infomap's match like this :
Value1 = ADE.GetBarInfo(Class, GetSymbolName, Interval, ADE.BarID, InfoMap);
Value2 = ADE.GetBarInfo(Class1, GetSymbolName, Interval, ADE.BarID, InfoMap1);
Value3 = ADE.GetBarInfo(Class2, GetSymbolName, Interval, ADE.BarID, InfoMap2);

Pivot = MapSN.Get(InfoMap, "Pivot");
Support1 = MapSN.Get(InfoMap1, "Support1");
Support2 = MapSN.Get(InfoMap2, "Support2");
Hope this helps
Blu-Ray
-
Hi Sim
Here you go, try this :
Variables:
mytime(0),mydate(0),ID(0),OldID(0);

If barnumber=1 then begin
mytime=time;
mydate=date;
end;

If TL_Exist(OldID) then TL_Delete(OldID);

if lastbaronchart then begin

ID = TL_New(MyDate, MyTime, Close, Date, Time, Close);
Value1 = TL_SetExtRight(ID, True);

OldID = ID;

end;
As you can see in the code.... I've put the TL Delete function before you plot your new TL and also before the lastbaronchart bracket, so it will always delete the previous ticks trendline no matter if the bars change.
Hope this helps
Blu-Ray
-
The problem I am having is getting it to buy data1 when the Tradeband is below the Lowerband and them comes up and touches the Lowerband, enter at market, i.e. not have to wait for next bar at market.
Ok try this.
if Tradeline crosses above Lowerband then Buy next bar at market;
if Tradeline crosses below Upperband then Sellshort next bar at market;
Also enable intrabar order generation..... meaning it will buy/sell at market on next tick of bar rather than waiting for a new bar to form.
Hope this helps
Blu-Ray
-
Hi Blue Ray,Could you suggest how the code can be modified, so that it will take a trade on data1when the bollinger bands ( based on data1/data2) are hit by the TradeLine (based on data1/data2) please.
Many thanks for your help with this
The easiest way for starters is to just purchase at market..... then you'll be able to see your entries..... then you can refine them from there if needs be. It may occur that you need to define a spot, for example, when the tradeline crosses the bollinger band you might need to reference a price on data1 at the time of the cross then set that as your price to buy/sell.
Here's the code for market :
if Tradeline< Lowerband then Buy next bar at market;
if Tradeline> Upperband then Sellshort next bar at market;
Cheers
Blu-Ray
-
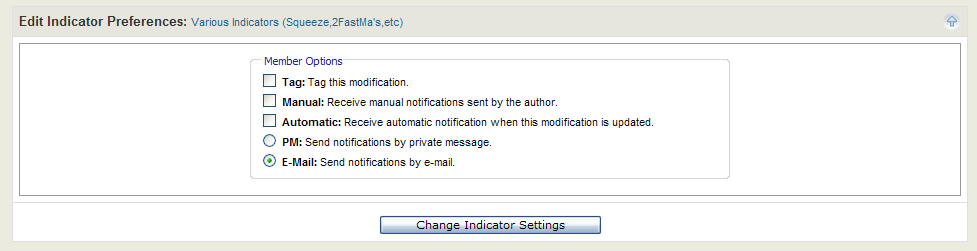
you can do it yourself... just click on "Edit Settings" at the top right column of the 1st post.Thanks Tams, I tried that, but when I click on "Edit Settings" ... it only gives me these options.
-
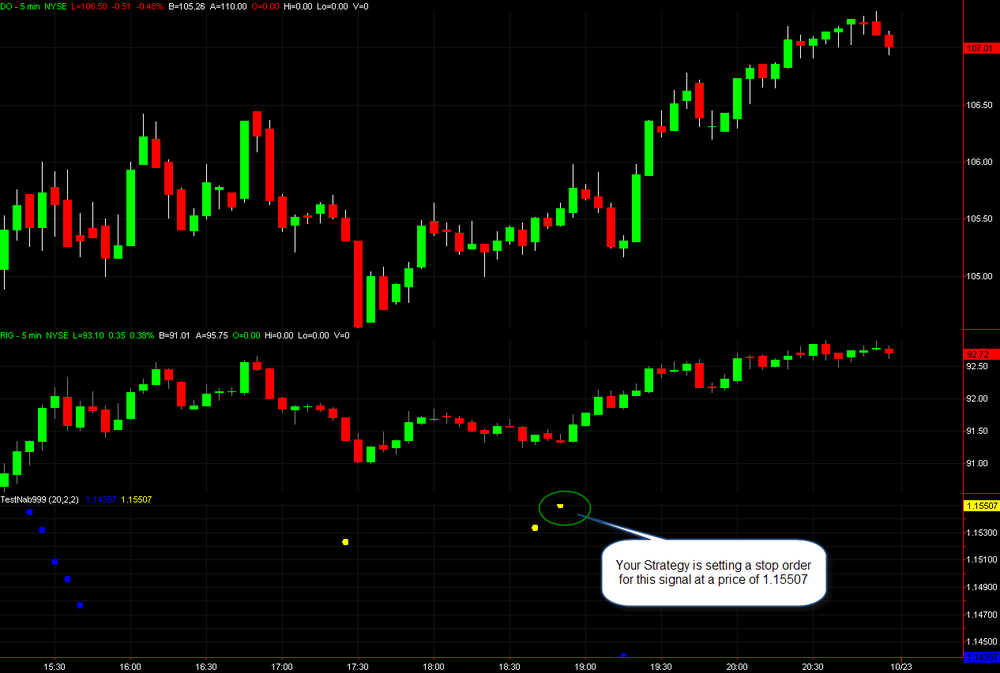
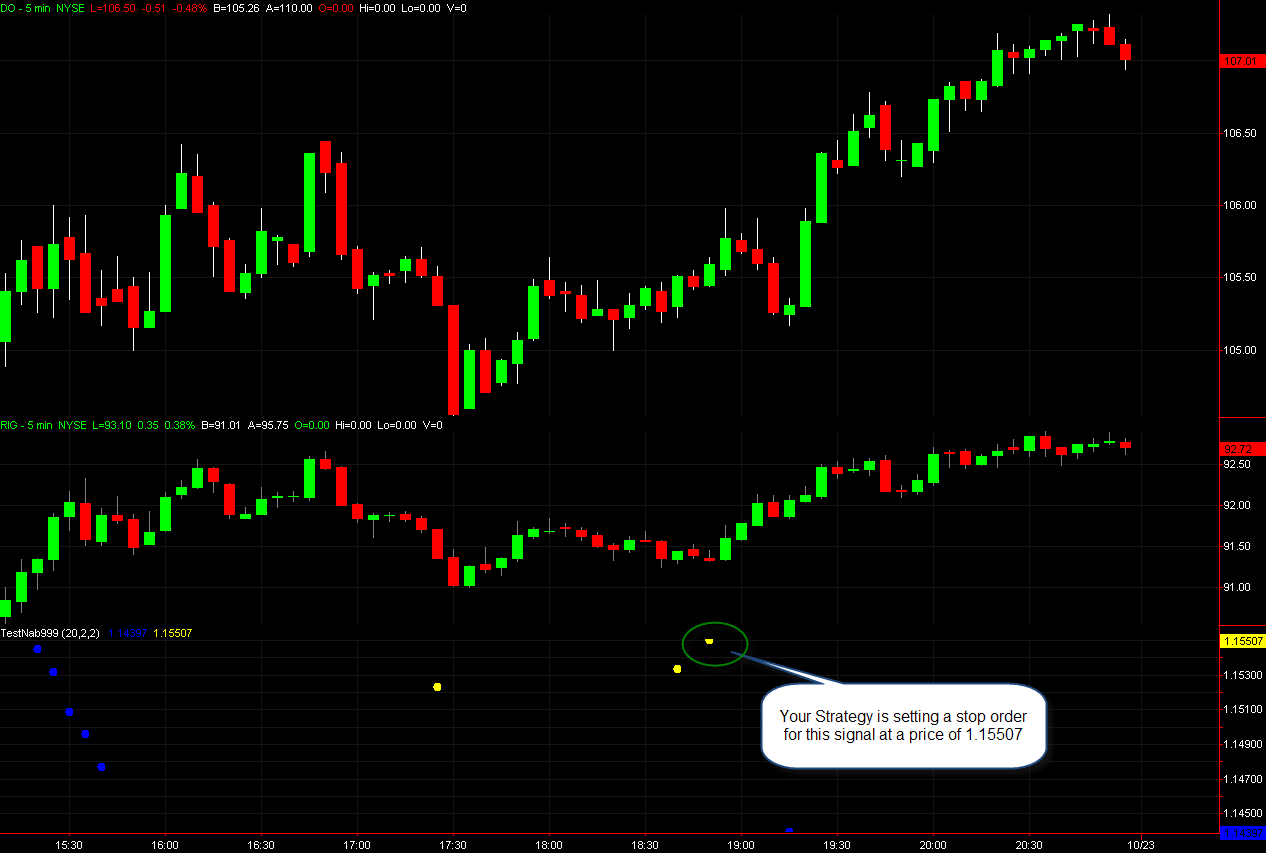
Nab999
The reason it's not placing any trades is because of this :
BollingerPrice=Close of data1 / close of data2;
TradeLine= Close of data1 / close of data2;
As you can see in my attached chart..... When it's plotting a signal, the ACTUAL value of it is nowhere near where your data1 price is at.
It's firing at a value of 1.15507 but data1 ( DO ) is running at the 105 price band..... so your code is placing the stop orders, but price is never going to hit them.
Hope this helps
Blu-Ray
-
BlackEagle.........
Please............ Read the whole thread..................
MT4 indicators are posted within this thread !!
JPx2..........
Please............ Read the whole thread..................
Ninja questions have been asked loads of times and I only responded a few pages back
Hint : a bit of work on your side goes a whole long way !!
Cheers
Blu-Ray
ps. Thanks Tams for the suggestion about adding Tradestation & Easy Language to the page, I'll ask James to add it.
-
What you're best off doing is......
Post a chart ( zoomed in ) showing BOTH symbols and timeframes with the indicators on, annotate the chart where there should be an entry and we'll have a better idea of what's what.
Cheers
Blu-Ray
-
Hi Bluray, since you are the master of indicators and have indepth knowledge of indicators. I am using Ninja Trader, is it possible you can guide me how to convert this Squeeze indicator for Ninja Trader platform.Thank you, but unfortunately I only code in Easy Language.
There's a version within this thread that has been posted for Ninja, also if you click on Google and type in " PBF Squeeze for Ninja" ............ you will find your answer on the NinjaScript forum.
Cheers
Blu-Ray
-
Sorry to beat this very dead horse... posted the code getting errors:'(' Expected
errLine 13, errColumn 26, errLineEnd 13, errColumnEnd 26
For the record, i've downloaded and compiled all the other indicators with no issues, however my main squeeze seems to want nothing to do with me.
Hi lonew0lf
Here's the code now compiled, it was due to an error of me not posting the code within the selected code box and also it needed the jthma function compiling too.
Cheers
Blu-Ray
-
Read through the thread prior to posting. All the other indicators loaded wtihout issue, however the "squeeze" when importing shows nothing in the import studies field... in other words, it doesn't have a chance to compile and generate errors.If anyone has gotten it to work in MC, please let me know, thx.
Why don't you copy and paste the code and then try to compile it from there....( ps. code is shown earlier in this thread )
Cheers
Blu-Ray
-
I also agree, as I replied to his text problem and gave a solution..... and still no reply to say it solved it or not.
-
Blu Ray , thanks for the quick reply, I really appreciate your hard work, I ran my code intrabar, I added the code you discribe, the alert on the cross is fine, but the near does not seems to be working, 5 ticks above and below should be fine, here is what I did, can you see where the errors at, thanks again...Inputs:
Threshold (6);
Ed
I've tested it and it works fine for me, the only thing I can think of is that you've set your inputs to 6 ticks away instead of 5.
Cheers
Blu-Ray
-
If you're wanting text to stay historically on your chart then, here's a way.
{ It will only print text on the closing tick of the bar }
if Barstatus(1) = 2 then
If (cti = 0 and Value1 > Value1[1] and Value2 > Value2[1] and barColor = barColor[1]) or
(cti = 0 and Value1 > Value1[1] and Value2 > Value2[1] and barColorpl = barColorpl[1])
then ID = Text_New(D,T,L-range, "S:");
Hope this helps
Blu-Ray
-
Just food for thought .............. if you're ever stuck on coding issues... the best thing to do is write it down in front of you.
Then think.... " How can I get around that? "... or ... " Is there a function / reserved word that would do the trick for me? "
Then open up the Easy Language dictionary within TS and just type a word roughly that will solve you problem.
For example your last query.
How can I get the text to disappear.
Type text into the dictionary and some results will appear, scroll down and see whats available that might match your needs within easy language.
This way you'll build up your own knowledge of what words to use in the future.. keep doing this and you'll soon be flying.
This is how I learned and it's great info to know.
Hope this helps
Blu-Ray
-
hmm maybe some quick syntax help here please as when i add this to another alert with text it causes problems!if
(cti = 0 and Value1 > Value1[1] and Value2 > Value2[1] and barColor = barColor[1]) or
(cti = 0 and Value1 > Value1[1] and Value2 > Value2[1] and barColorpl = barColorpl[1])
then begin
cti = 1;
Plot4(low,"test",green);
ID = Text_New(D,T,L-range, "S:"); < ------------ how do i get rid of this if the plot is removed???
end
else
noplot(4);
end;
This should do the trick :
if (cti = 0 and Value1 > Value1[1] and Value2 > Value2[1] and barColor = barColor[1]) or
(cti = 0 and Value1 > Value1[1] and Value2 > Value2[1] and barColorpl = barColorpl[1])
then begin
cti = 1;
Plot4(low,"test",green);
ID = Text_New(D,T,L-range, "S:");
end else begin
noplot(4);
Value1 = Text_Delete(ID);
end;
Hope this helps
Blu-Ray
-
Try this:
if cti= 0 and Value1 > Value1[1] and Value2 > Value2[1] and barColor = barColor[1]
then Plot4(low,"testy",green) else NoPlot(4);
Various Indicators (Squeeze,2FastMa's,etc)
in Trading Indicators
Posted
Thanks CH888
No it's not me...... a little bit annoying that someone is profiting from my goodwill. They're free files so I presume I'm helpless to stop him selling them aren't I ?
Cheers
Blu-Ray