
Welcome to the new Traders Laboratory! Please bear with us as we finish the migration over the next few days. If you find any issues, want to leave feedback, get in touch with us, or offer suggestions please post to the Support forum here.


winnie
-
Content Count
141 -
Joined
-
Last visited
Posts posted by winnie
-
-
Is anyone would tell me how to make IB to close all my open net position in market close ?
Thanks
Winnie
-
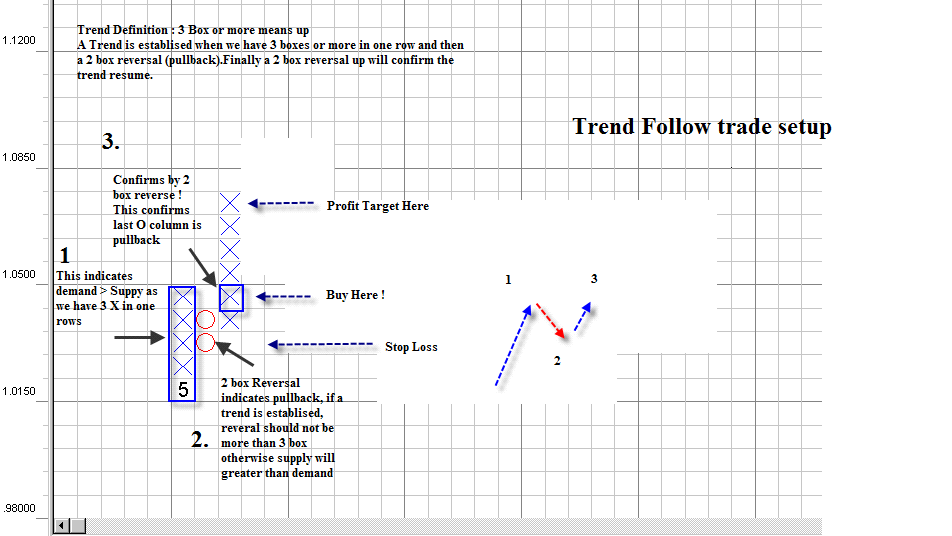
Last time, I have posted a chart showing how hard to make money using the classic point and figure chart setup. This time I have a attached a chart shows my definition of trend and how to trade with the trend.
Hope this can generate more new idea in point and figure chart.
Thanks for all
-
I have modified my system. This is my new approach on point and figure chart.
__________________________________________________________
Performance Since May,2010
Forex :
USD : CAD Dollar Net Profit: 560 pip
USD : JPY Dollar Net Profit: 280 pip
AUD : USD Dollar Net Profit : 700 pip
EUR : USD Dollar Net Profit : 700 pip
Futures :
YM Net Profit : -100 point
_____________________________________________________
Current Position :
Sell US: JPY at 84.00, stop :85.4, Profit Target : 81.20
-
In calculate the profit target, I use risk : reward ratio to determine. If I risk 2 box, my profit target will be 2 X 2 = 4 box from my entry. In 1:2 risk:reward ratio, you need only 40% winning % to win.
Just read some book on point and figure but just get a basic understanding is OK. Do not put too much focus on the buy /sell setup. Just get a feel and feel free to form your own strategy.
-
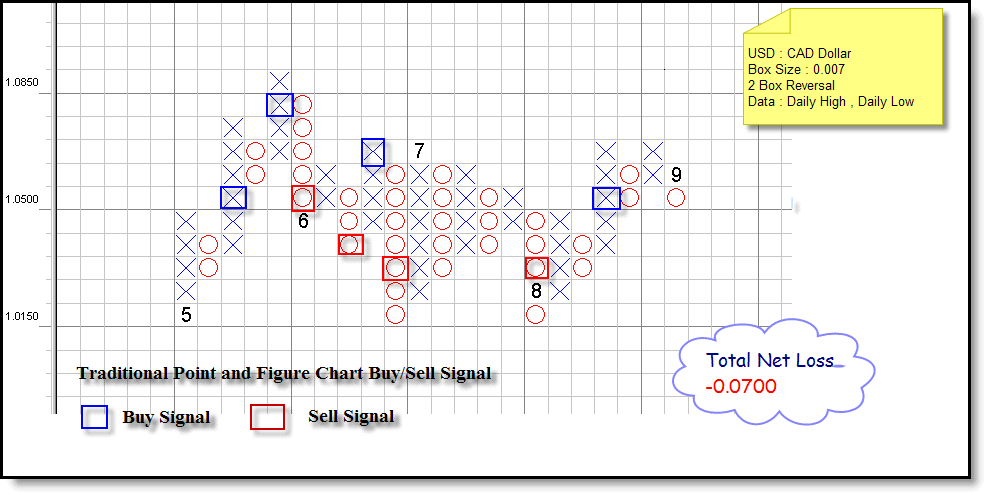
There is no fix rule to determine the box size. It depends on you how close you want to follow the market. If you are a day trader and like to catch small swing, you would need a small box size like : 0.003. However you are a position trader and only use daily data, you need a bigger box size. I could not watch the forex market 24 hour, so I use a box size of 0.007 in most market. You can change the box size and adjust it according to your need. The smaller the box size , the more swing you can trade and more noise and false signal. This is always a trade off, just find a comfortable level. No magic number as everything work sometime and don't work sometimes.
For classic point and figure chart trading method, buy signal occurs when last X is higher than previous column X's high. On the other hand, sell signal occurs when last O is lower than previous colomn O's low. It is a stop and reversal breakout system. Attached is a chart shows how this signal occur in US : CAD . You can see it only works in trending market and could not work in sideway.
This is why people give up the point and figure chart as market move sideway most of the time. The point is not on the point and figure chart but on its buy/sell setup. Point and figure chart just show how the market doing !
-
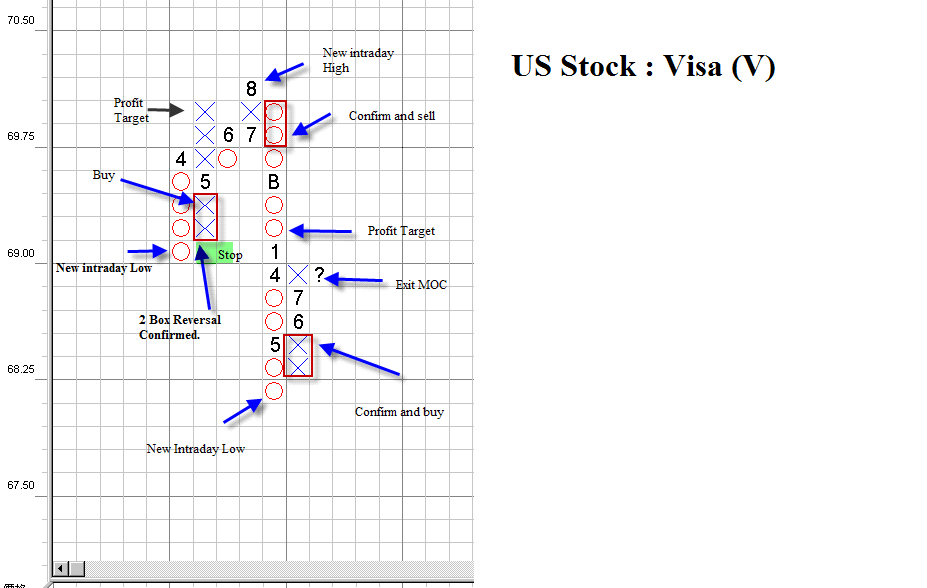
A Simple day trading system, an example show how it works in US stock : Symbol: V
This system trade when market make new intraday high and wait for confirmation signal to sell it. On the other hand , when market make new intraday low, wait for confirmation signal and then buy it.
Use 1 min data and box size :0.15, 2 box reversal
Risk : Reward Ratio : 1:2 Risk : 0.3 Proft Trarget : 0.6
Anyone interested in it ?
-
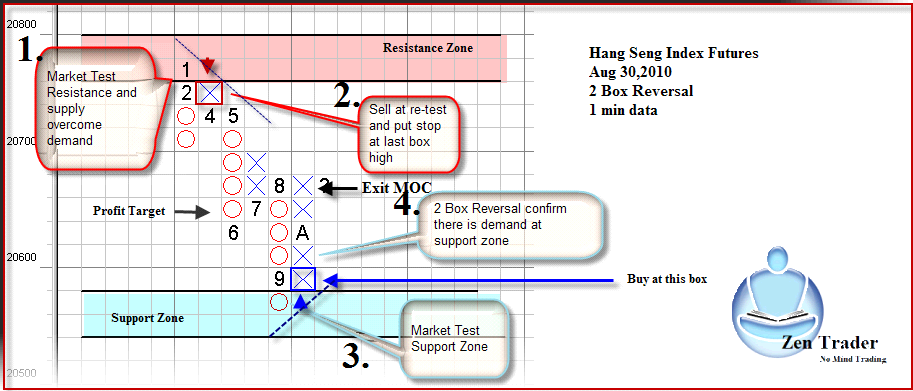
Thanks and I also use support and resistance zone to trade intraday swing. As I live in Hong Kong and could only trade the Hang Seng Index futures intraday. Attached is a chart show how I trade yesterday.
-
Would you mind to share how you trade?
-
Hi Sergio,
This is come from a simple breakout system. Instead of using bar chart or candlestick chart, I use point and figure chart as basic, however I do not use common point and figure chart pattern. Actually, I do not think there is any pattern in the market. No pattern does not mean we could not trade. What I am doing is just listen to the market and a "simple mind". If market go up, I buy. If market go down , I sell. I don't know where the market will stop. What I could see is the "NOW " moment , no thinking, no feeling and a simple "Zen Mind".
The next thing I need to do is what is mean by up and what is mean by down. If you are a day trader, you can use a very tight value to determine it but you will switch many times. For position trading, I use a wide box size in point and figure chart. If the point and figure chart is in "X", it means up. If the chart is "O", it means down.
Point and figure is nothing special, it only a tool to help you filter out the noise and shows a clear picture to you. You can change the box size to fit your need. There is no magic number in it. This is why I do not want to sell anything because it is too simple ! It is only your mind make it complex.
Hope this give you a new thinking or "no thinking" to the market.
Just a Zen mind
Winnie
-
Updated :
*****************************************************************************
Forex :
Euro Dollar (Position still open)
Last Signal : Sell
Date: Aug 10,2010
Entry Price : 1.31000
Reversal Price : 1.28000 (Exit short and reverse to buy)
**************************************************************************************
AUD Dollar
Next Signal:
Buy at 0.900 with stop at 0.8800
******************************************************************************************
US : CAD Dollar (Position still open)
Last Signal : Buy
Date : Aug 20,2010
Entry Price : 1.0400
Reversal Price : 1.0400 (Close Long and reverse to Short)
************************* ************************* ************************* *****************
US:JPY (Position Still open)
Last Signal : Sell
Date : July 17,2010
Entry Price : 87.00
Reversal Price : 86.00(Close Short and Reverse to Long)
************************* ************************* ************************* *****************
Index Futures
YM (Sept)
Next Signal:
Buy at 10200 with stop at 10000
**********************************************************************************************
-
Position Updated (Aug 25,2010)
YM
Short at 10200, Exit at 10000 (Aug 24,2010) P&L = +200
New Order:
Buy at 10200 stop, Stop Loss = 10000
-
Position Updated : Aug 24,2010
************************* ************************* ***************
YM (Sept)
Long at 10400, Exit at 10200( P&L = -200) [Aug 19,2010]
Short at 10200, Profit Target 10000, Stop 10400 [Aug 19,2010]
************************* ************************* ***************
USD : CAD
Exit Short at 1.0400 (P&L = 0) [Aug 20,2010]
Long at 1.0400 , Stop Loss 1.02
**************************************************************************
-
Position Updated : Aug 18,2010
*****************************************************************
YM (Sept)
Long at 10400, stop loss 10200
*****************************************************************
-
This is my trading system signal and just want to share if anyone interested in it.
Forex :
Euro Dollar (Position still open)
Last Signal : Sell
Date: Aug 10,2010
Entry Price : 1.31000
Reversal Price : 1.30000 (Exit short and reverse to buy)
*************************************************************************************
AUD Dollar
Last Signal : Buy
Date : July 9,2010
Entry Price : 0.8600
Exit Price : 0.9000 (+0.0400)
Exit Date: Aug 16,2010
Next Signal
Buy at 0.9100 with stop at 0.8900
******************************************************************************************
US : CAD Dollar (Position still open)
Last Signal : Sell
Date : July 10,2010
Entry Price : 1.0400
Reversal Price : 1.0400 (Close Sell and reverse to Buy)
********************************************************************************************
US:JPY (Position Still open)
Last Signal : Sell
Date : July 17,2010
Entry Price : 87.00
Reversal Price : 87.00(Close Sell and Reverse to Buy)
********************************************************************************************
Index Futures
YM (Sept)
Last Signal : Sell
Date : Aug 11,2010
Entry Price : 10400
Exit Price : 10200 (+200 point)
Exit Date : Aug 16,2010
Next Signal:
Buy at 10400 with stop at 10200
*******************************************************************************************
Will Continue to post it if new position or new signal generated ? Hope this could help.I do not want to sell anything.
Thanks
-
Dear Eiger,
Thanks for your posting. I think the hardest part in using VSA is it makes us focus too much on the current few bars instead of the whole picture. In your diagram, I will focus on picking the bottom to buy instead of waiting for the test of upthrust to sell. How could we deal with such problem ? Just like Tuesday's ES market, will you focus on picking the top as the market seems does not have upside momentum in the afternoon. Do you have any rule for the background ?
Anyway thanks for your help and posting.
Winnie
-
Dear all,
In analysis the US stock market, which index should we use in analysis the general market condition. Some use Dow Jone Index and some people use NYSE index. Which one should we use ? Where could we get the daily volume chart in web ? In Bigchart.com, I could get the price volume chart of NYSE but the volume is delayed for one day ?
thanks for all your kind help
Winnie
-
Dear all,
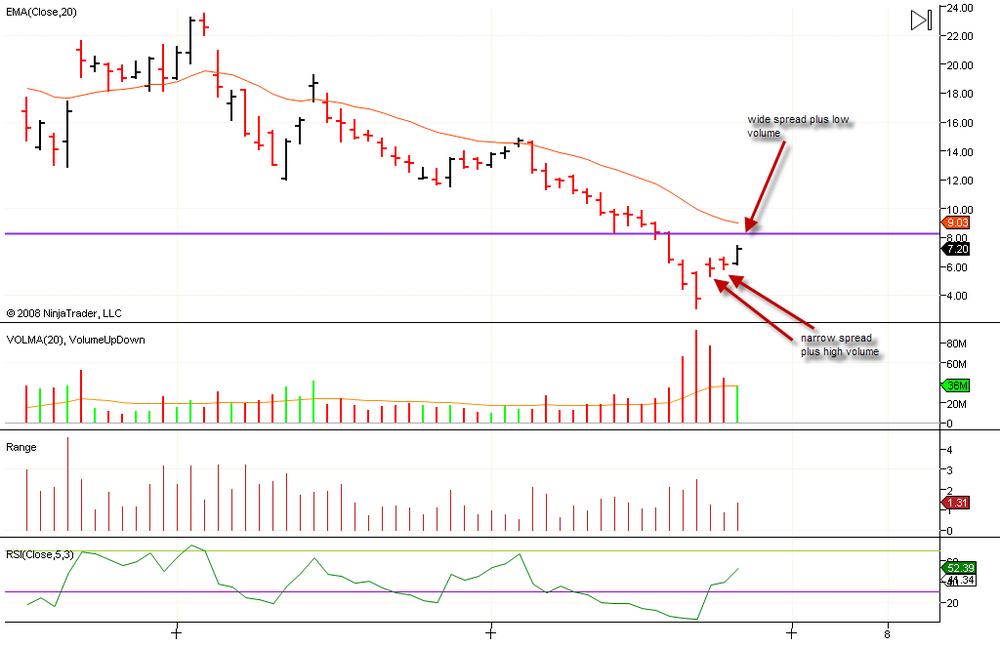
Thanks for all your kind advise. Attached is the daily chart of citigroup which I wants anyone of you can make a conclusion in it. In last three bars,we have :
two bar with narrow spread but high volume,
one bar with wide spread but low volume.
Combine with its background, could we draw a view on it ?
Thanks
Winnie
-
Would anyone tell me what does an up bar which has wide spread but low volume in an downtrend background actually means ? Is it a weak bar ?
Thanks
Winnie
-
Dear Eiger,
What is mean by Creek ? Is it a trendline ?
Thanks
Winnie
-
Dear JJ,
I have one question for you. If you see an no demand bar appears in your resistance area, but it close at the high and the next bar take out the high of the no demand bar first , will you still sell at the low of the bar ?
Thanks for your time
Winnie
-
Dear JJ,
Would you tell me when is the morning session of your trading period ? When is it end ?
Thanks
Winnie
-
Dear JJ ,
Thank for sharing your trading idea. Would you close the short position if the immediate close after the no demand bar is an up close instead of down close ?
Thanks
Winnie
-
Dear all ,
If we are in a down trend and we find a "no demand" sell signal in the support price level, for example : pivot or yesterday low. Should we still take the short signal ?
Thanks
Winnie
-
Dear jjthetrader,
You are very helpful and positive. I need to find a way which suitable to be and your advise is very good .Thanks for your kind help.
Winnie

Simple Trading System Signal
in Swing Trading and Position Trading
Posted
Thanks BlowFish for your response.The book should be "The Definitive Guide to Point and Figure ".It is one of the best book on point and figure.