
Welcome to the new Traders Laboratory! Please bear with us as we finish the migration over the next few days. If you find any issues, want to leave feedback, get in touch with us, or offer suggestions please post to the Support forum here.

MidKnight
-
Content Count
677 -
Joined
-
Last visited
-
Days Won
2
Posts posted by MidKnight
-
-
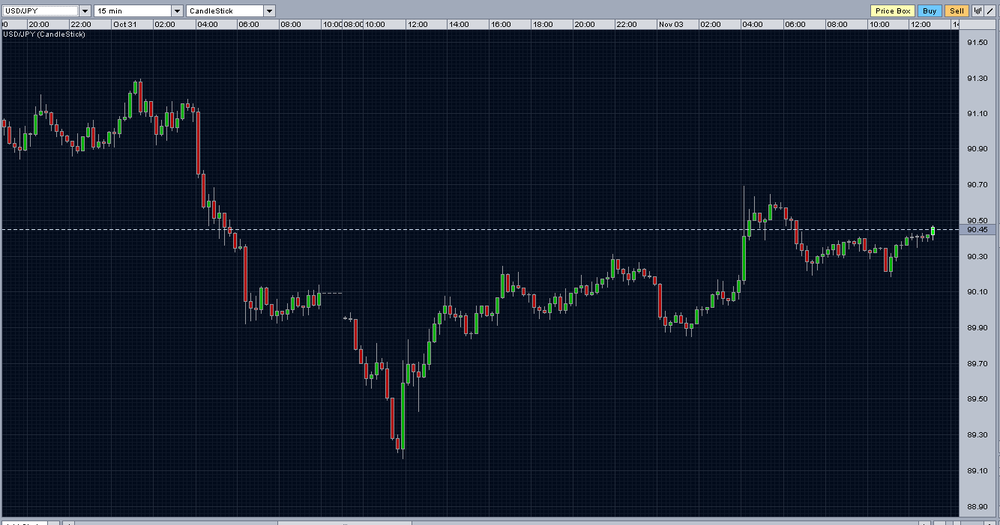
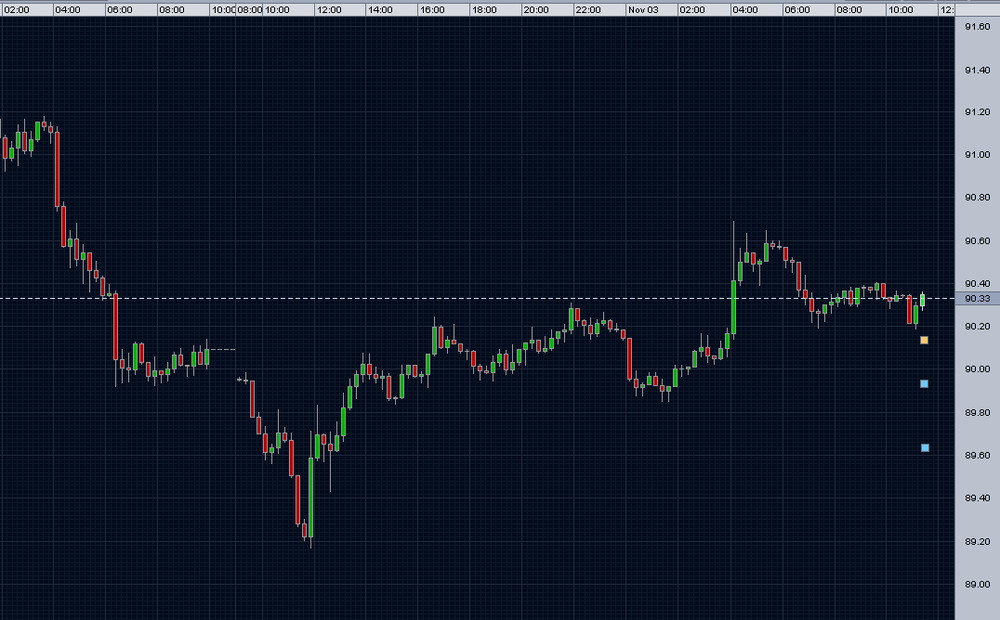
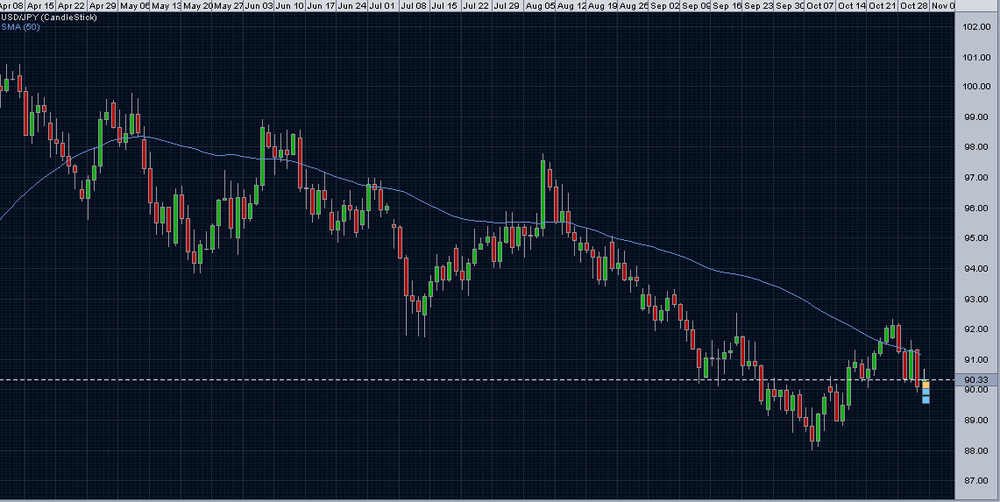
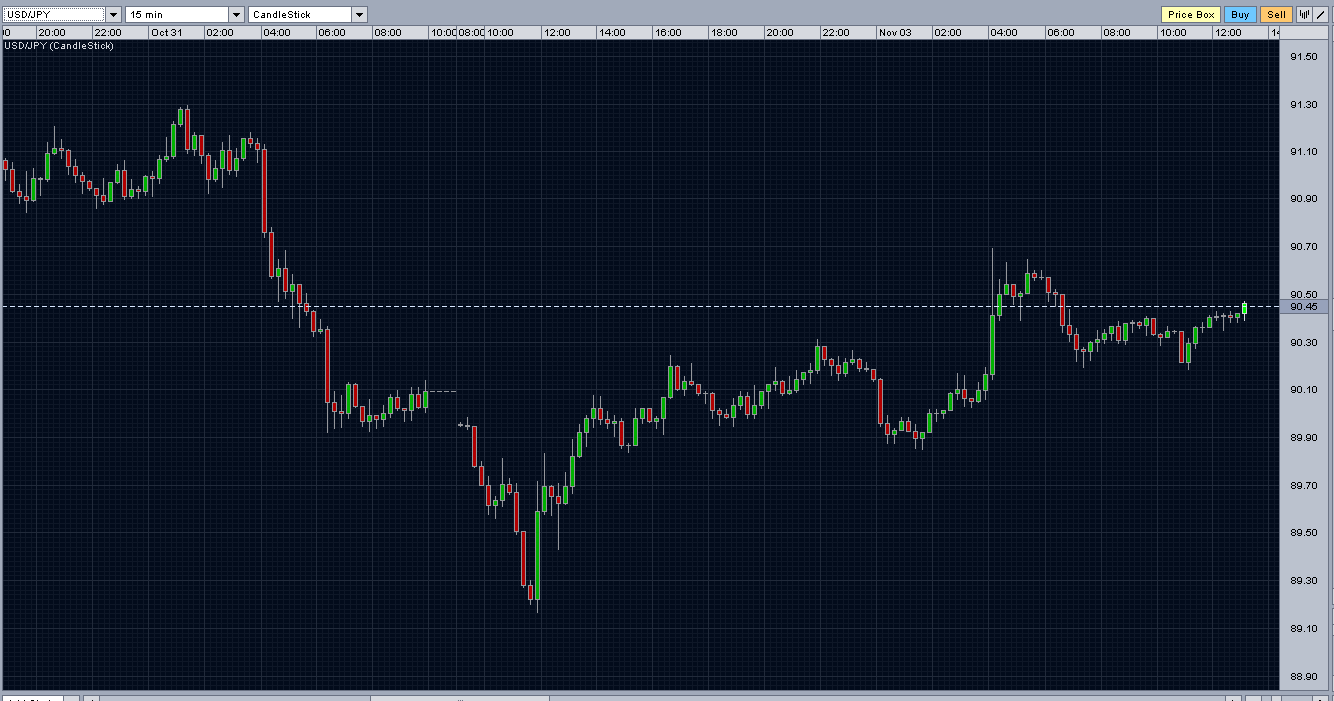
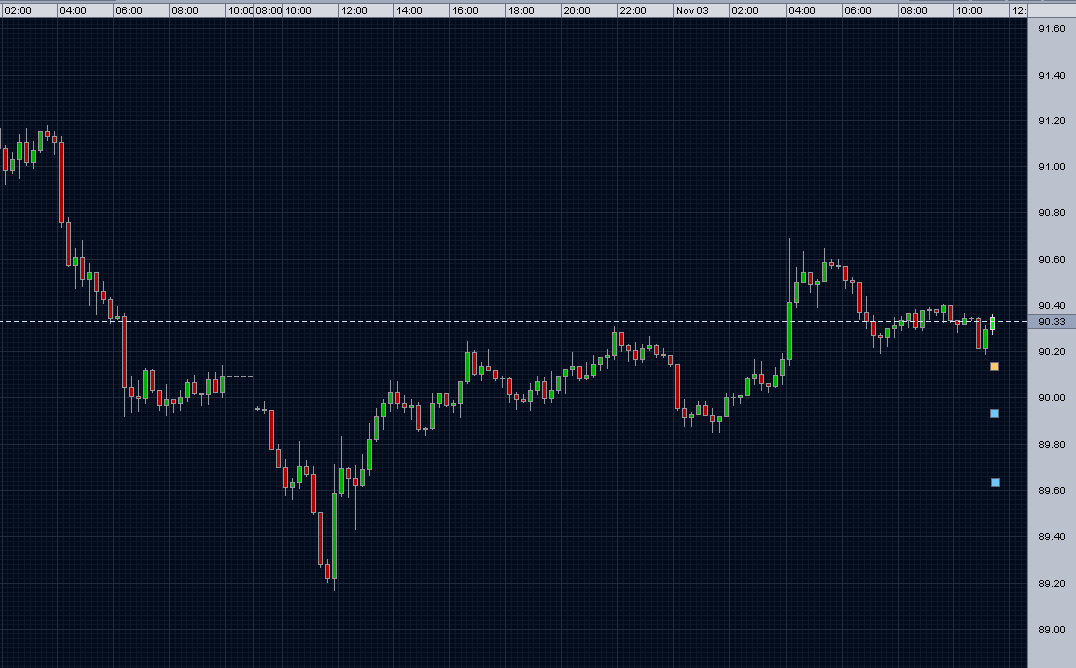
In an effort to learn from the breakout masters here. I'm posting a USD/JPY trade idea from my FXGame account. The 15m chart shows the limit sell order (orange) and 2 profit targets set into the market, each for 1/3 of the position. The stop is just on the other side of that small range we see on the 15m at 90.43. The long term daily trend is down as can be seen from the other screenshot. I'll update more if it gets filled.Shorts canceled on USD/JPY, once Tokyo opened, the market decided to go up.
-
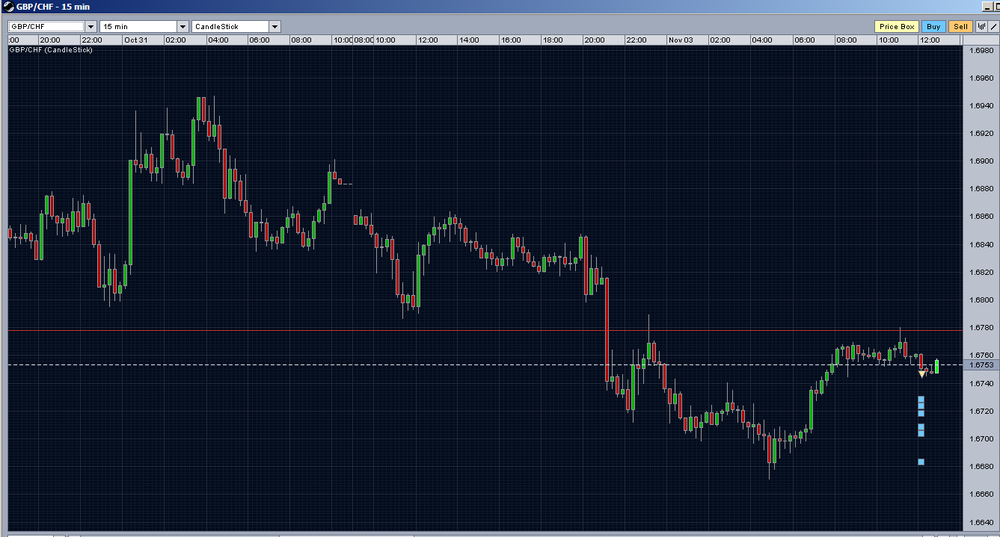
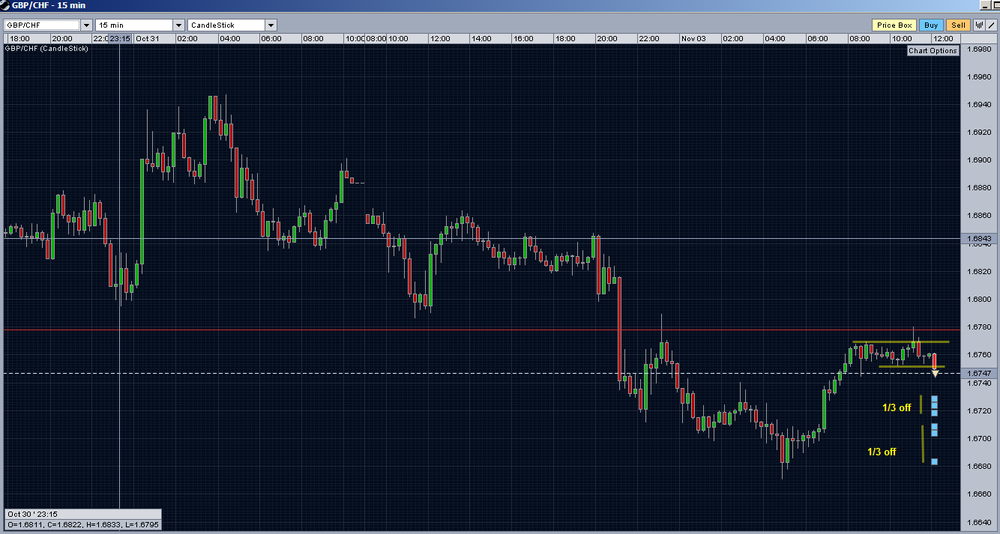
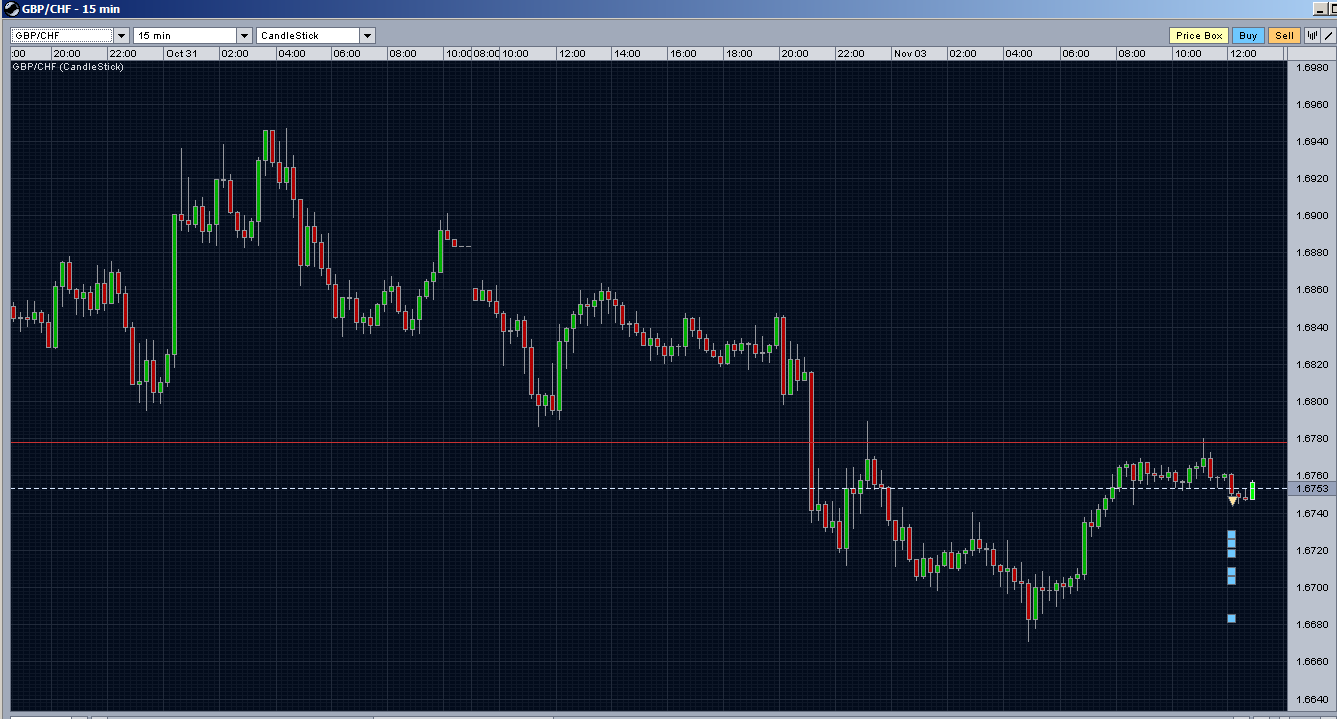
Thanks for the comment Dinero.I'm a forum posting machine this morning. Here is another one I liked. GBP/CHF. This one is filled (by the orange triangle) with a stop on the other side of the range. We'll see how she goes....
Pretty much filled me at bottom tick, not looking so good.
-
Thanks for the comment Dinero.
I'm a forum posting machine this morning. Here is another one I liked. GBP/CHF. This one is filled (by the orange triangle) with a stop on the other side of the range. We'll see how she goes....
-
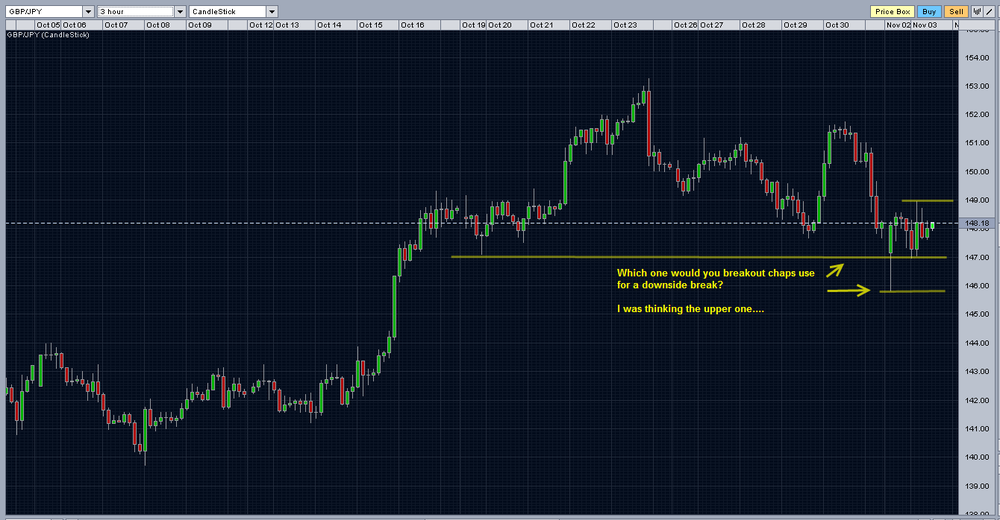
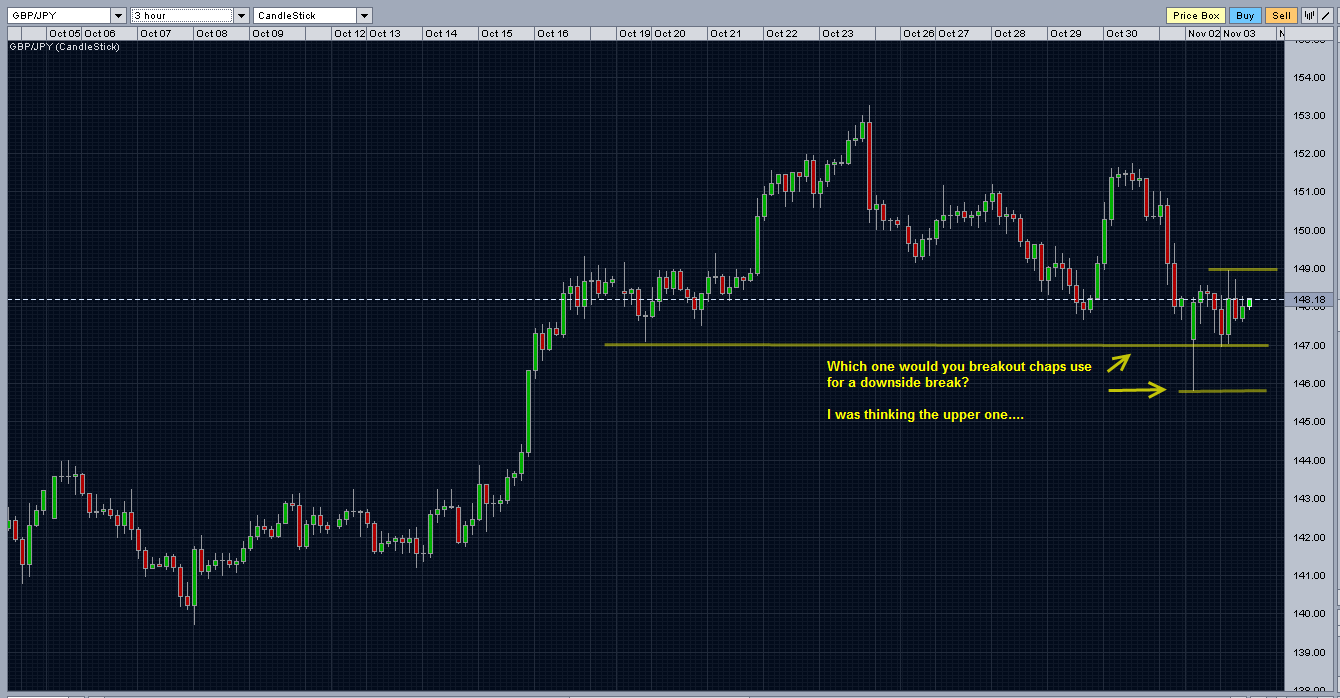
3 hour chart of gbp/jpy looks good to me. There is enough 'air' for a move either way, especially to the downside. I'm not sure which one someone would use for a downside break. I thought the upper line was more 'valid' and could take some profits near the spike low....but I don't know. Any thoughts?
-
In an effort to learn from the breakout masters here. I'm posting a USD/JPY trade idea from my FXGame account. The 15m chart shows the limit sell order (orange) and 2 profit targets set into the market, each for 1/3 of the position. The stop is just on the other side of that small range we see on the 15m at 90.43. The long term daily trend is down as can be seen from the other screenshot. I'll update more if it gets filled.
-
I've mentioned this previously and one day I'll do a writeup of it, but I believe that just about any trading methodology can make money if the proper risk protocols are in place.Please do, I would most certainly benefit from some insight into this area because I know my risk management and trade management are shocking. The scary thing for me is that I whenever I try to reduce the risk or manage it with a focus on risk reduction, I'm also then decreasing my profits and rather quickly how I'm trading turns into a BE or slightly below zero return. I've virtually given up trying to do this. Insights from the experts would be great.
With king regards,
MK
-
Hi Thales,
To my knowledge FXCM does not guarantee stops no FX broker does that anymore AFAIK. 5 Years ago when I started trading with FOREX, they did guarantee them, they changed it shortly after because guys were straddling the NFP reports and making out like bandits. I believe now what they do is guarantee stops* - note the asterisk

-
Potential lower high ...So....BE on other 1/2?
-
Good sequence of posts on the stalk, entry, mgmt. I totally agree about the importance of recognizing unexpected price movement and proactively managing the trade. I suck at that. I'm sure many would benefit (especially me) from learning more about real-time trade mgmt and proactive risk reduction.
My thanks,
MK
-
2) when you trade breakouts, it is a very high probability approach (most do not believe this, but when you pick your spots correctly, you will win most of the time)Good post man. I just want to comment that absolutely any approach is high probability if you pick the correct spots. For example, when I review a chart in hindsight and glance over it quickly, I'm at a 100% win rate for the day because my speed reading a hindsight chart only picked the correct spots
 Sadly, in real-time though, I do not pick the correct spots as well...
With kind regards,
MK
-
It still amazes me how long it took me to be able to do something that really is so easy that even a nine year old can do it well.Best Wishes,
Thales
Hi Thales,
Yes, I agree with FS's post after this one. Why this BO and not any of the others on the decline? Like maybe everyone here, I've tried breakouts in the past as well. For me, it was just pure death. I know you and your daughter do well at these, but I really don't think it is easy, as you say above. You are doing some other filtering that isn't obvious to us, but is to the Thales family.
-
Last I heard is that if you are planning to trade the Nifty on their exchange in India (Bombay?), then you have to be an Indian. The SGX has a Nifty contract but when I checked early this year, volumes were still anemic.
-
Hi Bunny,
Just a short note about your point number 2. While many do say trade with the trend, it of course isn't the only way. There are many guys that do make solid livings from fading areas in a trend. Keep an open mind on that point, in fact, keep an open mind on anything about trading
Sorry to hear about the hard day. We've all been there many times, and probably continue to revisit it every now and then.
With kind regards,
MK
-
I come from a strong programming background before entering the trading arena so it was natural for me to assume that system trading was going to be my forte. Anything that wasn't testable with a rigid ruleset so it could be reapplied consistently was discarded. I hammered away like this for years not finding anything consistent or acceptable within my risk tolerances. For me, the problem was always about the contexts of the patterns. They became too varied and diverse, but I could sum them up easily with vague but general statements about the conditions. Of course though, for systems, vague and general ain't gonna cut it.
Eventually I had enough of the struggle and let myself go as an experiment. It sounds somewhat similar to what James described earlier on. I relied on my gut and executed within a loose plan that was free to change as I saw the day unfold. Letting myself go was a shock as it is out of character for me, but it was also a pleasant result as my trading started to become profitable. I need more work on risk management though, and would be grateful if James would like to start the ball rolling on that topic too as he did state how crucial it was to him.
With kind regards,
MK
-
Yet more info from people I highly respect in the trading community.
-
To my surprise, HSI did a decent sized gap up. I say this as a surprise, because usually the gaps are a result of USA's trade, but USA traded virtually unchanged yesterday. The gap was right at the unfilled gap created from SEPT 24th. We sold down and ended up finding support at the minor congestion around the high from the prior day. While I didn't mark it on my post yesterday, I was aware of it. The HOD was at the trading range low (SEPT 17-23).
Today I am moving the zone up to enclose yesterdays congestion at the LOD and the WEDS's congestion at the HOD. HSI has done 5 up days in a row now and is knocking on the trading range that (SEPT 17-23) that looked like an island. I'd be very surprised if we put in another up day, but the move up this week has been relentless. Currently up 1300pts.

-
I was painfully disgusted by my trading yesterday. HSI gapped up larger than expected just on the upper edge of the zone from SEPT 29th. Don't ask me why, but I remained locked into an short bias despite it holding on the upper edge. I also had recorded in my daily plan that we could get further short squeezing if we traded down to that upper edge from above as the established shorts from SEPT 29th scratch out any held inventory they still had. By my calculations, there was still significant held inventory. I changed my bias from short to long and vice versa, 4 times over the day. Each time changing it at the wrong time. You can imagine the result at the end of the day - not pretty. The 1 tick chart caused me to over-trade my incorrect biases through excessive entry triggering. This is how I get into that problem with low timeframes - when the trade idea is wrong but there is leeway for the trade idea (like a zone) then the low time-frame will trigger me into trades taking many small stops in a row.
Anyhow, enough of my complaining. Adding the main pivotal zone from yesterday and keeping the rest the same.

-
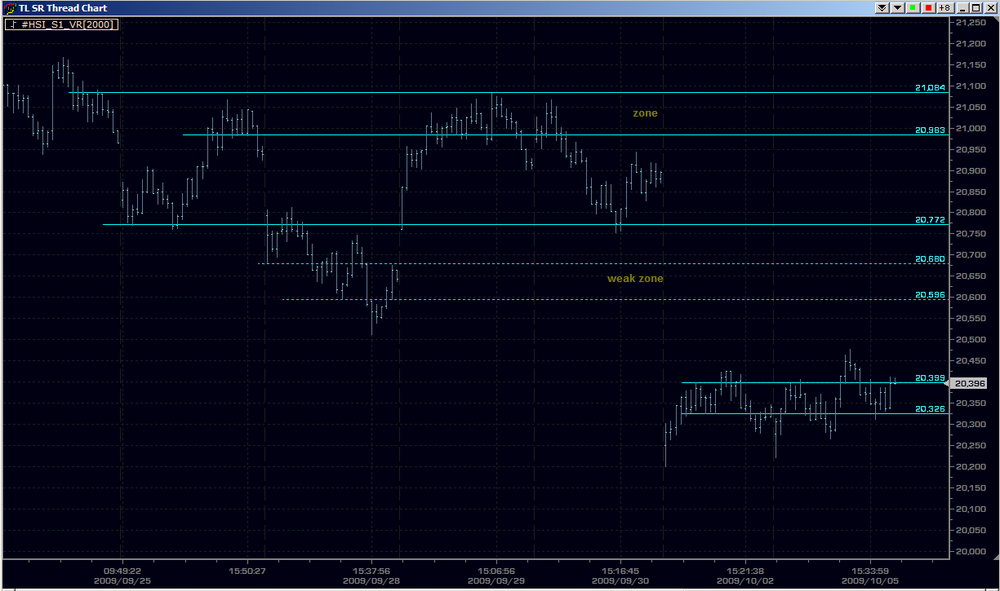
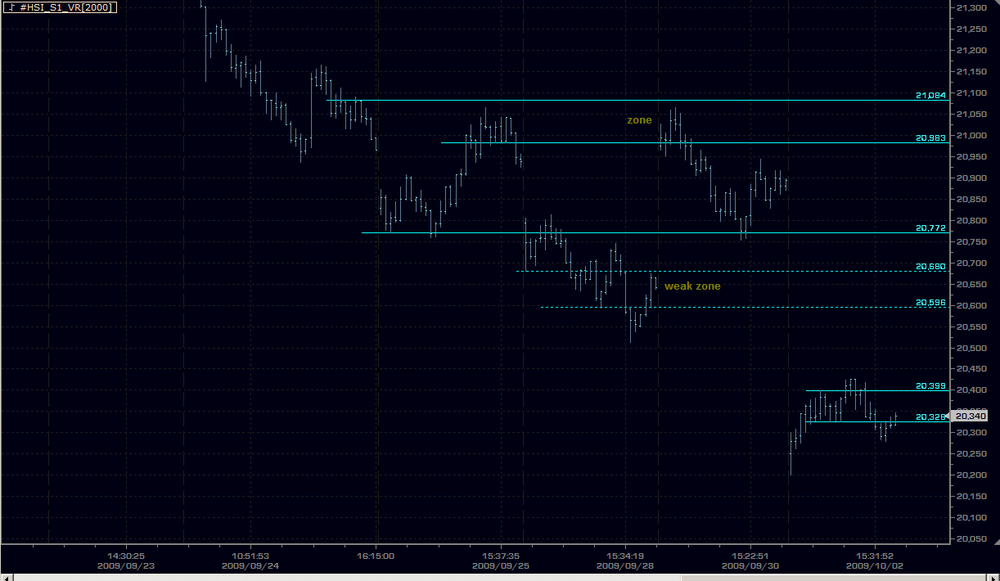
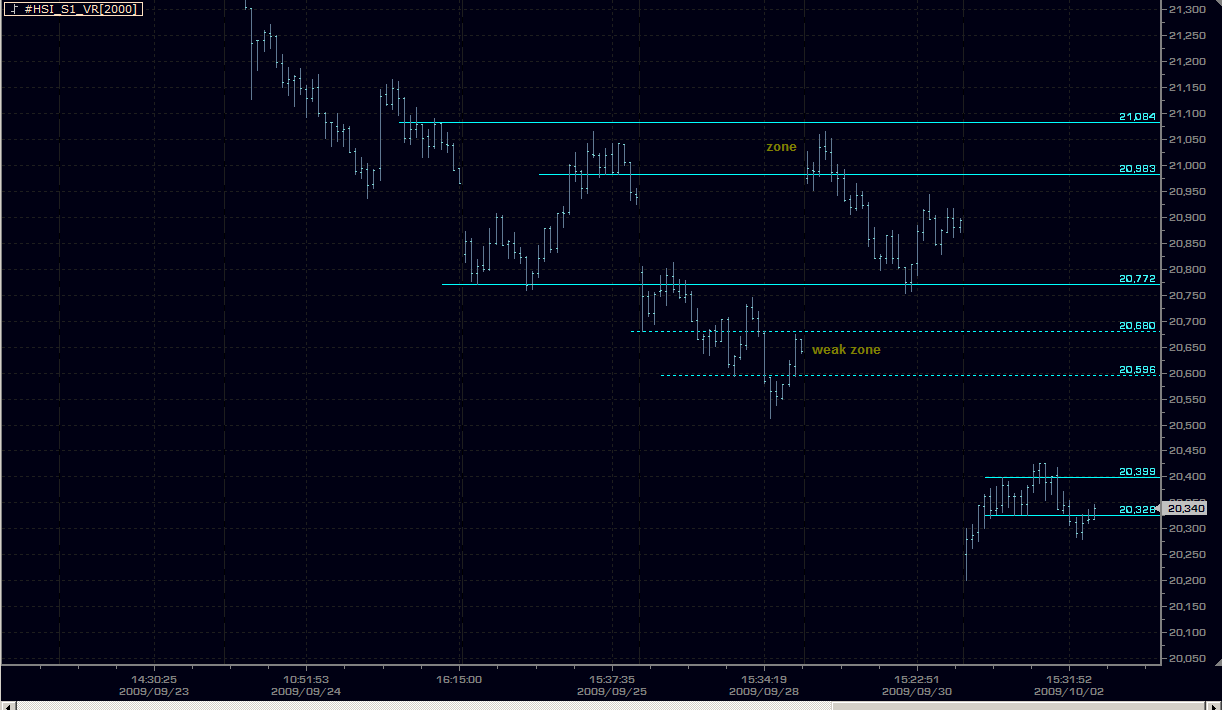
After a reasonable gap up out of the 2 day range, the HSI held respecting the weak zone made on SEPT 8th (see my prior post here). Late in the day, the market broke out of the days range and never looked back. I expected more of a reaction at the 20,770 area but never got any....That is the problem I have with a single line. When real-time trading, the line remains in my mind as an absolute, rather then a zone reminding me to be alert for S/R within a range of a prices. It wouldn't have mattered though in this case as a decent reaction didn't occur until the last 10 minutes of the day.
Going into today, I'm removing the old 'weak zone' that was marked and adding a zone around the bulk of yesterdays range. I see USA was up today couple that with the strong rally into the yesterdays close, I'm looking for a gap up and will be keenly watching for R in the next higher zone marked. I'm uncertain if I should remove the 20,772 line because we blew through it yesterday without paying it any attention. I'll leave it there for now and see if it comes into play again.

-
Good planning and nice trade wjrusnak.
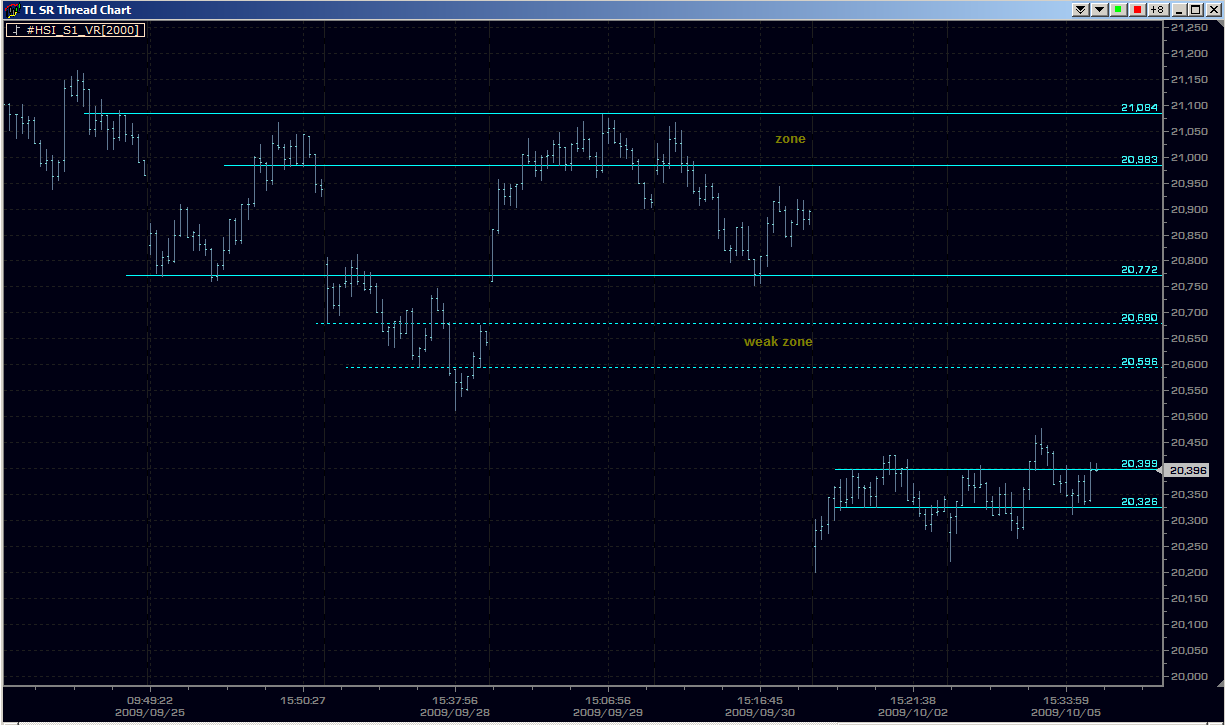
Yesterday's HSI respected the S/R 'value are' from Friday. We tried to probe up to the last daily swing low (just over 20500) but failed and came back to the 'value area'. I'm keeping all the levels the same going into Tuesday's trade.
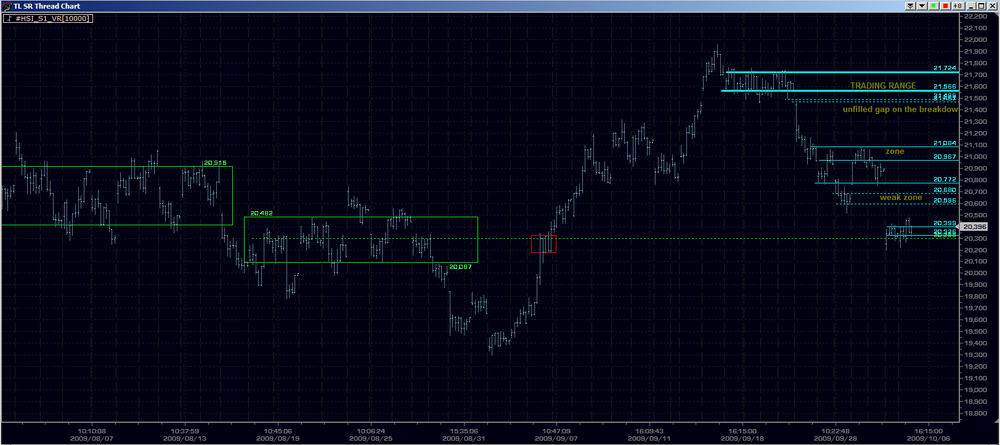
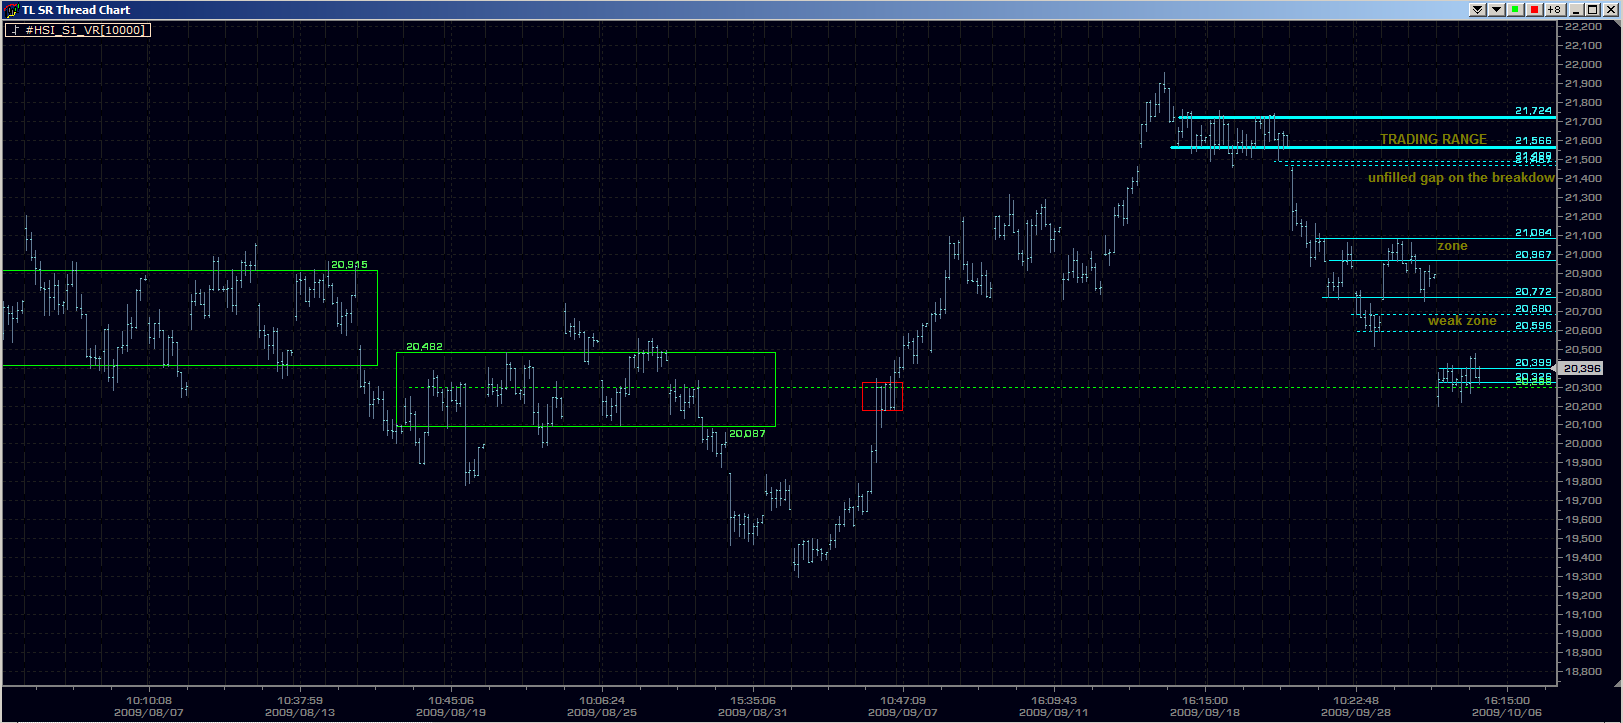
From DB's last post about the forest....I'm also attaching a bigger view chart. The question from me is, which is more accurate here, the big green rectangle or the small red one? Because the small red one is more recent, I would have tended to put more weight on it. However, it is small, so how significant could that be. The green one would be involving a lot more traders than the red one did.
PS: how are you guys embedding the picture within your posts?
-
Hi MidKnight,Do you have access to other markets that are not so gap prone? A significant part of market movement seems to have already taken place at open and you're left to fend for the remaining scraps. A Ferrari is hardest to drive on a road with gaps in it.
Hi Gringo,
Of course anyone can get access to any markets in the world but it comes down to some quality of life. I live in an Asian time zone. In my first couple years of trading, I tried very very hard to only trade Europe or USA markets. This meant working the graveyard shift - there is a reason they call it that. My health deteriorated, my motivation and alertness disappeared. I was like a zombie when I was awake. My relationships were tested, some were destroyed because of this. It just wasn't worth it.
Yeah these Asian markets will gap, but I don't think that means they are harder to trade. The gaps will back and fill a lot (at least in the Hang Seng) and make for decent S/R going forward.
With kind regards,
MK
-
I was wrong about the magnitude of yesterdays gap down open. It ended up being a massive 650 pts lower, making new lows for the decline since mid SEPT. The move up going into the SEPT high does have small congestions (not shown on my chart), but it was such a fierce up move, that nothing obvious really stands out to me. Because of that, I haven't been using any of those areas during this decline. On this attached chart, I have labeled a 'weak zone' more of as a lower value area type of thing. I don't see anything extremely obvious other than what is marked on the chart....
On a side note. I have been studying the 1 tick chart and was able to study it in real-time yesterday. Good news is that I didn't over trade
I also found it added a new 'feel' component because the pace and the spread could be felt better.Have a good weekend guys. Here's my chart going into Monday.
-
Cheers DB. I understand what you are saying with how S/R can help curtail overtrading, but when I have a zone that is say 80+ ticks wide and we end up spending a lot of time in that area (say 30-60 min), then I end up taking many shots at the decent reaction I am anticipating. In my past, small detailed summaries have led me to overtrade. This 1 tick chart will be the smallest I have tried, so I am curious to see if I am still affected by this.
As you say, if you have something very clear to act upon then it less of a concern. I've failed at this so far to date. Five years ago my daytrading started out exploring objective and systematic means to consistently make money from. I struggled along this objective path for several years. It wasn't until I let go of trying to be so exacting and objective that profitability started to turn around for me. So while I have failed to define clearly what I need to see to act upon, I do have loose general guidelines....I would love to get more objective because that is sort of built-in to my nature, but also appreciate that it didn't work so well for me in the past. I'm always open to re-exploring things that didn't work in the past though.
HSI trading today. Because you guys had a large move down today, we will probably do a large gap lower. I'm expecting that to be somewhere around the weak support zone on the chart.
-
Beyond that, one can look at how he traded at the levels he anticipated. Even if he nailed the levels, there remain the strategies and tactics to be employed to take advantage of the preliminary work he's done. In other words, one can be dead accurate on the levels but remain flat if he doesn't know what to do with them. If you're happy with the trades you're taking at the levels you've anticipated, there's no need to go further. If you aren't, then this thread may be a resource.For some time now, I have been generally content with my S/R areas but I think I'm lacking in the strategies to take advantage of them properly. I may have mentioned prior that I was hoping to gain more accuracy in my S/R areas, but perhaps it is more as you said, I need to learn more about devising strategies of how traders are trading when in the determined S/R areas.
If you're interested in trading price action rather than bars, then it will become necessary to follow price action rather than a summary of it, akin to watching an event take place in real time as opposed to reading a report of it in the daily paper the following day (or in a weekly newsmagazine the following week). If you want to understand the behavior of traders as they approach important levels, then you'll have to observe that behavior. One can watch the little right-hand notch on a bar of one sort or another move up and down in real time until a new bar forms, but this is no substitute for watching price move laterally, transaction by transaction, printing the little hesitations, the thrusts and shakeouts, the feints and fake-outs.One chart is of course insufficient. You'll need something that shows the forest since all of this is based on accurately locating support and resistance. CVB charts and range charts are both good for providing that context. But trading this broad context will lead to a lot of false starts and missed opportunities. When it gets down to actual trading, you'll need something that has a much narrower focus, preferably with separate volume bars (since these show activity). I suggest a time bar of some sort along with a 1-tick chart. The time-bar chart will keep you focused on important swings and pullbacks and congestions as well as the overall trend and prevent you from getting distracted by what can be unimportant activity on the tick chart (unimportant being anything that isn't taking place at an important level or that isn't interfering with the trend). Whether this is 5m, 3m, 1m, or 30s is entirely up to you. The tick chart will show you, trade by trade, what traders are doing, especially and most importantly as and when they approach the levels you've anticipated.
Other than these three basic charts, you can add additional broad context charts. You can also add charts of other indexes. You can also add charts of various breadth measures, if you have them. But the more you have to look at, the more difficulty you'll have in reaching a decision and the more likely you'll miss the trade. Therefore, I suggest that you keep it as simple as possible.
Good post that makes a lot of sense. I'll do some study on the 1 tick chart over the next couple weeks. My initial fear with viewing the raw T&S stream in a non-summarized form is that I will over trade and envision too many scenarios happening. Know what I mean? Summarized data (some type of bar) helps minimize this. I do make my trade decisions intra-bar though. Maybe, after 5 years of this game I have matured and somewhat contained the overtrading beast that used to dominate me on small time frames. I'll keep you posted of this over the next couple weeks if that is true
With thanks,
MK
-
In order to provide specific suggestions, I -- or anyone else -- would have to have specific examples. Did you make any trades yesterday off the lines you drew?I can appreciate that position. Yes, I made some trades around those areas of which I am happy to post on my low time frame chart if you wish it.
As to recognizing other traders trading, that may be difficult as long as you use summary bars. Is there any particular reason why you're relying on CVBs?No, there is no reason really. I am open to suggestions....

Reading Charts in Real Time
in General Trading
Posted
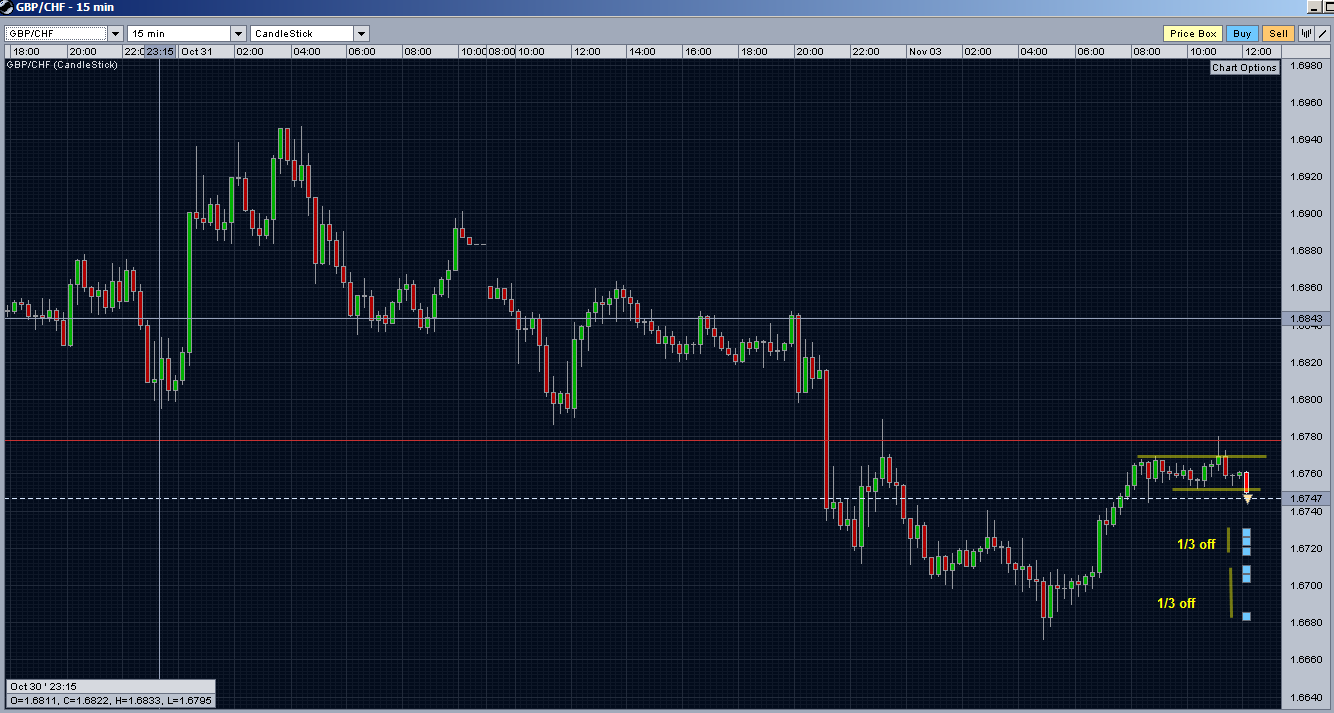
Doing better, but still not hit my close first scale. What has been hard here is the duration of the trade. I don't know how many times I've said to myself "this trade is over". In the chart, you can see the horizontal red line, that is my stop. I have moved it 10 pips beyond the last swing high just below 1.6760.