
Welcome to the new Traders Laboratory! Please bear with us as we finish the migration over the next few days. If you find any issues, want to leave feedback, get in touch with us, or offer suggestions please post to the Support forum here.


david22
-
Content Count
24 -
Joined
-
Last visited
Posts posted by david22
-
-
this thread is worth reading + video link:
Is It Bots Or The Exchange Engine - PriceActionRoom's library
http://www.traderslaboratory.com/forums/market-profile/9646-order-flow-advice.html
Plus your 20+ lot filter may be capturing limit orders and not market orders
according to the above thread/video.
-
"I have also included a link to the site that the developer of the index is using to compile the index for me. BTW, he is charging $125."
Carlton I dont see the web link you pasted in your posting regarding
the developer.
-
Carlton firstly my data is based on uptick/downtick data and not bid/ask
data. But this can easily be done using software like neoticker if you require
more accuracy down to the tick level.
I look at the bar on close price every 20 seconds for a stock and compare it to the prior
close to determine if its an uptick or downtick. eg. 9.50 am, xyz stock is at the price level $8.51, twenty seconds later the the price level is $8.53, so thats classed as an uptick.
So I take into account the volume for that period being positive and then add it to an accumulated total which runs throughout the trading session.
I basically do this for the whole 500 stocks thats represent the sp500, so it becomes
a simple case of totalling the updown/downtick volume for the whole basket.
This indicator doesnt have a name, its just a custom up/down volume indicator
as opposed to the standard nyse/nasdaq up/down volume indicator.
-
Carlton I dont know if you have heard of market internals and "up/down volume" or
"advance/decline volume" for both the nyse and nasdaq?
Well I used a modified version of that indicator above but with 2 differences:
I track the whole 500 stocks that make up the Emini 500. Plus this is calculated
every few seconds using intraday price data.
quick definition of intraday volume:
"A Stock is considered advanced (volume) if it stock price moved up over a minute. No matter where the stock is in relation to the previous day close, if this stock moves up over a minute it is considered as advanced stock (volume)."
The TVI looks simliar to what I am doing in that I am looking at accumulated volume
be it negative or positive during each trading session. As an example, you see a double bottom pattern intraday on the Emini 500, you can use the accumulated volume to spot divergance. (see if accumulted volume has formed a double bottom or better still a higher lower.)
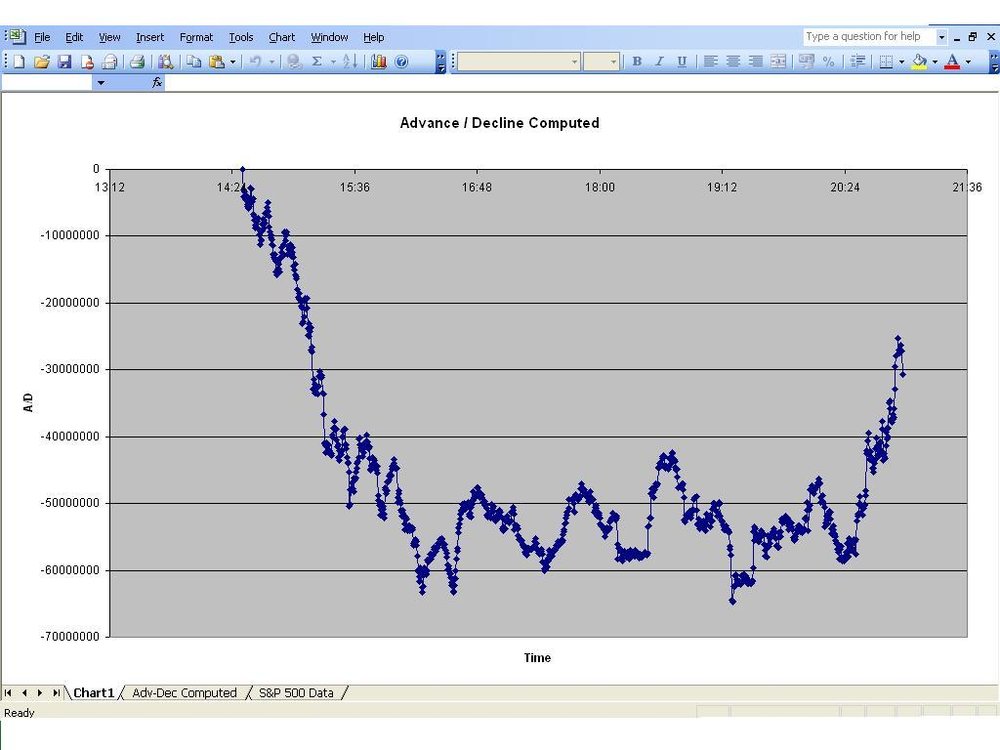
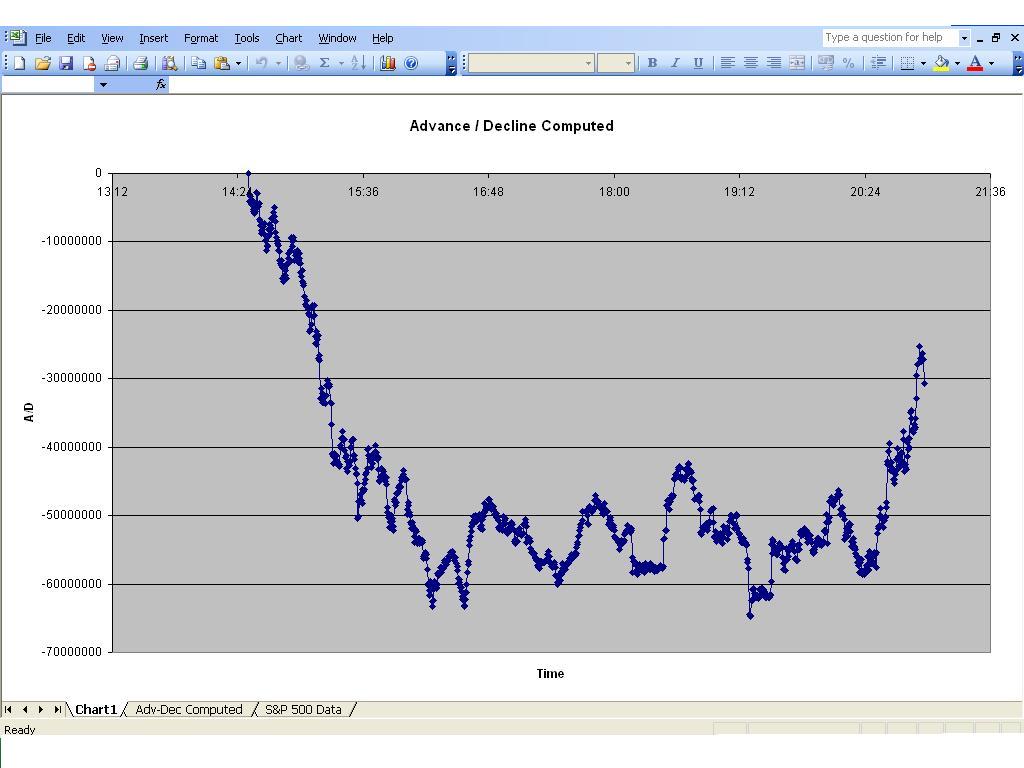
I have attached an image of up/down volume for friday Emini 500 trading session.
This looks or shows the difference between positive and negative volume for the whole sp500 stocks. The image shows 2.30pm London time which is 9.30 EST and 9pm London time which is 4pm EST.
-
Carlton can you give a basic description on the Trade Volume index.
Are you using bid/ask or uptick/downtick volume?
Are you using Intraday or EOD data?
Are you creating this for the index market like the sp500?
(so will you be taking into account the volume for the 500 stock that make up the index)
David
-
Speculators do give back to society in terms of market data fees,
software/charting costs, broker fee's, indicator development costs, internet access
costs, educational/product costs, pc/hardware costs, trade room costs...
-
you can build you own custom VOLD indicator based on the 500 stocks that make
up the e-mini S&P futures.
-
What is the custom calculation that you use? I've experimented with including the Unchanged data, but it doesn't seem to me to make that much difference. I've taken the difference UVOL-DVOL or used the ration UVOL/DVOL. The ratio seems to track the e-mini more closely.The custom uvol/dvol only takes into account volume for the sum of the 500 stocks
that makeup the sp500 index. The calculation is nothing special, it just calculates up/down volume every few seconds using intraday close price as opposed to the
standard uvol/dvol which used Eod close only.
You can easily create this yourself using something like neoticker which is a
program that can do many market internal related calculations like tick, uvol/dvol, trin, adv/dec etc..
Or you could do this using an excel spreadsheet but you would need a bit of programming
skills..
-
Is that the same as Up Volume and Down Volume? I chart the Up Volume/Down Volume ratio.yes its the same, advance/decline volume is up/down volume..
although its much more accurate if you custom calculate
this for a basket of stocks like the sp500, assuming you
trade the index.
-
Your right about advancers/decliners not giving any info on buy/sell pressure.
You need to investigate advance/decline volume to assess the pressure.
Other internals are the tick and even a equal weighted index for a basket of stocks.
You mention orders gettting cancelled, you could probably study a bit on Level 2 to see how
the orders/withdrawals are played out for experience.
Plus you could investigate time and sales (orders that have passed) Vs Level 2 (intentions).
Market delta is a good website to investigate this area..
-
where are you getting your advancer/decliners data from? Tos, esignal, tradestation?
because the description i gave on "advance stock" is custom made and not offered by data vendors..
just to clarify, all data vendors provide method 1 to calculate advancers/decliners. Method 2 is more custom
and more accurate for intraday trading.
1) Advanced Stock using EOD close: A Stock is considered advanced if it traded above the previous day close. Even if the stock is moving during the trading session down, no matter how strong and how long this move down is, if this stock is still above previous day close it is still considered as advanced stock.
2) Advance Stock using intraday close:
A Stock is considered advanced if it stock price moved up over a minute. No matter where the stock is in relation to the previous day close, if this stock moves up over a minute it is considered as advanced stock.
-
here's a good website that defines advancers/decliners, up/down volume:
http://www.marketvolume.com/technicalanalysis/adissues.asp
In regards to advancers vs decliners, its much more accurate to calculate every few
minutes and to take into account the most recent intraday closing price as opposed to last nights
closing price..
Description, Advance Stock:
A Stock is considered advanced if it stock price moved up over a minute. No matter where the stock is in relation to the previous day close, if this stock moves up over a minute it is considered as advanced stock.
-
I currently stream realtime data into an excel spread sheet using an advfn datafeed.
I only look at open, last price and volume fields, and these values change or update every second.
I assume you want to download all minute data between 9.30am to 4pm, so thats
3630 fields? ( 6.5hrs * 1 minute = 3630)
You can link excel to the thinkorswim platform, plus its free..
-
try openecry platform, the bars look big and easy to read as opposed to esignal charts. But openecry only have charts for futures, no stocks.
-
-
you can construct your own tick, adv/dec, uvol/dvol using neoticker
for the ftse or any other exchange.
so for ftse 100, you can construct the internals which are based on
the 100 stocks that make up the index. You could also add
the ftse 250 index or sum of stocks for greater accuracy.
-
you probably have to use software like neoticker to create your own tick
from a basket of stocks.. eg, ftse100, a tick calculated from the sum of
100 stocks.
theirs no vix, but you could create advancers, decliners, up/down volume etc..
-
try using market internals like advancers vs decliners,
up volume vs down volume, tick, trin etc..
-
i dont think they can legally take the account balance if the account is for some reason forced to be closed.
-
also you can use market internals to assess the strength or spot divergance.
-
Hi davla,
Please tell me more about algos backtesting and tick databases.
I have been studying market internals for a while now
and looking add it my current methodology based on volume.
-
you can use neoticker to design your own breadth tools like uvol/dvol, adv/dec, tick, trin etc.. So for ftse 100 index, you would compile a list of the 100 stocks than make up the index and then design breadth tools around them.
The nyse internals like tick,trin, dvol/uvol, adv/dec can also be customed designed
for the sp500 using just the 500 stocks that makeup the index giving
a better resolution of data and be updated faster like every second as opposed to 6 secs for the nyse or esignal datafeed.
-
its free with TOS
Divergance Without Indicator
in Technical Analysis
Posted · Edited by david22
I look at divergance between indices, sectors and bonds.
eg. Dax vs eurostoxx50, es vs dow\nq, es vs sectors, es vs bonds..
so if you see a intraday double top on the dax, you want to see a lower
high in the eurostoxx50.
or if you see a intraday double bottom on the es, you want to see a double top
on the 10yr bond.
or if you see a intraday double top on the es, you want to see a lower high
on the dow\nq..
also you can have divergance between indices and market internals ( tick, advancers\decliners, up\down volume at an intraday level.