Welcome to the new Traders Laboratory! Please bear with us as we finish the migration over the next few days. If you find any issues, want to leave feedback, get in touch with us, or offer suggestions please post to the Support forum here.

TEAMTRADER
-
Content Count
46 -
Joined
-
Last visited
Posts posted by TEAMTRADER
-
-
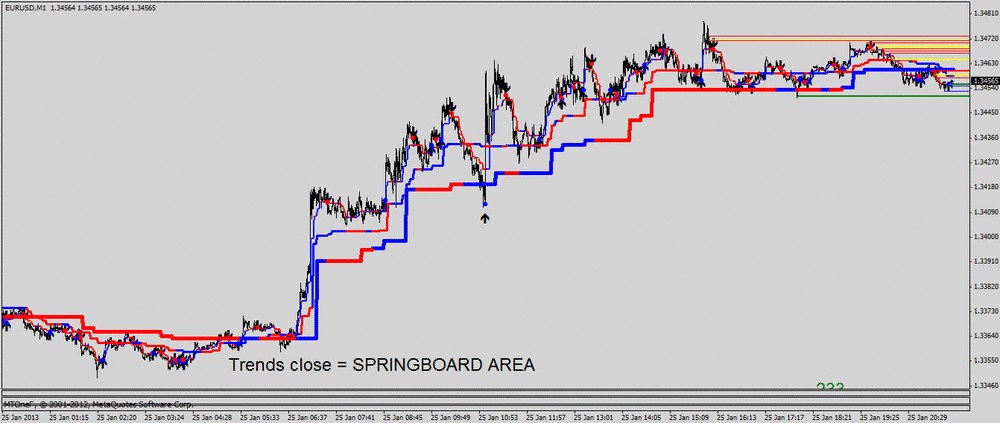
I have attached the code for a very good trend indicator.
Used with the two upper timeframe indicators it shows accurately what the direction is in both upper timeframes.
Importantly it shows when the upper TF's are close to the current TF trend and this often produces a springboard area for the price.
MY QUESTION to any coders is :-
Is it possible to get a box alert for when the current TF trend crosses the upper TF's.
It probably is not but I'd like it confirmed.
Thanks.
TEAMTRADER.
-
The Scalper trades with lower risk whereas the Swing trader has larger risk (Stop Loss) - so it is highly dependent on the risk tollerance of the trader.
Some scalpers can make +500% in 3/4 weeks and others struggle to make 25% in a week.
Swing traders can place trades on several charts and make good profits, perhaps not in a week but certainly over a month.
The pressure on a Scalper is enormous - that is why they, for my money, are the traders who can make the most.
No one can say with any certainty who makes more money over a given period, but short term potential it is the Scalper who will win out - but at a stress cost.
I always say, if you can trade the DOW, you can trade anything.....
TEAMTRADER
-
-
-
I've retired from trading now and am concentrating on the basics for an EA. Lagging is good sometimes if you are looking for safer, lower risk trades. But there are other times when the indicator does not lag and shows very accurately convergence points. These are like 'patterns' if you know what to look for.
Regards
TEAMTRADER
-
Hi DJohnson,
Are you the DJohnson that is part of the Skype Trade Forex group?
No, they are in the correct place. The setting of the Stochs is important and also it is the target trade for the settings.
Perhaps you thought that it indicates oversold or overbought? This would correct sometimes but the settings of the stoch indicator are to get bigger moves rather than reversals athough it can be used in that way too if that is your target trade.
Regards
TEAMTRADER
-
Thank you Obsidian.
It looks exactly what I need to trigger an EA entry as I already have an indicator that shows where the trendlines should start. These are the yellow dots on the attachment.
I have the idea that if an EA were manually started then it would cut out a lot of the bad trades that EA's have to make automatically.
I'll test it when the markets open and let you know how it performs.
Regards
TEAMTRADER
-
There is a Demark trendline alert but it does not allow the user to set it up to catch all moves against a resitance and a support trendline that are manually placed.
Does anyone know of a trendline alert that is manually placed as BOTH a support and a resistance to get a box alert to say the trendline has been broken?
Thanks for anyone who knows - I've attached the Demark indi in case any clever coders can amend it to become manual and give an alert box.
Regards
TEAMTRADER
-
Are there any coders willing to take on a complex signal alert?
It uses Zig zag code and Fibonacci Fan code.
Attached is a PDF and the ZZ2 indicator used.
Thanks in advance.
TEAMTRADER
-
TA can be very good indeed to assess the direction of a chart, and importantly, when to buy, sell or hold.
Does TA work?
Of course it does. It is the search for the nearest to a 100% successful system that drives the trading community.
It is when all of the changes are taking place that creates bad TA assessments.
TA will never give 100% over a long period of time, but it will cut out a lot of bad trades.
TEAMTRADER
-
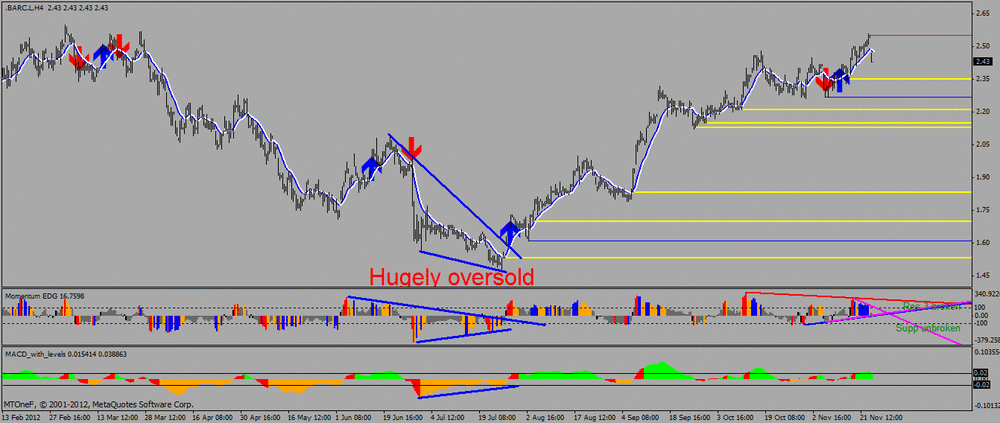
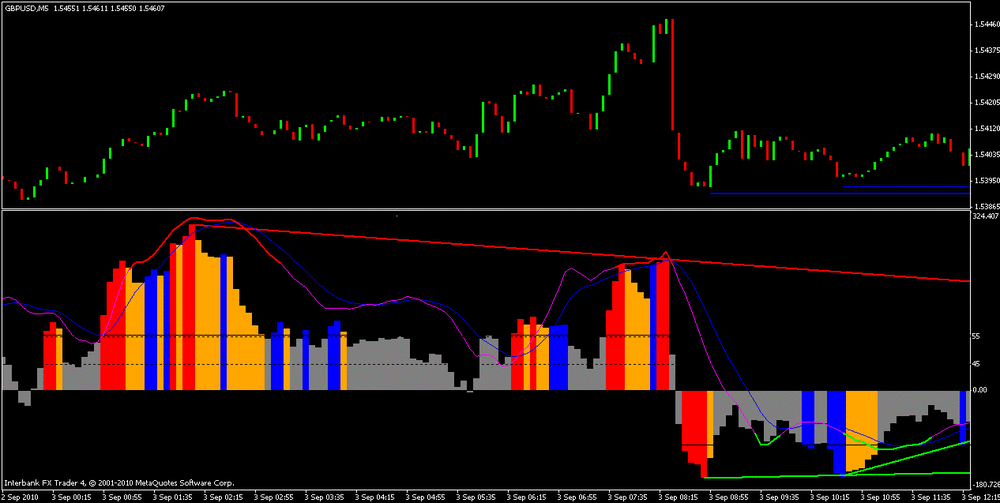
This is an illustration of how momentum and divergence are a double edged sword - and importantly, how to see when momentum is decreasing so rapidly on a move that a reversal, or at least a retracement, becomes - almost - a certainty.
TEAMTRADER
-
There is a lot more to Richard's post than meets the eye.
Momentum is a double edged sword and however often something happens, there will always be an occasion when it does not go as previously so you need good stops.
If something happens more than it doesn't, then this is a good strategy.
How I assess increasing/decreasing momentum is by the smaller CCI as against the larger ones. This can be done with MACD and Stochastic also.
A good post Richard.
Regards
TEAMTRADER
-
Of course Funds cannot outperform the market - it is the people 'behind' these funds. Funds rely on people with good technical and fundamental abilities.
Fundamentals rely on people telling and writing the truth. Technicals rely on people understanding the indicators.
People are the key, good people, dedicated people and reliable people.
Chose your people with care, not the Fund.
TEAMTRADER
'Trade what you see and not what you hear or Hope'
-
I thank you for your reply.
IF I am successful I will post it over the weekend.
TEAMTRADER
-
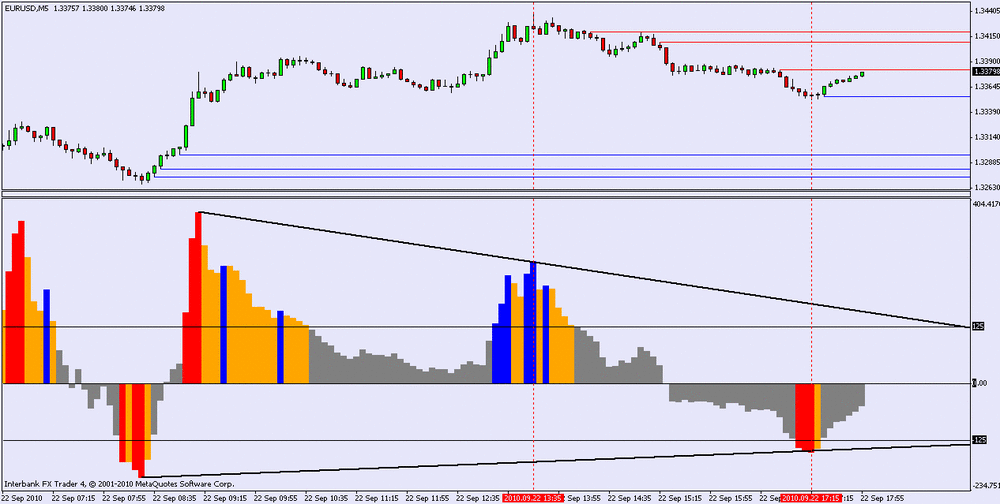
The objective is to have a series of diagonal lines superimposed on indicators.
There are two criteria.
The easier of the two is a line that has a starting point based on the indicator numerical value above/below a set value, eg, 95 - 185.
So a 'support' line would be below zero starting at an adjustable value from -95 to -185 and a resistance line above zero starting at an adjustable value from +95 to +185. It will go over/under the closing values of the indicator.
The other criteria for the line is based on price and where there are price highs and lows.
The superimposed indicator could also show a vertical line on the indicator itself so the lines can also have a start point based on price.
For example, taking the CCI indicator, the parameters would need to be user set for the 'period' setting, to the levels (values) from which the line would start.
Is that enough information or do you want to get more?
TEAMTRADER
-
-
Has anyone come across a trendline superimposed on the CCI?
I find CCI-55 is best for divergence although the 50 setting is near enough.
The momentum levels I also have differently and mine are set on 125/-125 to filter out the signals but one indicator cannot do the full job.
Thanks
TEAMTRADER
-
-
Thanks for the indicator - I couldn't get it to work on my indicators - see grab. The upper two are mine with the manually drawn trap diagonals. The bottom indicator is the macd with trap diagonals both on chart and the FX5 macd.
When I dragged it onto my indicators the trap diagonals disappeared so I couldn't adapt it. You'll see I have dragged it onto the middle indicator but there are not diagonal diagonals as in the original indicator below it.
Thanks anyway, much appreciated - if I can help you in any way please PM me.
TEAMTRADER
-
-
You may be able to get a guaranteed order from your broker but he will protect himself by increasing the spread by his guarantee premium. You can ask the question of the broker.
TEAMTRADER
Thanks, looks like i need to call my broker and ask. Didn't know it could vary. -
I use momentum to identify these levels but I am sure TF specific ema's can do this too.
TEAMTRADER
-
Thanks, if yours works, don't fix it. The worst thing traders do is to change strategies and therefore become one of the 90% who do not make a living from FX.
You will see that my indicators are chart specific but what you may not see is that they are linked together and with the addition of trap lines can forecast when a reversal is due and with this information it concentrates the mind for the direction of the next trade.
Multiple momentum is as rewarding as conflicting momentum so I trade what I fully understand and I urge others to trade what they fully understand.
I'm still looking for a service so perhaps there is a user somewhere that I can help.
Regards
TEAMTRADER
-
I specifically mentioned 70% because it is less work for me to filter out the 30%.
If there is a management system in place then the losses are hypothetical - and everyone has a management system or should have.
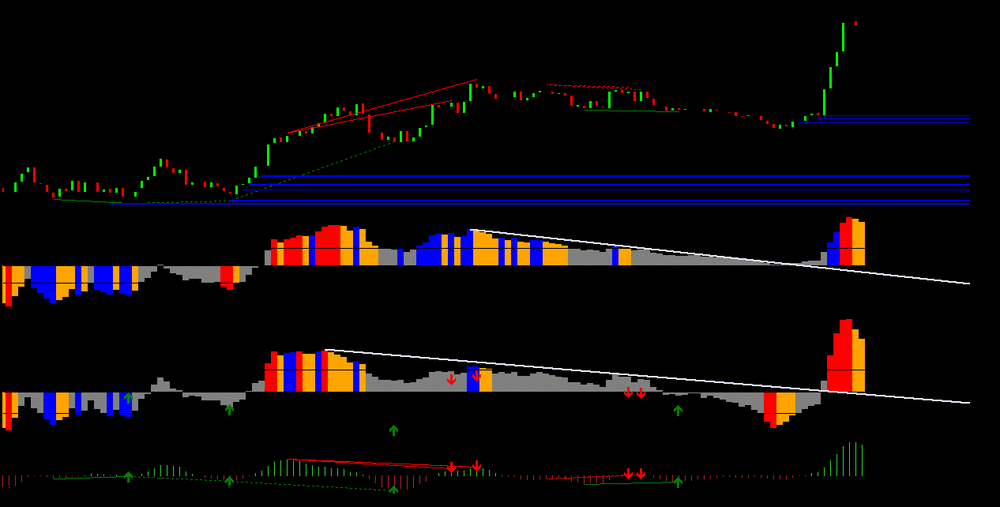
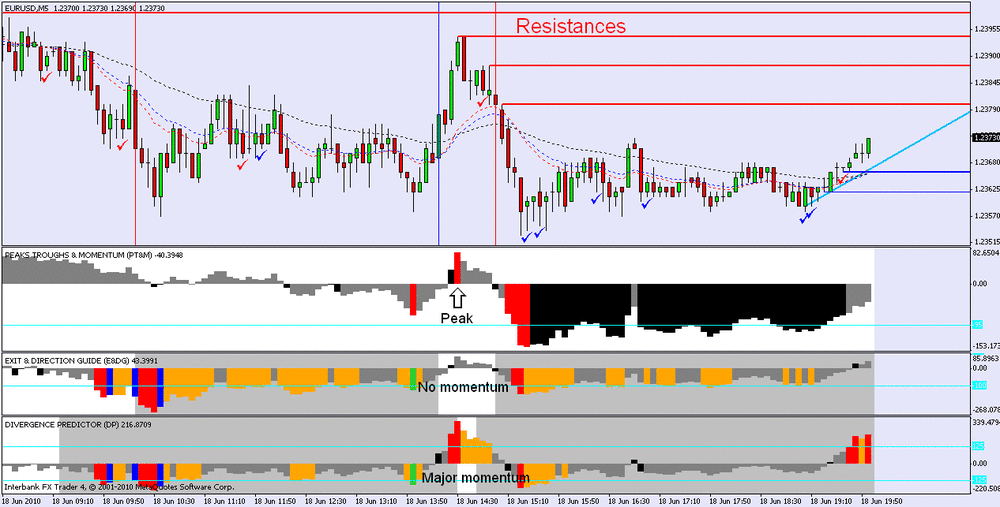
Momentum is the key to all trades in my filtration system and as momentum creates divergence, then the addition key is to seek out convergence and this is how reversals are detected.
Also conflict between momentum oscillators is an important area.
I trust the grab is self explanatory.
I am fully retired and part of that word is 'tired' - and that just about sums me up at the moment!

Knowledge is a great thing but can only be passed on or learned.
Regards
TEAMTRADER

How Much Profit Does the Average Successful Trader Make?
in General Trading
Posted
Hi Edgar,
The profitable trader can vary and no one can tell you what is average - or indeed what is good and what is great. They can only say what they have achieved or what their friends have achieved.
Best trader I know has profited 700% in 5 weeks but the pressure is enormous and he lost half of that in two days.
Different methods result in different profits and if you have a good method then stick to it and unless you run into a loss making period that is unacceptable to you, then refine it at that time.
Other traders can claim what they want but there is only one person that can judge your system against your profits and that is you.
If youd like help with you system I suggest you post your system and let experienced traders give their comments - and perhaps offer advice on how they would trade your system.
I'd be happy to help!
Be content with your lot unless it is not a lot!
Best of luck.
TEAMTRADER