
Welcome to the new Traders Laboratory! Please bear with us as we finish the migration over the next few days. If you find any issues, want to leave feedback, get in touch with us, or offer suggestions please post to the Support forum here.


drsushi
-
Content Count
32 -
Joined
-
Last visited
Posts posted by drsushi
-
-
the 250 tick chart method is a free scalping method he throws in if you buy the course. I bought the course and it is a ORB method. You do not know the entry price before the open. The E-book is very long winded and is purposely made to be 50 or so pages when you can explain the method on one page. The biggest draw back regarding the method is that he uses a 5 point stop with a 2 point and 4 point target. I've traded it a few times and then dropped it. I don't like the stop size for the target size and I don't like blindly entering just because the breaks an area and comes back to it.
-
Tasuki,
I'm pretty sure UT stand for Upthrust. SOT has got me stumped. Sign of....??
David
-
This is very nice. Thanks for this. This is similar to the Better Volume Indicator by the guy at Emini-watch.com. I like this one better because it seems easier to understand.
How did you get the candles to paint the same color as the volume. I have the volume, but no the candles.
Thanks again.
David
Hi EigerI've been hesitant to post the volume indicator I am using because I am not a very efficient programmer and also don't really want to start supporting indicators, but here it goes... Maybe someone can use this as a building block, or optimize the code.
The colors used are:
Green = Regular up bar
Dark Green = No Demand
Red = Regular down bar
Dark Red = No Supply
White = Same close than previous bar on higher volume
Yellow = Same close than previous bar on lowest volume in two bars
Magenta = Highest Volume of last two bars, smallest range of last two bar and at a 5 bar high or low.
I also plot the 20 bar moving average of volume and 1.5 and 2 times the average volume.
I am using MultiCharts, but the code should compile on TradeStation.
inputs:	PlotAvg(True),
	AvgLength(20 ),
	Val1(1.5),
	Val2(2),
	UpColor(Green),
	DownColor(Red),
	NoDemandColor(DarkGreen),
	NoSupplyColor(DarkRed),
	ChurnColor(magenta);

variables:
Vol( 0 ),
VolAvg( 0 ),
StdVal(0),
Body(0);

If BarType >= 2 then Vol = Volume else Vol = Ticks;

VolAvg = AverageFC(Vol, AvgLength ) ;
StdVal = StandardDev(Vol, AvgLength, 1) ;

Plot1(Vol, "Vol" );
If PlotAvg then begin
Plot2(VolAvg, "VolAvg" ) ;
Plot3(VolAvg * Val1,"SDV1");
Plot4(VolAvg * Val2,"SDV2");
end;


if C > C[1] then begin
SetPlotColor( 1, UpColor );
If Vol < Lowest(Vol,2)[1] then SetPlotColor(1,NoDemandColor);
end
else if C < C[1] then begin
SetPlotColor( 1, DownColor ) ;
If Vol < Lowest(Vol,2)[1] then SetPlotColor(1,NoSupplyColor);
end
else begin
if C = C[1] then SetPlotColor(1,White);
If Vol < Lowest(Vol,2)[1] then SetPlotColor(1,Yellow);
end;

If (Vol > Vol[1] and Vol > Vol[2]) and Range <= Lowest(Range,2)[1] and
(High = Highest(High,5) or Low = Lowest(low,5)) then SetPlotColor(1,ChurnColor);
-
Eiger,
Thanks for the explanation. That makes good sense. I was acctually refering to the bar prior to bar #1 indicated on the chart. That bar had high volume and narrow spread prior to bars 1, 2 and 3 forming. I thought that is what you mean about background. How far back to the left shoud we look when talking about background? Is there any rule of thumb on that. Also, in this example chart are there two trades here or do is waiting on the hidden upthrust necessary?
One area I have an issue with in all aspects of trading is what is my trigger to get in. Since VSA does not use things like a cross of this or that, what is generally the "trigger" for a VSA trade? Is it taking out the low or high of a bar depending on direction?
David
Hi David,I assume you are referring to bar #3 as the 'doji' type bar (circled). I don't think in terms of candlesticks, but many do. In any event, volume did increase on that bar and, unable to rally higher, it closed on it's low and below the low of the previous bar. The combination of an increased volume, narrower spread, close, and location of the bar in an overbought position in the trend channel is a clear sign supply has taken control. Because this market was in an overbought position in the trend channel, it was quite vulnerable to supply at that point and made this indication meaningful. Had this bar shown up elsewhere in the up trend, it might not have had such significance.
Background always dominates the individual bars. When the bar reflects the background as in this case, it becomes significant.
Typically, when significant indications of weakness appear as in this case, the market will tend to give us even more 'supporting evidence' as it unfolds. The small hidden upthrust three bars after bar #3 was one. Another is the widespread down bar closing on its low on an increase in volume (white arrows). This is a clear change in behavior since the uptrend began -- all other reactions were on light volume and narrower spread. This told us in advance that the demand line of the uptrend channel would likely break, which it did, and was further evidence of a more sizable reaction. This was followed by a weak rally (further evidence of change in behavior as rallies heretofore were on increasing volume, wide spreads, and stong closes), etc.
Keep comparing current bars and conditions with the background.
Hope this is helpful,
Eiger
-
Can you show why, from the perspective of the background, that this was a choice short?Eiger,
It wasn't my post, but I wanted to take a stab at why it was a choice short.
My guess is because there is a "doji" for lack of a better term on high volume. Very narrow spread on high volume so the background is indicating selling. I'm just learning, so please comment. Thanks.
David
-
Hi All,
I'm fairly new to VSA. Some of it seem simple while other aspects seem difficult. Somone has been teaching me thier version of VSA and I wanted to post a chart and get the opinions of those that know. Sorry if this is not the place for this chart. I wasn't sure on what thread to post it.
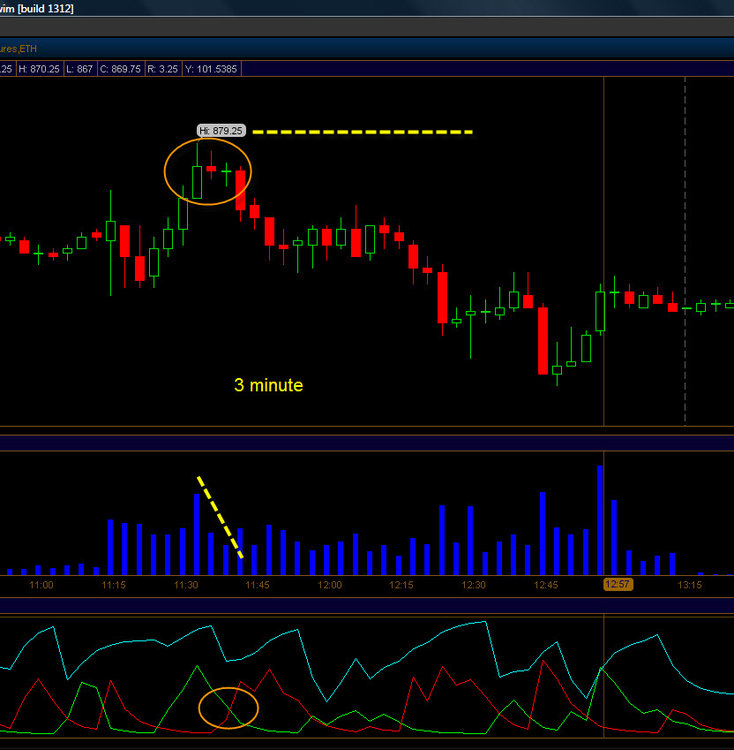
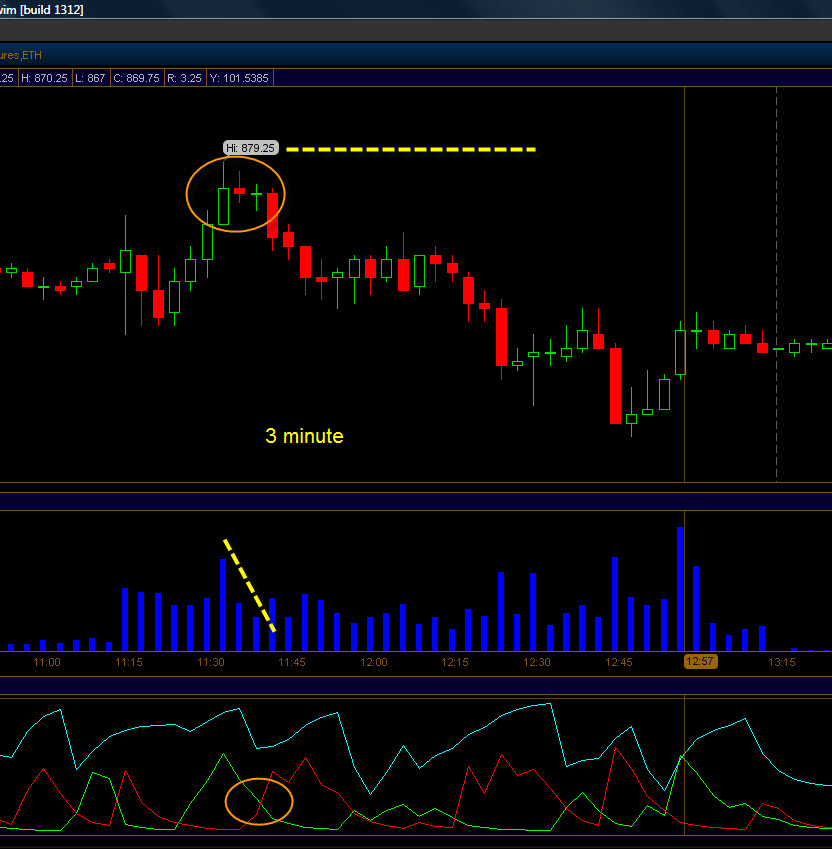
The cart is a 3 minute ES chart from 4/29/09. It could be a 5 min or even a 10 minute, but I used this 3 minute because it depicts the characteristics I've been told to look for.
1. Price is rising, but closing off the highs.
2. At the peak there is a high volume bar with price closing off the highs
3. There is a narrow spread bar on low volume. This indicates lack of buying power and the professionals desire not to take it higher.
4. the indicator at the bottom is a DMI and a cross occurs and price starts to fall off.
5. Price at around the 880 areas is a current or prior pivot level.
Question is: Does this seem like a reasonable interrpretation of Volume and or VSA?
Any feedback / comments are welcome.
David
-
Hello,
I've been interested in this pattern as well. I've posted a 60 minute chart of the ES. Someone posted one of the ES a few days back, so I'm assuming the large pattern is the same one that was posted a few days ago only on a 60 minute time frame. There is another pattern that seems to be forming on the lower right corner (blown up). I was wondering if what Im seeing is accurate. Thanks.
David

-
Hi,
this may be a dumb question, but what is an H1 bar? Is that an hourly bar?
Since what you have posted is for Meta could you make a suggestion as what I should use for Tradestation. I'm just getting into Forex and it would be great to start off with a good method.
David
-
Question, I've read on this thread that everything can bee seen in price. If divergence by definition is price moving one way while an indicator is moving the opposite direction, how can divergence be seen in price alone? Doesn't the concept of divergence require a second data point or source? Also, isn't a divergence just a heads up as to what may happen and not and indication of what will happen? And, aren't there indicators that have a volume component (Klinger volume) to them so that if there is a divergence part of that divergence is based on volume. I see many posts on TL that discuss price/volume divergences. Is that not part of VSA?
I just finished reading Trading in the Zone and from what I read and from my experience of being good a losing, it's more about what is between the ears then the method. If we have hour "minds right" then the rest will work itself out as long as the method over a reasonable number of trades provides a high enough percentage of winners to make one profitable. That doesn't mean 80-90% because money management plays a roll too. It seems to me, unless I am completely wrong that the order of importance is 1. mind right, 2. money management and 3. method. Please let me know if I'm full of it.
David
-
I was just wondering if any has done the code for PVP? If not, would one of the coding guru's on TL be willing to take that on for us? Thanks for all the work on the VWAP.
David
-
email,
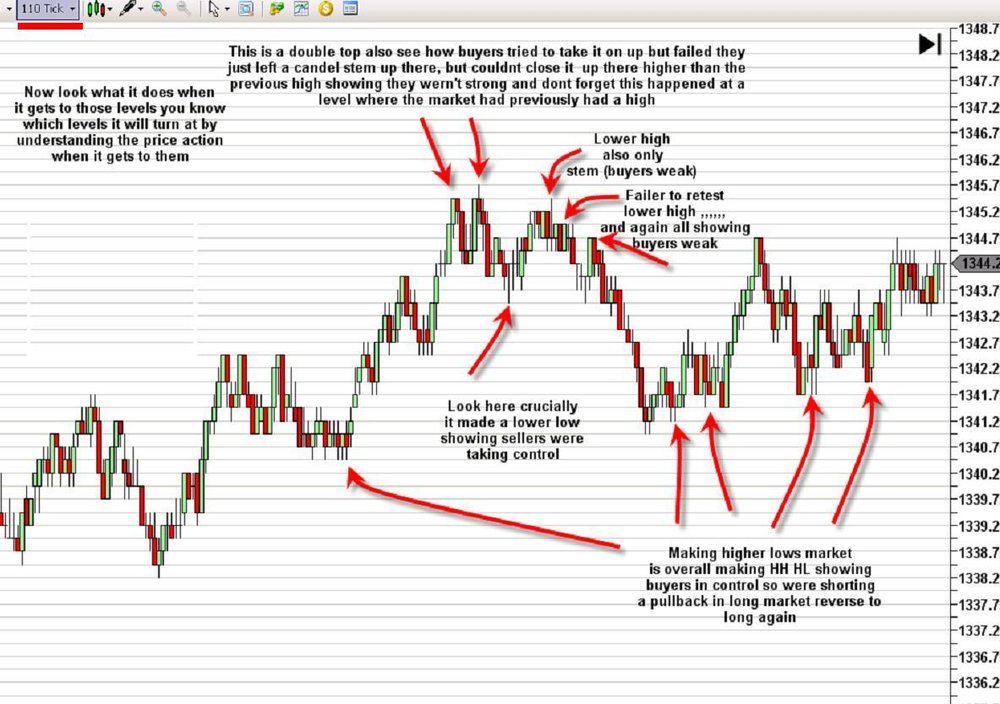
I may have been a little unclear in terms of the stop strategy. I agree that the volatility could kick one out a lot. I by no means am an expert and am still learning. Much of the info I was sharing I have learned from the google group. I think the intent of the strategy is to place a stop above a previous high or below a previous low depending on the direction of the trade, of course. In the group they discuss using 3 time frames. The longer time frame gives general trend and the lower timeframe give the trade setups and an even lower timeframe is used for entry. The main method discussed in the group is the use of the 777tic for trend, 110 tick for setup and 16 or 8 tic for entry. Higher timeframes such as a 60 minute or 240 minute etc are used as well. One thing that is emphasized a lot is that if you see a double top on the 110 tic and then a lower high on the 110 tic you that would indicate sellers taking control. Assuming the trend is down that day you could enter short with a stop above the previous high wich may be no more than 2 points. Please don't shoot the messanger. This is what is taught/shared in the group. As far as exits go I've read concepts of scaling out in thirds or quarters mainly from the Trade the Markets guys and the theory is that the sooner you can move your stop to break even or break even minus a tic or two the less risk you have. If you scale out in thirds at 4 tics for the first third, 6-8 tics for the second third and open target on the last third with a stop at break even after the second target, even if the last third scratches you have a profitable trade. That is the theory. Is it a good one? I don't know. I too would rather hold for 5, 6 or 10 points. I would love to hear about other exit strategies. One thing I was thinking of would be to take a 100% fib projection from the prior swing as a first target and/or a 127.2 extension as a target. I don't like the idea of limiting myself to a 1 point or 2 point target, but it does seem smart to scale out and limit the risk as quickly as possible. If you get a runner or even 6-10 points on your last third that is still pretty good, isn't it? Let me know.
If you want me to post a chart of example trades let me know.
David
-
Cosmic,
someone modified the code to smooth it out a bit. Is your code smoothed like that. I'd be interested in your version. Can you elaborate on what you mean by the divergences being more elaborate? Whould this be for daytrading?
David
-
Brown,
I'm curious as to why you would not take a trade long on the test of the red candle with the long wick/shadow. What is it you are watching/looking for etc. If it were me, I would have thought I missed the trade after if broke 74.75 and tested it and went on up to 80.75, or I would have chased. Thanks
David
-
Here is a chart of a possible trade. I did not take this trade and at the same time of trying to avoid cherry picking a perfect example, I also wanted to show and example that would explain the concept. I forgot to draw in the possible stop, but it could be just below the HL on the 16tic below entry or just at or just below the pivot if entering sooner.
The 4 to 6 tics I think is an acceptable profit target. I'm not sure if i'm understanding your comment. If 4 tics is not an acceptable profit target then it wouldn't be worth even trading. The idea is to have say 3 contracts and with a stop just below or above the previous low or high. The stop could be 1-2 points. If I hit my first target of 4 tics moving the stop to BE-2tics seems reasonable. Could go to BE or BE +1. Or, if second target is hit then move the stop to BE. From what I have learned, and I will say maybe the most valuable thing I learned from TTM is reduce risk. The fast we can get the stop to BE, of course with out getting stopped out too soon the better. In the attached example the trade played out in a positive way. The last third can be exited on some criteria or, manage it anyway you want moving the stop to preserve profit. I don't know the best way.
The Sanuk Group on Google talks about this method and many or most of the traders in that group trade with price action in this manner. They may use volume bars or minute charts, but many of them speak of this method. I am just presenting here, but it really hit home with me. Anyway, I've gone on long enough. Feel free to comment. One last thing. I do like to use the Volume Delta OSC that someone created on TL. It shows divergences very nicely and can give a heads up to a turn. Also, the way price action was explained to me is that its the buyers and sellers going at it and one of them will take control which in depicted in price. This makes sense to me.
David
-
i will have to post a chart tonight to show you what I mean.
David
-
I agree with the point that drawing the s/r lines can be a challenge. I believe the folks in the group do as you stated ant drawing them in advance such as the night before. Some S/R levels can be intraday levels as well. I like the concept of using floor pivots and the MP levels and I think that YH and YL are valid as well. One doesn't have to have every line on a chart. Actually, what I do in TS is have multiple workspaces. One workspace may be my Market profile workspace with POC;s and VAH and VAL. I then have a seperate workspace for pivots. It's farly easy to switch tabs. If price starts to approach a level one can go to a lower time frame chart with no lines, or draw in one horizontal line where price is approaching and see how it starts to react. I use pivots and MP by Suri Dudella and his stuff can be broadcast to as many charts as you want. So if I have a daily chart as a source chart of pivots, for example, I can braodcast the pivots to any chart of any other timeframe. I don't have to draw anything. This is not a pitch for his stuff it just works for me.
David
That is why it might make more sense to use static levels that are plotted before the day starts.I have not read the book so I can't recommend it, but there is a book specifically about this type of method called "Price Action Trading".
Some levels to think about could be:
1. MP levels (POC, VAH,VAL)
2. Yesterday's High (YH)
3. Yesterday's Low (YL)
4. Day Before Yesterday's High (DBYH)
5. Day Before Yesterday's Low (DBYL)
6. Key numbers (aka Floor pivots)
7. Actual pivot levels-places where the market did react/retrace/stall.
-
Brownsfan,
I agree with everything you said. My thought is to use floor pivots (daily, weely, monthy, yearly) and MP value areas and POC's as support and resistance levels and see how pirce action behaves around those areas. Also, my assumption is that if I stay with the trend on a higher time frame that will reduce risk. I hope that is an accurate statement. Also, my intension would be to use specifc targets for profit such as 4 tics, 6 tics and then moving my stop to B/E or B/E +1tic and letting my other 1/3 of the position run, but manage the trade and take profit at s/r. The last 1/3 should be a free trade at that point based on profit of the first 2/3 and moving the stop. This would be on the ES. I'm not looking to make a fortune in a day. If I can do what I just described on a consistent basis I would be very satisfied. Am I out of my mind or is it reasonable?
David
-
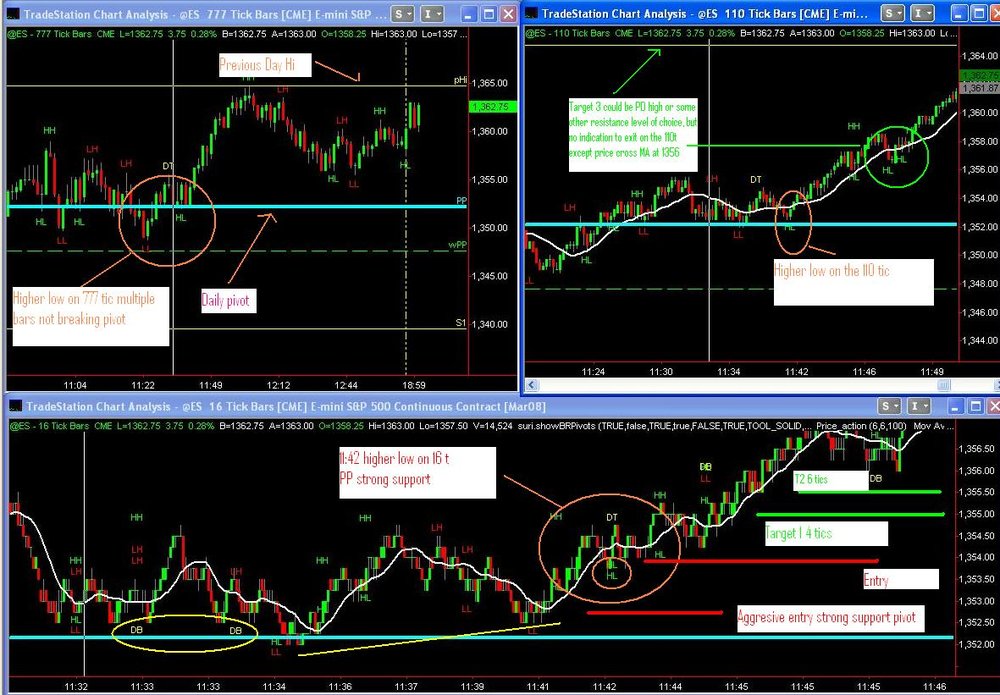
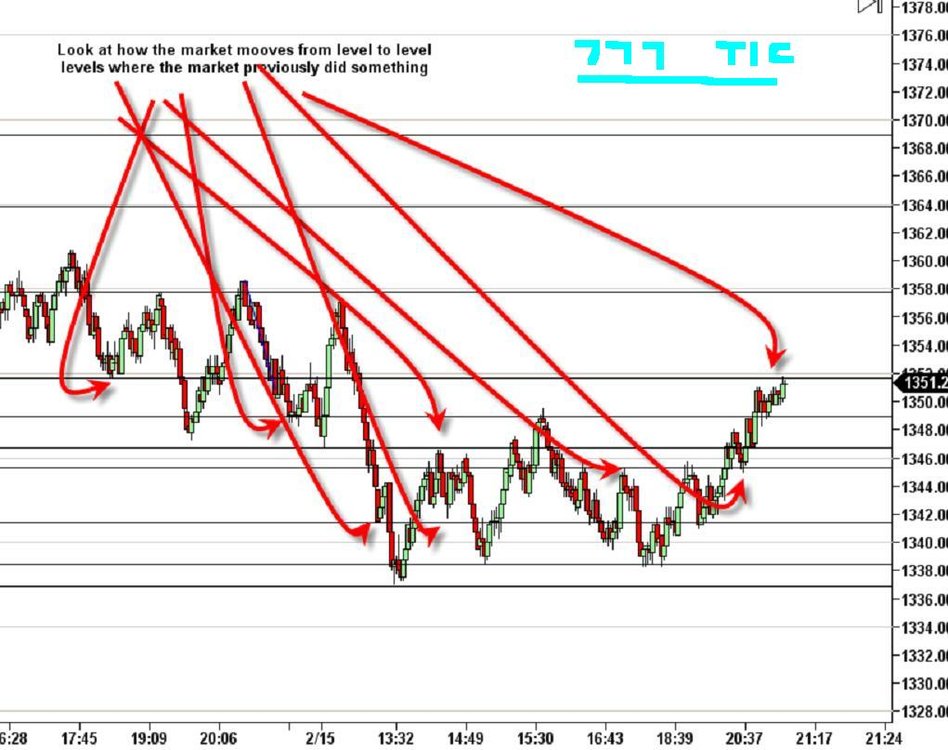
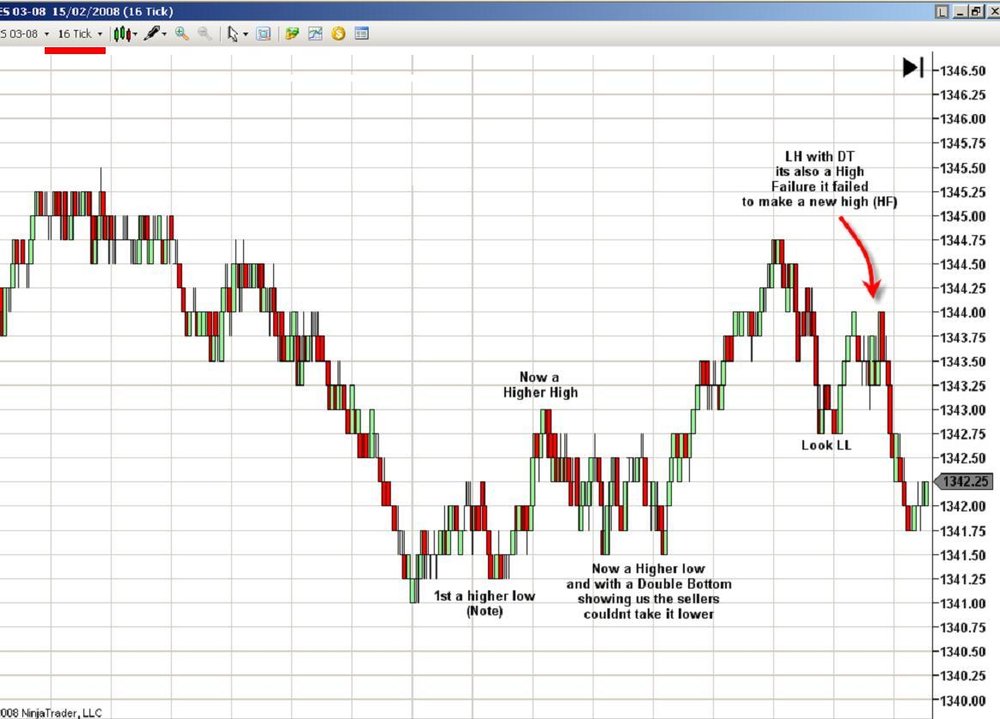
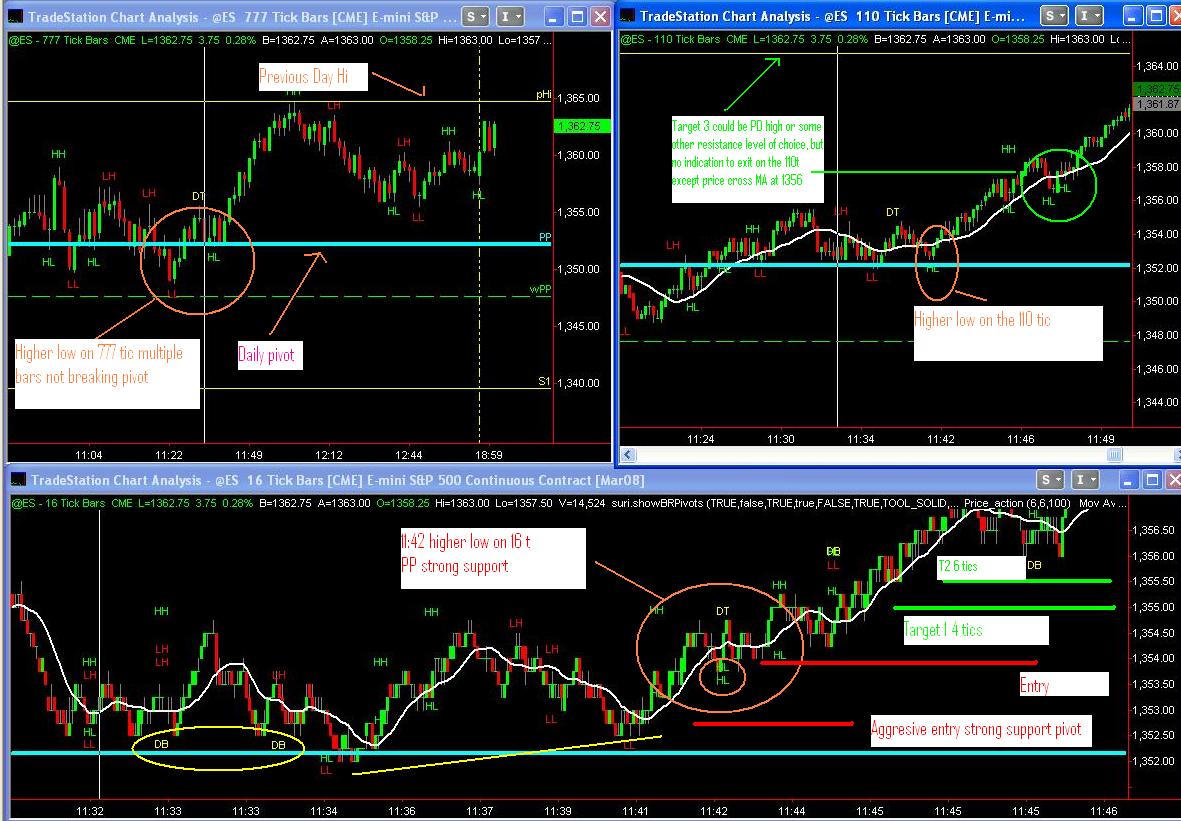
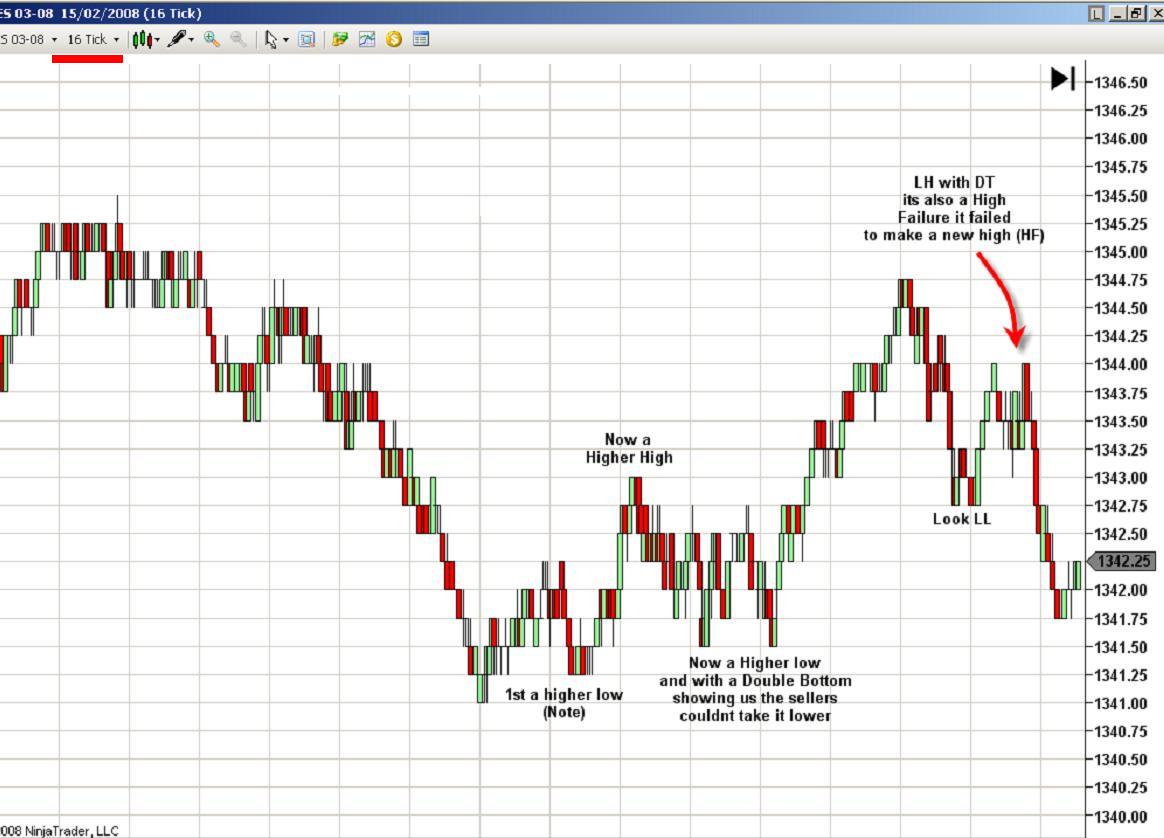
I joined a google group of traders that trades with price action alone. They use support and resistance areas from higher time frames and use multiple time frames down to 5, 8 or 16 tic charts for entry. The theory is based on six possible scenarios. A double top or lower high, these are both high failures, a double bottom or higher low, these are both low failures and higher highs and lower lows. If the low or high failure takes place at significant enough support or resistance there may be a trade to be had. I've attached (hopfully) 3 charts of 777 tic, 110 tic and 16 tic that is annotated. This is not something I put together. One of the traders in the group did to describe the method they trade by. I posted it for the interest of others and I'm also curious of the opinons of the followers of TL. I for one have struggled a great deal with the right indicator, TS add-on, timeframe blah blah blah and to tell you the truth this makes very good sense to me and If I use it with pivots and VAL POC and VAH for S/R I'm hoping it will have some merit. I'm fairly new to trading, so I'm hoping others with more experience will give thier thoughts.
David
-
I always liked this great article... if we had to apply to intraday a YM 1 min would look like this :pullbacks are clearly identified by small volume... well not much of a volume trader myself, but on this hyatus I am taking being reading some of this good volume stuff... still for me, price action is king... (specially revealed thru candles) maybe Martin could add some more articles on this thread, that would be awesome... cheers Walter.
Walter,
I've been trying to learn more about price action and trading with it. You mentioned price action being king espcially via candles. Can you suggest a book or article on candles that and how it provides info regarding price action?
David
-
Soul,
thanks for the post. I see what you mean by MP being as simple or complex as you want to make it. Are these MP patterns you speak of such as P shaped etc. in the MP book you've talked about before? Is that the Stodemyer (sp) book?
In your last chart you have a blue highlight on the volume bar. Are you indicating that volume is less on that bar even though price is higher? In another post you said you don't use the volume delta ocs because you read volume. Does one read volume in the same manner? in other words, are you looking for the divergence of volume vs. price such as in the second chart?
thanks again,
David
-
You had said you use MP levels as areas to read price and look for patterns that give you indication as to what type of day we will have, or the patterns give you indication how to trade accordingly. You had said that you don't use patterns such as triangles, so I was aksing if you would post charts showing the types of patterns you look for and what it is they tell you.
-
I started a new thread under the technical analysis section.
D
-
I started this thread at Soul's request. He will be posting some charts. As always, feel free to contribute.
David
-
Soul,
My intension was to us MP pivots as well as floor pivots as S/R and trade those areas in addition to previous highs and lows for the previous day. I would watch price at the these respective pivots on a higher timeframe and moved down to ower timeframs to see if there are high or low failures depending on the direction and trade based on that.
Would you be willing to go into greater detail when you talk about pattern recognition? I read that you don't use things like triangles etc as patterns. I'm assuming you don't mean double tops or bottoms either. Also, how does this (these patterns)give you insight as to what kind of day we may have? If you have examples you can post that would be of great help to me. Thanks.
David


Sandbox
in The Wyckoff Forum
Posted
Hi,
Just thought I'd comment on one chart. SUV could be a long setting up. At weekly support and momentum has been shifting to more bullish. I've attached a chart with some comments. Just my opinion.
David