
Welcome to the new Traders Laboratory! Please bear with us as we finish the migration over the next few days. If you find any issues, want to leave feedback, get in touch with us, or offer suggestions please post to the Support forum here.


jojojo
-
Content Count
58 -
Joined
-
Last visited
Posts posted by jojojo
-
-
Hi
is anybody aware of a datafeed vendor , who offers this feed from deutsche börse ?
regs
Jojo
-
Phantastic - thanks a lot
kind regs
Jojo
-
Anybody has got the latest TS vers. 9 .13?
They anounced build in seconds charts? (well - after ~years)
Any experiences?

Regs
Jojo
-
here is the T3 function - maybe somekind usefull adaptive smoothing ...........
call T3Average(value1,Length) in an indicator
{ *******************************************************************
Function : T3Average
Last Edit : 12/14/97 - 05/01/99
Provided By : Bob Fulks
Recoded By: : Clyde Lee for speed and really simple function
Description : This function is an EasyLanguage version of the
moving average described in the January. 1998 issue of TASC,
p57, "Smoothing Techniques for More Accurate Signals", by Tim
Tillson. It is translated from the MetaStock code presented
in the article. The function was modified by C. Lee to not use
any call to external exponential average function but rather
perform the same operation internally. This saves the
overhead of a bunch of calls to the XAverage function. This
modification increases speed and allows variables as inputs.
The variable, "b", is a damping coefficient which is set to
the suggested default value of 0.7. The variable "b" is
substituted for the variable, "a" used in the article since
"a" is a reserved word.
The resulting indicator plotting this function appears to
duplicate the results shown in Figure 4 of the article.
Damp: A damping factor = any value between +100 and -100:
-100 = No damping (with ringing)
0 = Critically damped for a triangle wave.
+100 = Overdamped
Lag: The lag in bars is given by:
Lag = (Length - 1) * (1 + Damp / 100) / 2
The Lag is equal to the lag of an exponential or simple
moving average of the same "Length" when Damp = 0. When
Damp = -100 then Lag = 0 but there is ringing and overshoot
as with a linear regression value.
© 2000 Bob Fulks, All rights reserved.
only portion dealing with damp ! ! !
********************************************************************}
Inputs: Price(NumericSimple), Period(NumericSimple);
Variables: e1(Price), e2(Price), e3(Price),
e4(Price), e5(Price), e6(Price);
Variables: XAlpha(2/6), XBeta(0), OldPeriod(-999999);
Vars: damp(-70),
b(-0.01 * damp),
aa(b*b), aaa(b*b*b),
c1(-aaa), c2(3*aa+3*aaa),
c3(-6*aa-3*b-3*aaa), c4(1+3*b+aaa+3*aa);
If Period<>0 then begin
If Period<>OldPeriod then begin;
XAlpha=(2/(AbsValue(Period)+1));
XBeta=(1-XAlpha);
OldPeriod=Period;
End;
e1 = e1*XBeta + Price*Xalpha;
e2 = e2*XBeta + e1 *Xalpha;
e3 = e3*XBeta + e2 *Xalpha;
e4 = e4*XBeta + e3 *Xalpha;
e5 = e5*XBeta + e4 *Xalpha;
e6 = e6*XBeta + e5 *Xalpha;
T3Average = c1*e6 + c2*e5 + c3*e4 + c4*e3;
End
Else T3Average=Price;
-
offcourse you are right - the example above was just for simplifying.
I got a variable that gives these values , measuring the time between ticks.
I achieve this with GetMachineTime dll and displaying in microseconds
then subtract microtime -microtime[1]
then invert the value - there the error occurs
my time is local thats no problem
-
Thank you for clear this - the point with unseen decimals was it - while I
do not understand,why the inverted value is not printed ( in the print log)
the only thing I get sometimes is " positive infinity " ...........
maybe this is due to division with zero ?
-
Hello
A very simple question : How can I inverse a value and plot it?
I'm a little confused - if I say (for example):
Value1 = 2583;
Value2 = 1 / value1;
Plot1(value1);
Plot2(value2);
Here I got Plot2 with zero.
If I say:
Value1 = 0.2583;
Value2 = 1 / value1;
Plot1(value1);
Plot2(value2);
I got a correct Plot2 with 3.87
????
Thanks
Jojo
-
at last anything he offers is for sale - that's it and you can not negotiate
the idea of time /tick speed is not new
-
Oh - Now the cat is out - clever marketing , chapeau
-
The whole thing is a function - poc=vapivot; in the last queue.
But right the TL_SetAll is missing .
-
Nice Code - too complicated for my small brain.

I do not understand your TL_SetAll. Is it a function or is it used in MC?
Without there is something important missing ,I believe.
Regs
Jojo
-
-
Hi
I found an old MurreyMath Indicator (really it's 4 with several functions in it);I was able to
import it to my 8.+ vers of TS, but then ..........
TS crashes . Must be somekind of incompability downwards , maybe it was programmed in an older vers as even 2000i , I guess........
You can't even see the code , but it verifies.....
very strange.
So I do not !! recommend to import it in newer vers.of TS.
But maybe someone has older vers.running and can reproduce the code as text within.
regs
Jojo
-
-
Nobody with newer TS vers.?
-
-
-
Hi
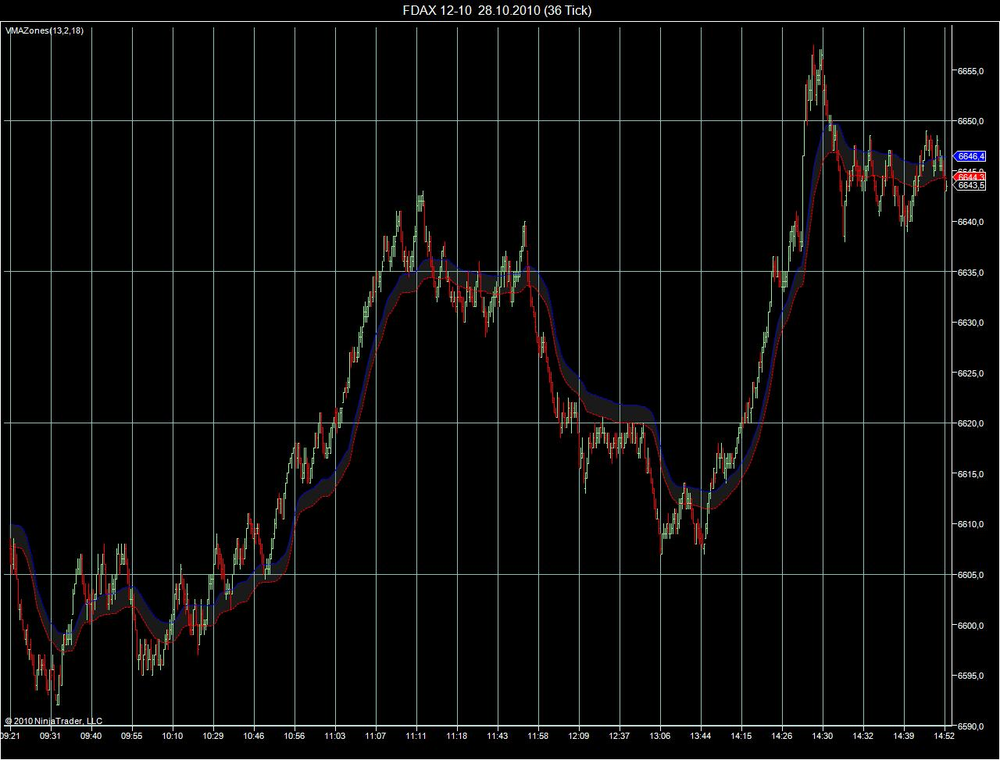
I found this very interesting tool for Ninjatrader.
It's a mix of a vidya and a kind of so called cmo-momentum oscillator,
which uses up and downticks - so far my understanding.........
Someone may be able to convert this to EL ?
Thanks a lot
Jojo:helloooo:
-
I played around with it some time ago.
You have to use BarHigh/BarLow and check the average volume of your
instrument.
Regs
Jojo
-
I missed this "intensity"thread , and worked through it a few hours ; )
interesting , how often people got the same ideas at the same time (sometimes)
anyhow ,I think I tried to convert this to intensity in the past but did not suceed and left it.I believe I gave up on this "tick-based" chart construction thing instead of "time based" in TS.
Maybe you can post a link to your charts, I could not find them.
regs
Jojo
-
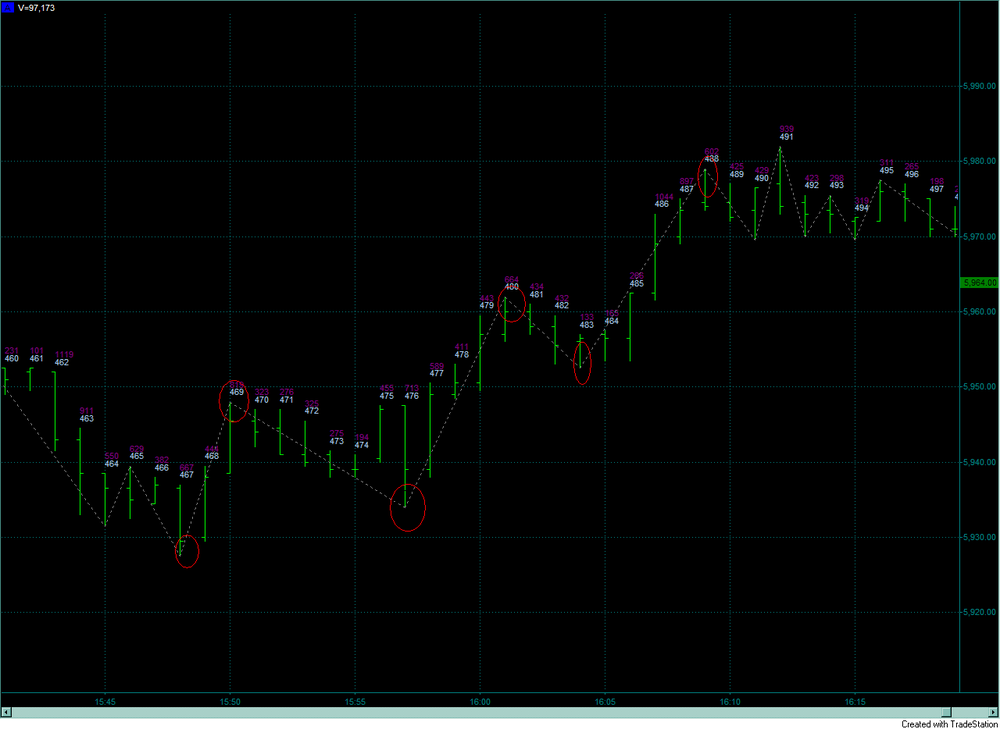
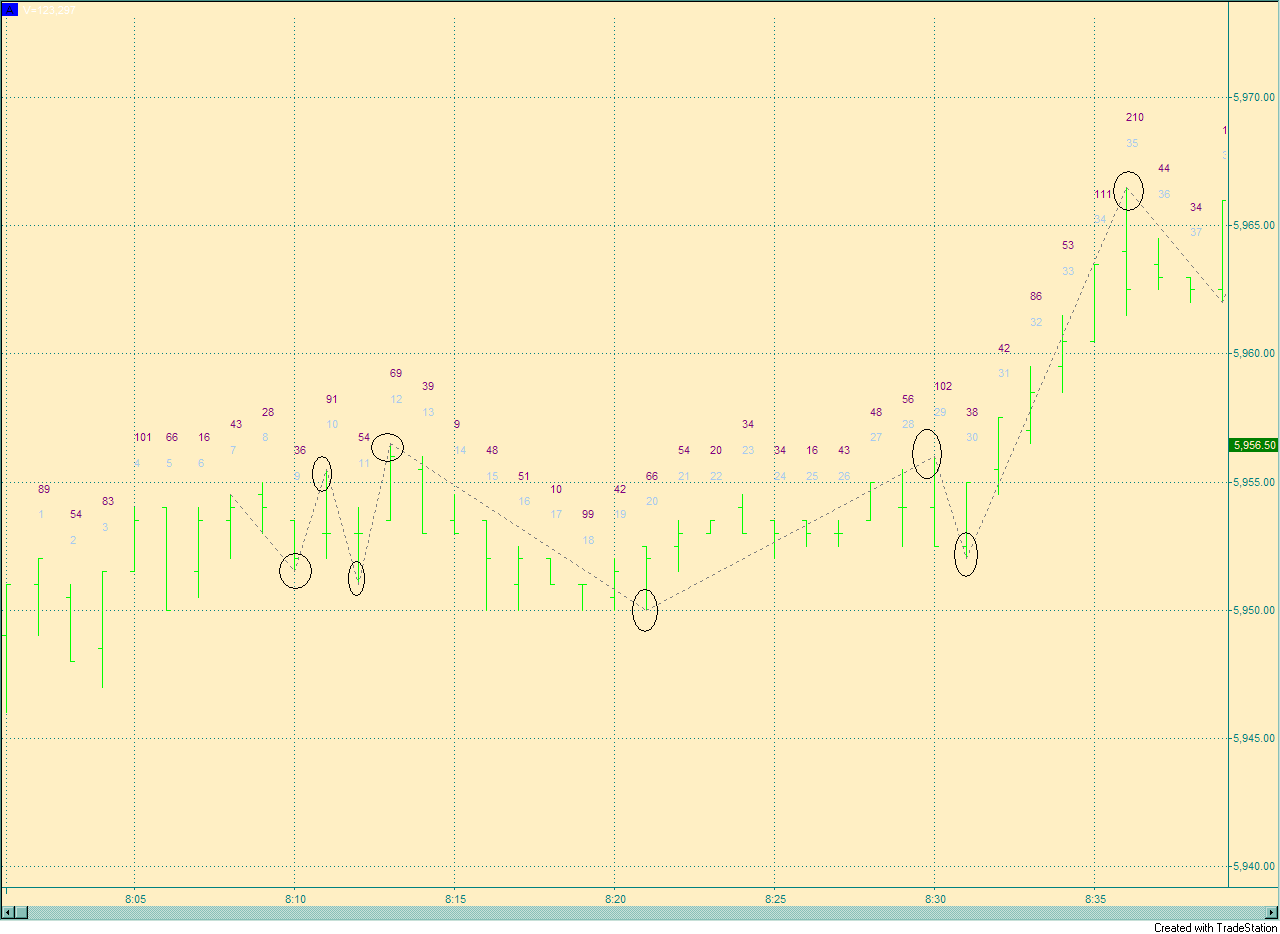
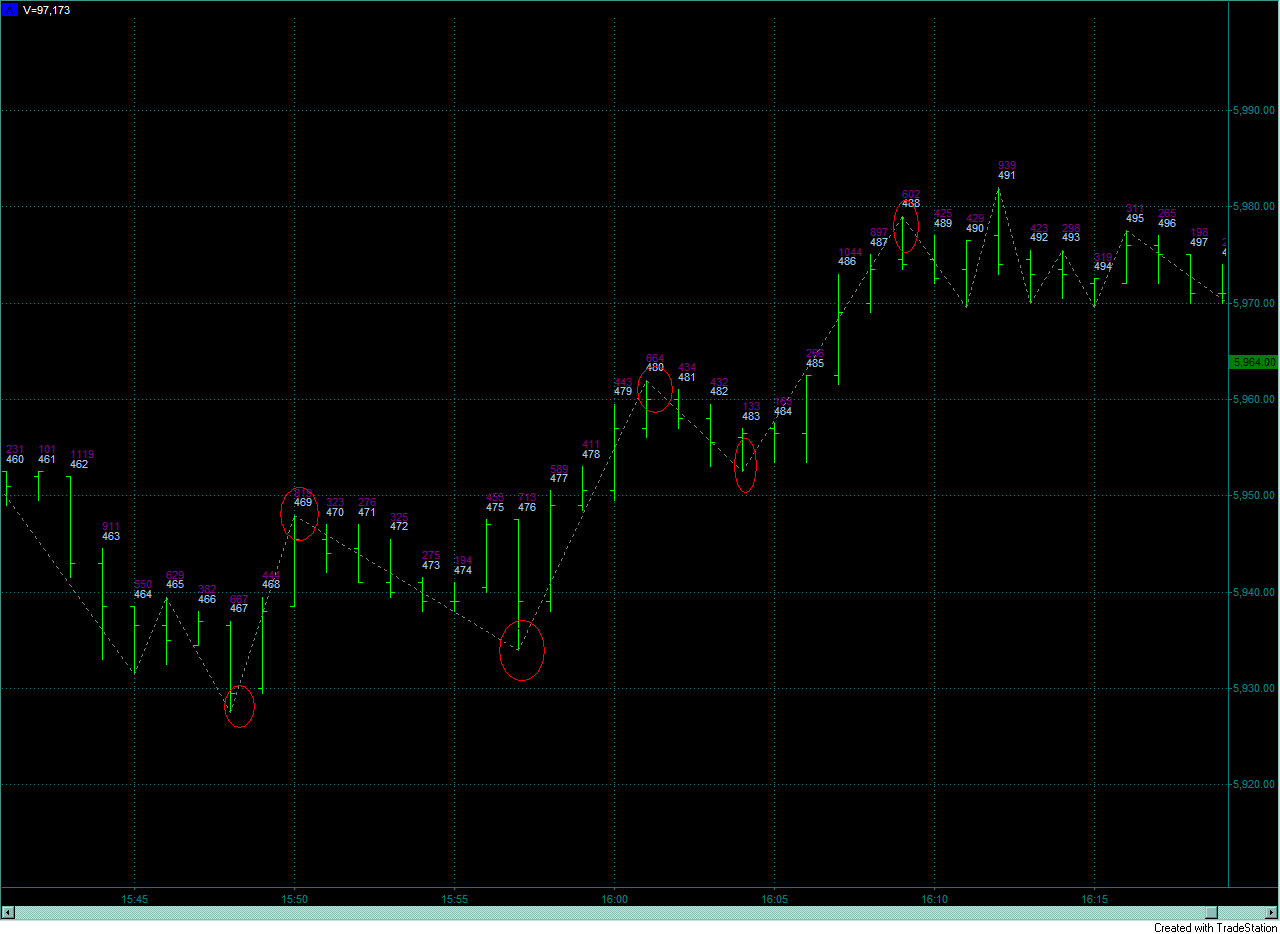
the ovals are the pivotpoints the ZZ calculated , I do not mean classical pivots like H+L+C/3 or that stuff - maybe better call it swingstart/end - points or similar.........
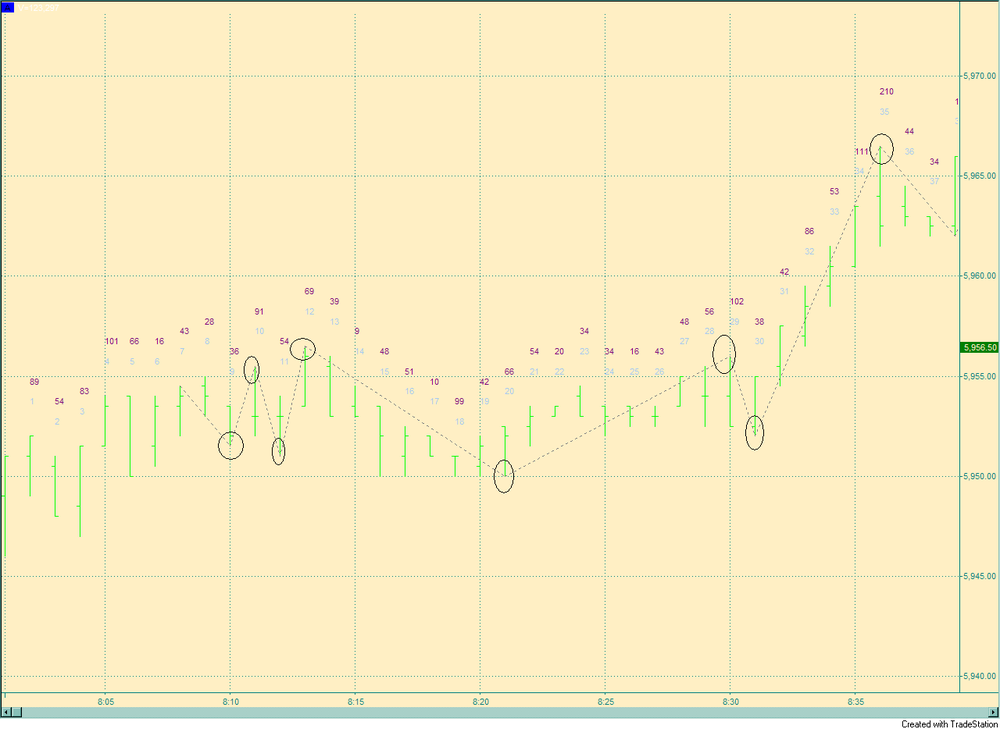
-
SwingHiBar does not really help , here s a pic with a ZZ , barnumbers and corresponding ticks.How can I accumulate the ticks from one pivot to the next?
-
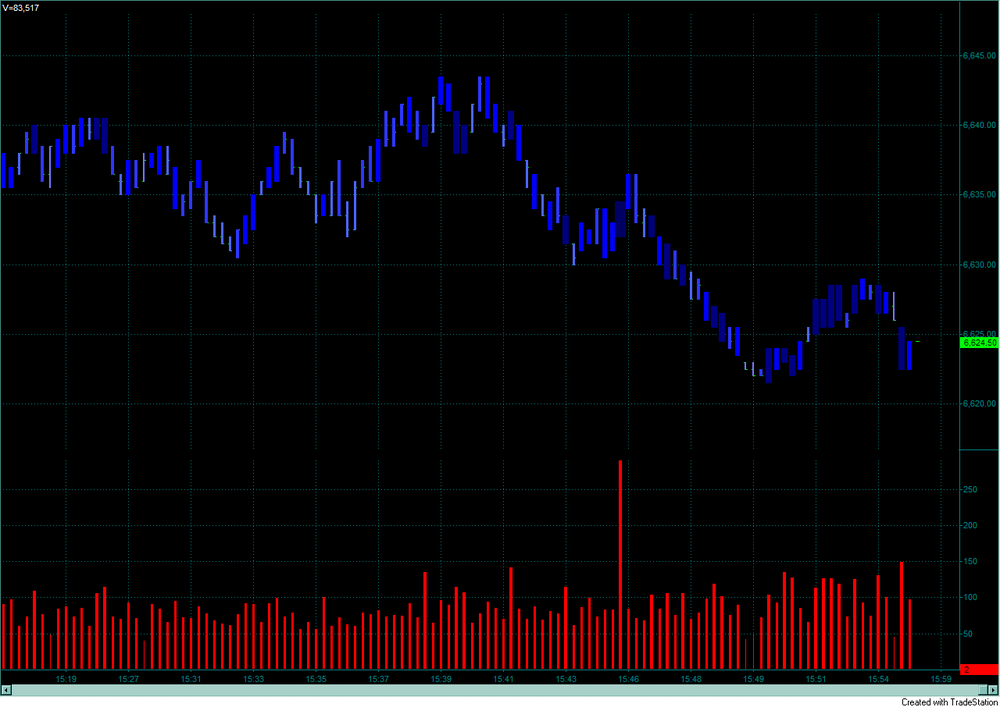
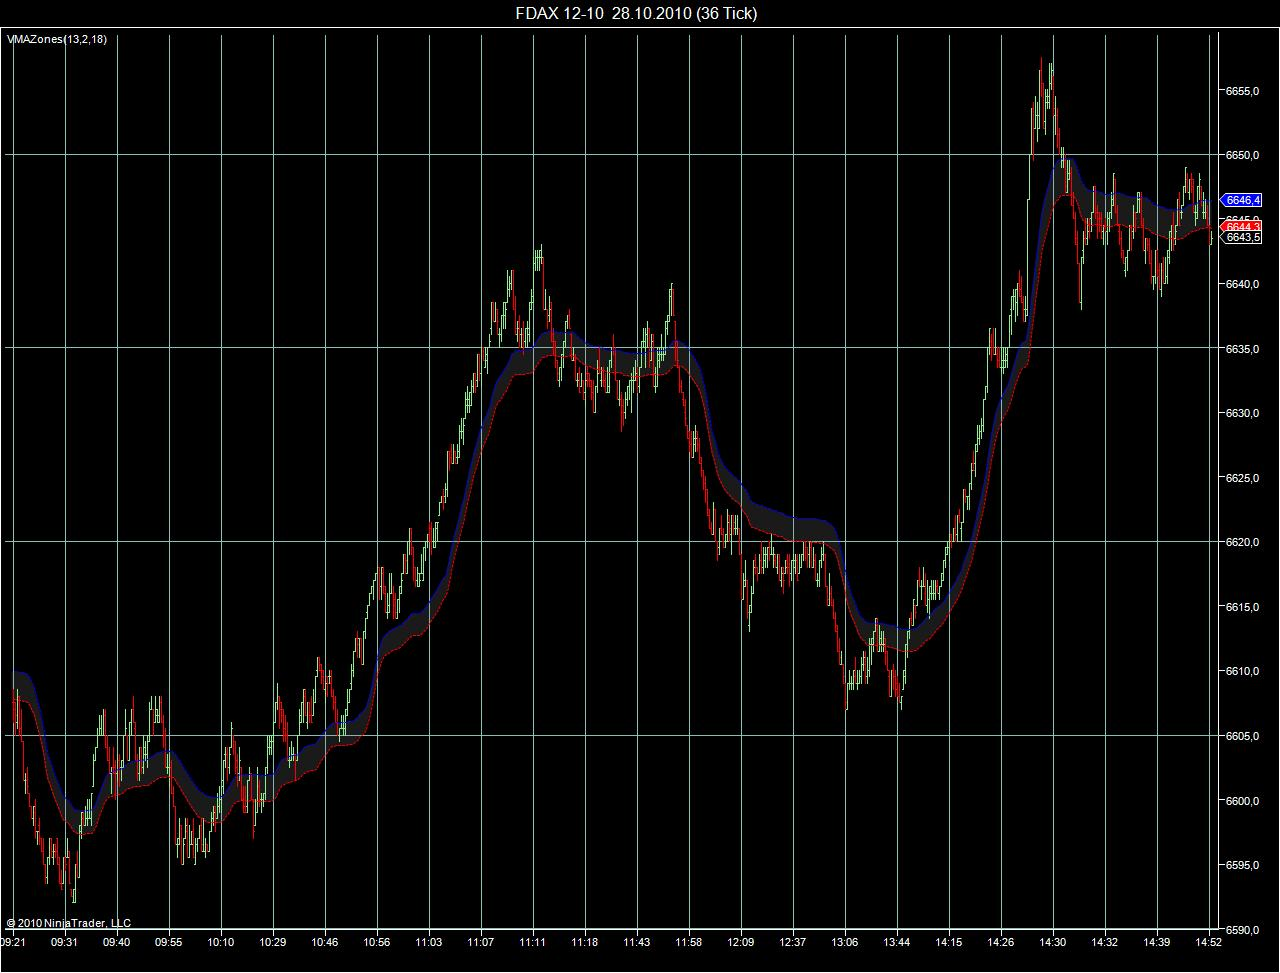
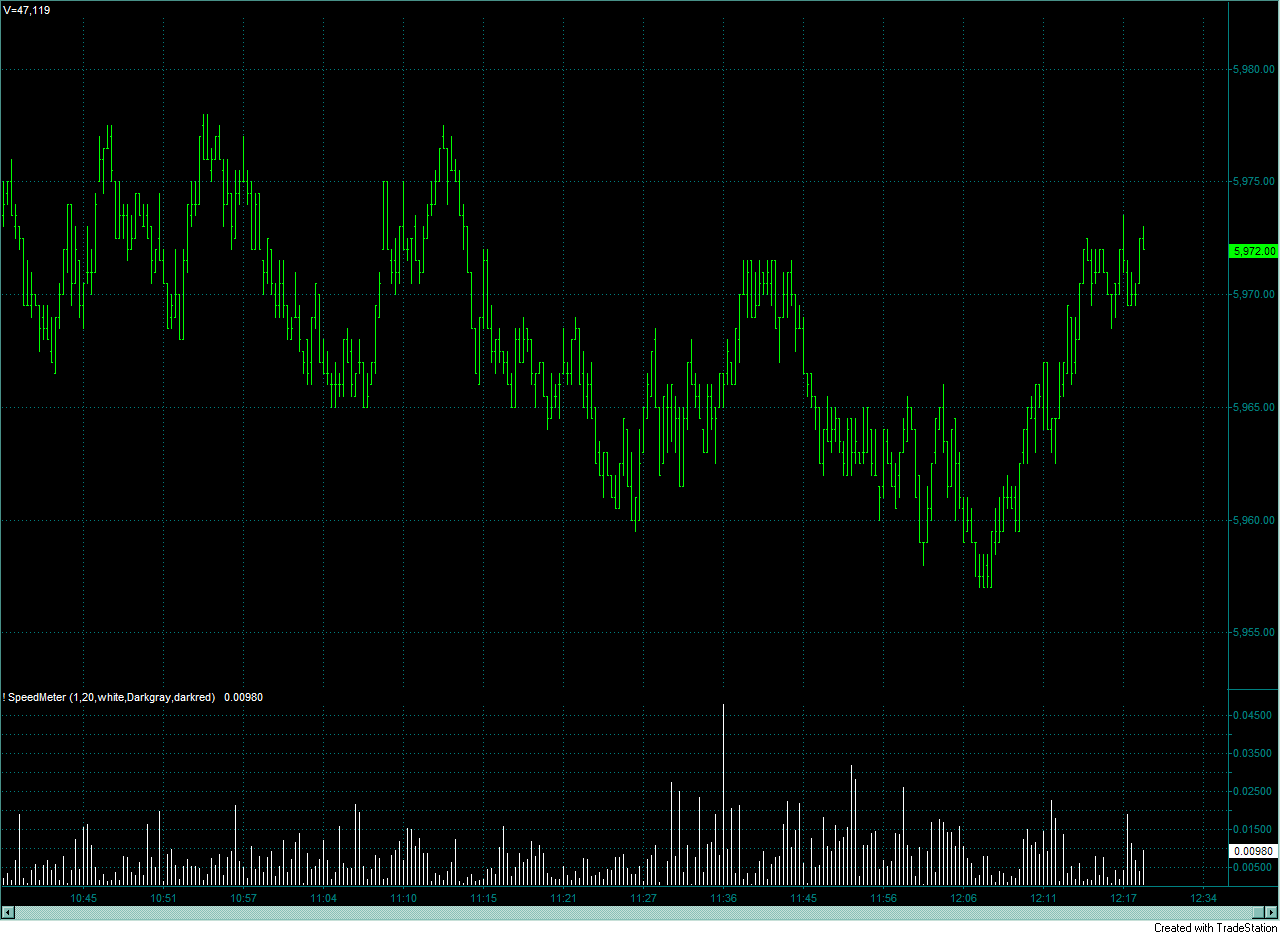
Here's a pic of a 21 tickchart;
it works the other way round - the smaller the histogram ,the faster is trading
regs

-
Hi Coders
small question :
How can I exactly determine the barnumber of a certain pivot ?
If there's any existing code example for TS please let me know.
Thanks
Jojo

Volume Splitter
in Coding Forum
Posted
Hello
I'm here a little late - but I have some suggestion:
Just an idea......
I thought it could be very usefull to be able to reset this indi
- at certain times
- at Pivotpoints
- all n minutes
or similar.....
so for my suggestions it could be much more helpfull then.
Any ideas how to do this ?
regs
Jojo