
Welcome to the new Traders Laboratory! Please bear with us as we finish the migration over the next few days. If you find any issues, want to leave feedback, get in touch with us, or offer suggestions please post to the Support forum here.


jojojo
-
Content Count
58 -
Joined
-
Last visited
Posts posted by jojojo
-
-
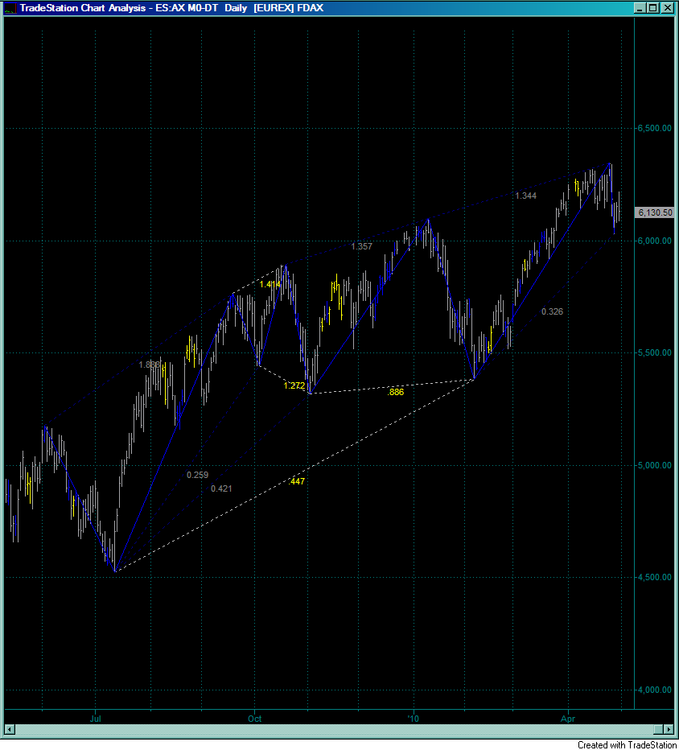
Could rather be this way round, too

that's patterns ................:rofl:
-
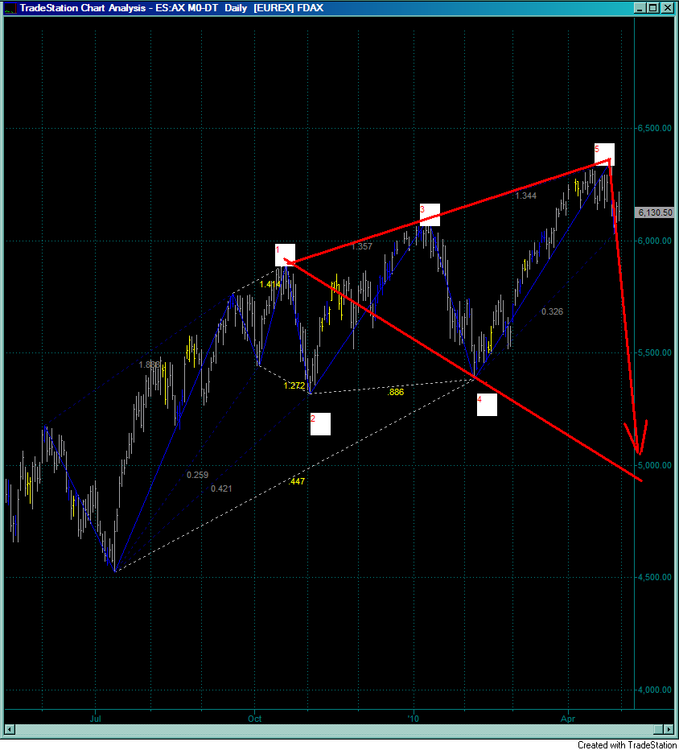
I think this belongs more to " art of trading".......

how would you read this here? It's the daily fdax with it's actual pesavento.
regs
-
Thanks very much.Does anybody know where to get some theoretic background for these patterns?
Regs
-
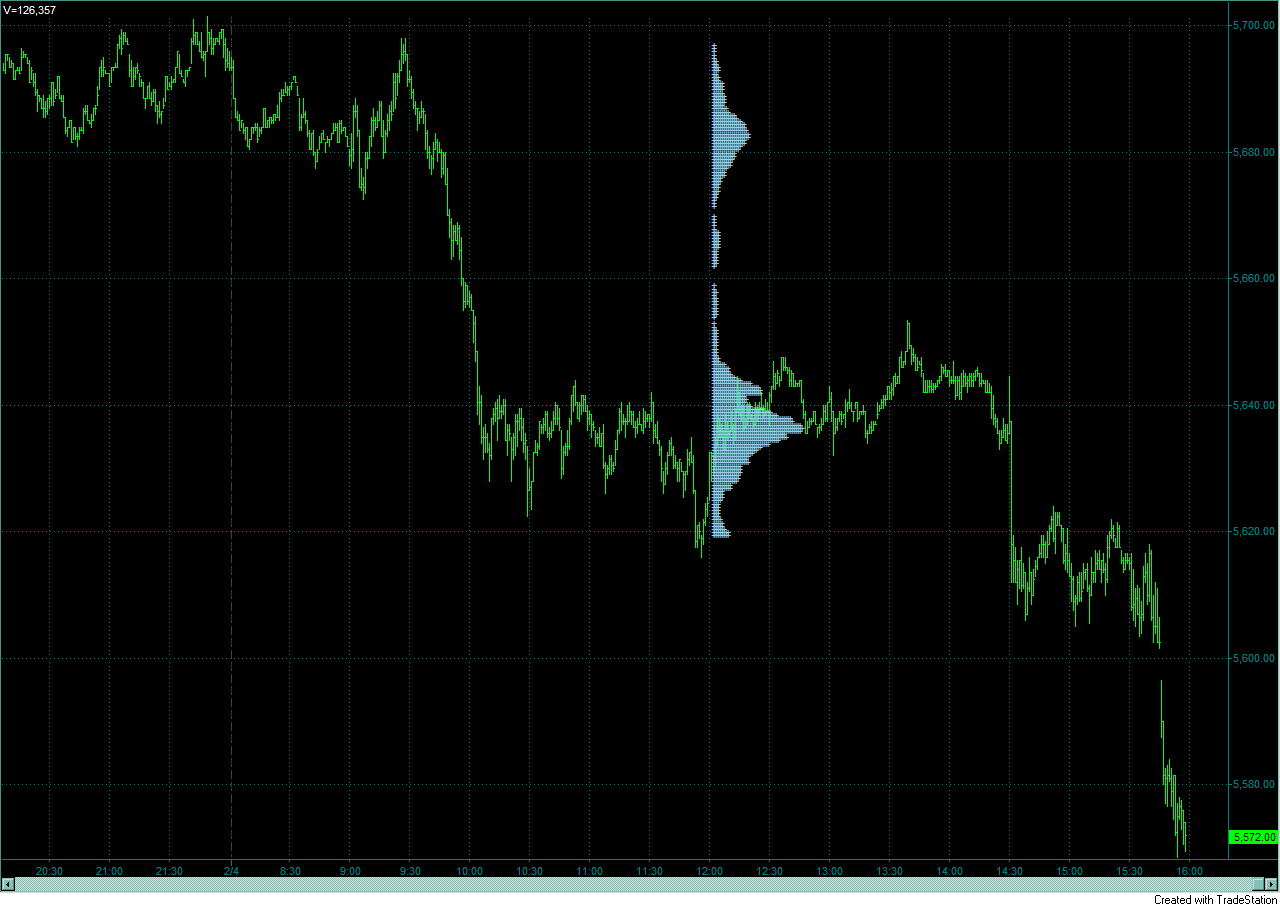
yes that' s what it looks like.The lines are the Poc's of the last days which should be en/disabled via input(showpocs) , but is not yet integrated and the todays volume distribution is shown as text with the "x" es.But I'm not clear with it how it's calculated.
At the end the x'es vol-distribution should be fix on the screen and not move with the bars.
puh
-
Hi
I do not want to mix in your discussions, but this is the coding forum.
there are a lot of interesting informations here about marketprofile,value area and this whole stuff.just do a search.I found the programmatic side of visualization of the MP is very sophisticated and on a higher proglevel, so my thought was maybe someone better than me could make some efforts on this code .It's only rudimentary for my opinion, so nothing to take only and that's it.It has to be developed a bid further.
regs
-
Hi all out there,
I found an interesting MP alternative , but it has to put some work on it
for better handling purposes.If anybody' s got some time to develop further
please ..............
regs
Jojo

-
Could you please explain definition of stitches and harmonics?
Thanx
-
Here is a Darvas Box.There is drawbox and drawline function inside .Maybe you can use this for construct your congestion box.
regs
Jojo
-
no problem
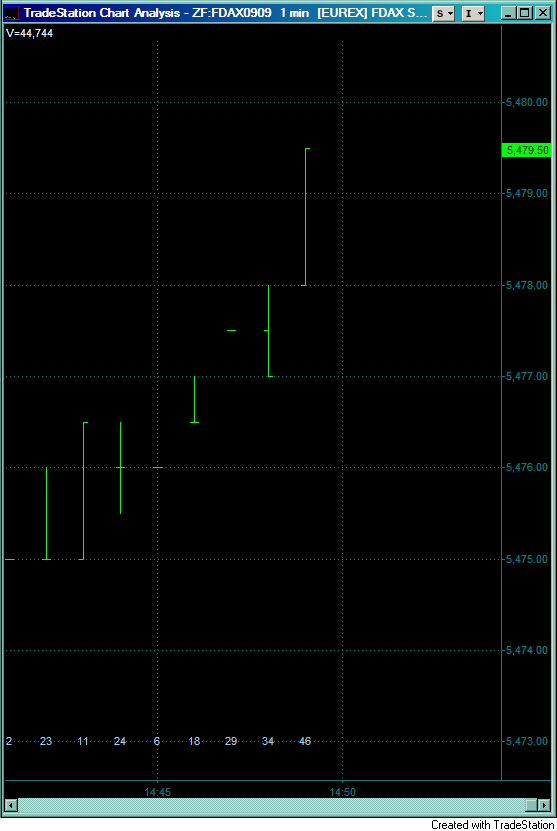
here you go - as you noticed , I took ticks in this example
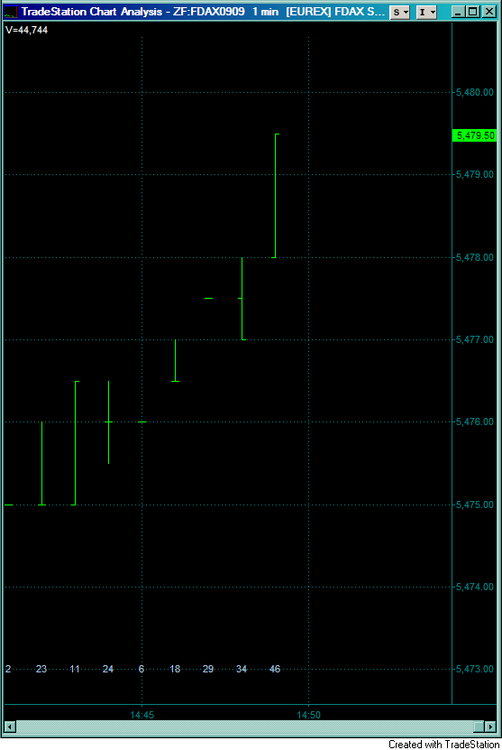
-
you need the function Text_Float.
Best use is on minute charts - (as always on this time-based old tradestation grave)
-
here is a nice trick to plot text vertical (and keep it there):
inputs:
P1 (5);
vars:
intrabarpersist Low_P(0),
intrabarpersist TxtID(-1);
Low_P = GetAppinfo(aiLowestDispValue)+0.25;
TxtID = Text_New(Date, Time,Low_P,NumToStr(Ticks,0));
if TxtID >= 0 then
begin
Value1 = TextFloat( TxtID[0], 0, P1 ) ;
Value1 = TextFloat( TxtID[1], 1, P1 ) ;
Value1 = TextFloat( TxtID[2], 2, P1 ) ;
Value1 = TextFloat( TxtID[3], 3, P1 ) ;
Value1 = TextFloat( TxtID[4], 4, P1 ) ;
Value1 = TextFloat( TxtID[5], 5, P1 ) ;
Value1 = TextFloat( TxtID[6], 6, P1 ) ;
Value1 = TextFloat( TxtID[7], 7, P1 ) ;
Value1 = TextFloat( TxtID[8], 8, P1 ) ;
Value1 = TextFloat( TxtID[9], 9, P1 ) ;
end;
enjoy
-
I would appreciate some kind of respect .I remember such guys as you we had at school long time ago, and I know why I would never meet them again.
This is a forum where people help each other in a civilized and positive way.

-
It does not work with 2000i.
-
Perfect answer that helped a lot thank you very much
-
Hallo guys
I wonder how to connect zen-fire and tradestation.I'm using owndata vers.2.7with the zen-dll and a demo account from zen-fire.It works perfect in ninja trader but I could not connect owndata to it , I always get "market data connection broken" no matter what I try.
Has somebody of you a step by step explanation how to do this?
Thanks
Jojo:confused:
-
-
Hi
I posted a pic and an eld , too,yesterday
is a little bid strange - vanished
-
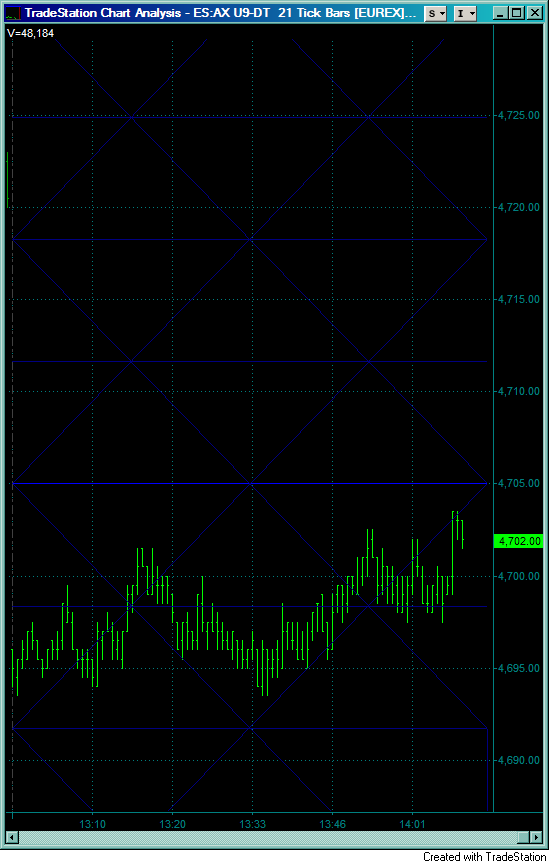
Hi folks and friends of technical analysis
Here' a classic one , G.H.Cramer wrote in 05.
I had to modify a bid so it seemes to work correctly even on tick-charts now.
I love this geometric stuff.
some info here:missy:
http://www.dacharts.org/archives/Alans_Lessons/_less/alans_method1.htm
Kind regs
-
-
sorry made mistake in the above post - not able to edit this:confused:
-
hi there
to push this a step further I worked a bid on this : please see attached pic
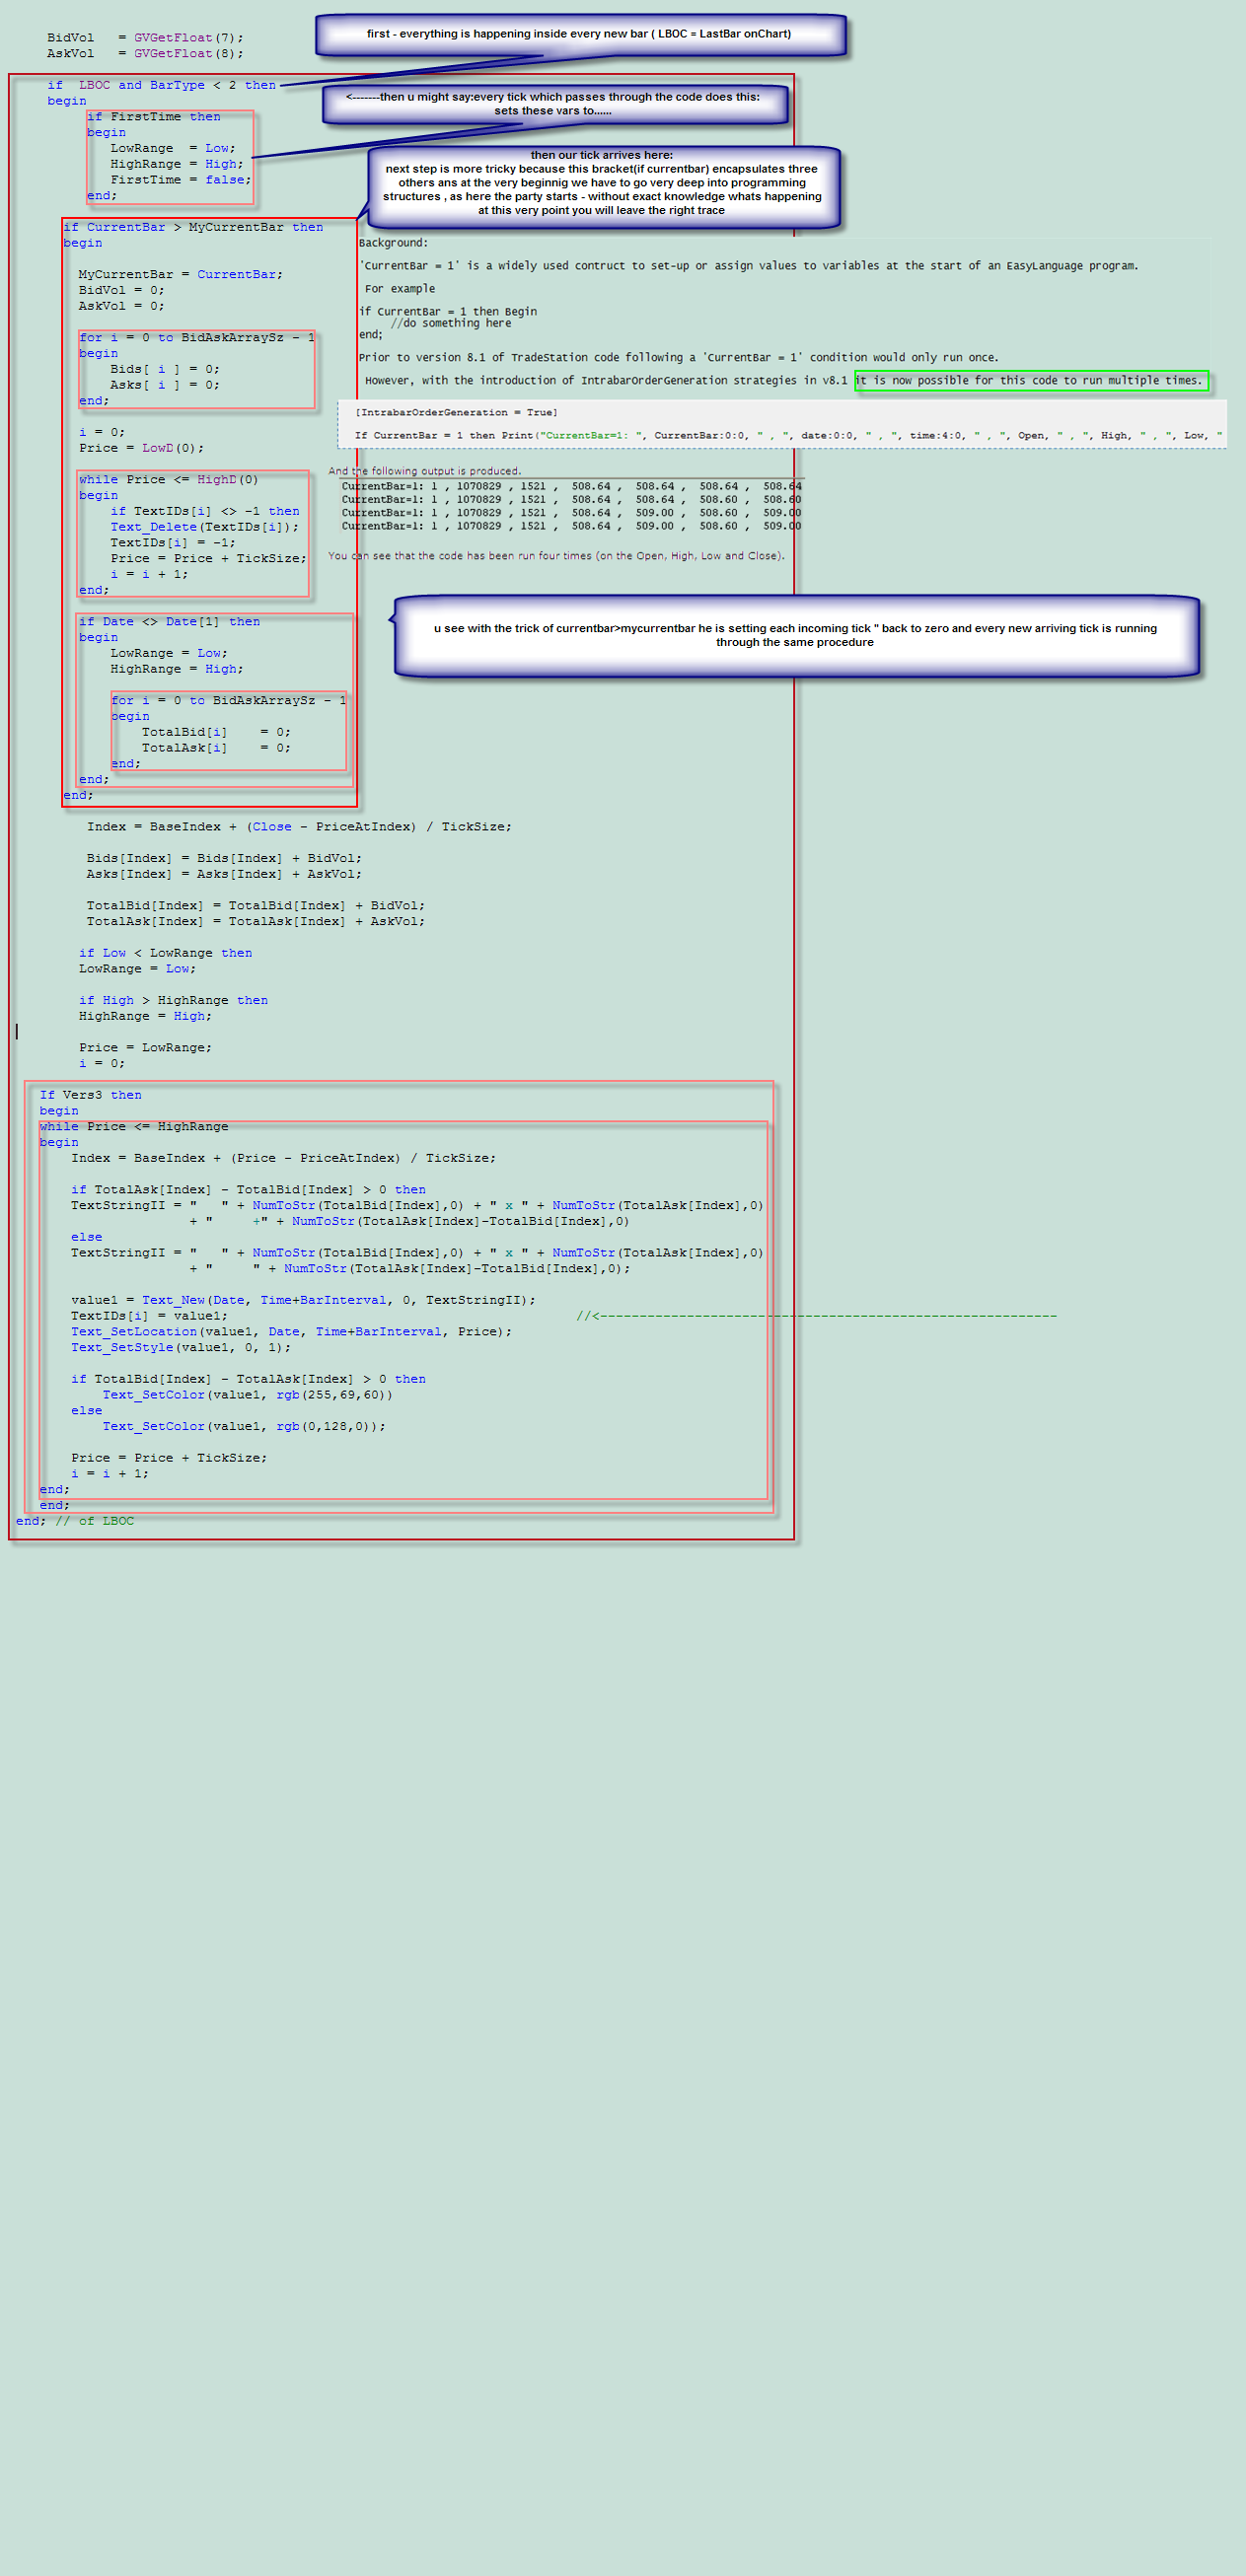
We have to go into deeper programming structures to fully understand this code - one step more on a learning curve
-
thanx
but these ones do not work very well on tickcharts - due to the minute -resolution.
-
zdo you are right - just a template: idea was (for instance) to write the close at the right side (just for demonstration purposes).
By the way this eld works as a realtime volume per price distribution , if you let run the whole day.
regs
Jojo
-
Hi
There are many tricks out there concerning plotting text-info on a chart.Like always in EasyLanguage there are several possibilities (or better call it tricks) to achieve that - due to the poor limitations of the language.I think lots of you spended more time on finding solutions for a specific problem you never thought of it would increase to never ending..............
ok ,just joking
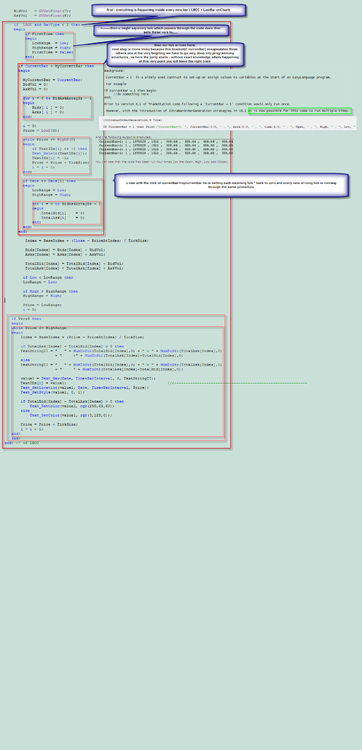
one of the finest solutions for this text - keeping is inside of Ant's genious MD.
Unfortunately he retired very soon - so no further assistance.Maybe someone could help to bring light into this coding structures, so one can use this concept for own analysis.
What I did here is to strip the code down to the column at the right side of the chart to remove everything unnessecary .
As I said before it's just for needs of understanding how this code works and how to reproduce this as "text-on-right-side-module".
I'm no learned programmer so I could not get through enough.
Idea might be to code something as exercise to the right side - maybe just the close of each tick or something similar.
It's just an idea how to start with this - every idea welcome
Regs Jojo:crap:
v2.thumb.png.1b5d179c8afca28cb47dc7601972458b.png)
v2pic.thumb.png.5ae9c0056392bec13c5ddcd1d1c8ec8b.png)


v2.png.4938a735f9b5b516de890d3cafced251.png)
v2pic.png.e40bce9065b8d30f088ca6a611a60f2b.png)
Pace of Tape - Measure Trade Intensity to Detect Reversals
in Trading Indicators
Posted
Here's a similar approach for TS, I found a time ago.Maybe it can help.Measuring the "speed" of contracts is very interesting , but as we know TS is frome last century , unfortunately.
Here you go :
[LegacyColorValue = true];
DefineDLLFunc: "GetMachineTime.DLL",Long,"GetMachineTime";
Inputs: OutputType(1), {Input 1 for Minutes and fractions of minutes ( 1.50 stands for 1 minute 30 seconds )}
{Input 2 for output in minutes and seconds ( 1.50 stands for 1 minute 50 seconds)}
CapMinutes(20),
RealTimePlotClr(white), {Color of histogram plot from the time it was applied and calculating in seconds in real time )}
NonRTPlotClr(Darkgray), {Color of histogram plot before the time it was applied not calculating seconds in real time but rounded minutes )}
OverCapClr(darkred);
Vars: TxtID (0);
Array: myTimes[2](0);
If LastBarO
[/code]nChart then
begin
myTimes[1] = myTimes[0];
myTimes[0] = GetMachineTime;
Value1 = myTimes[0] * .01;
Value2 = IntPortion(Value1);
Value3 = Value1 - Value2;
Value4 = myTimes[1] * .01;
Value5 = IntPortion(Value4);
Value6 = Value4 - Value5;
Value7 = (Value3 - Value6) * 100;
If myTimes[1] = 0 and myTimes[0] <> 0 then
Value8 = TimeToMinutes(time) - TimeToMinutes(time)[1];
If myTimes[1] <> 0 and myTimes[0] <> 0 then
begin
If myTimes[1] > myTimes[0] then
Value8 = TimeToMinutes(Value2) - TimeToMinutes(Value5) + 1440
else
Value8 = TimeToMinutes(Value2) - TimeToMinutes(Value5);
end;
If OutputType = 1 then
Value9 = ((Value8 * 60) + Value7) / 60
else
Value9 = 0;
{
Print("TradeStation reserved word CurrentTime XYZ",CurrentTime:4:0,
NewLine,"Current Machine Time XYZ",Spaces(17),GetMachineTime:7:0," ",
(TimeToMinutes(Value2) - TimeToMinutes(Value5) + 1440));
Print(Value1," ", Value2," ", Value3," ", Value4," ", Value5," ", Value6," ", Value7," ", Value8," ", Value9);
Print(myTimes[0]," ", mytimes[1]);
}
end else
begin
If Time[1] <= 2359 and Time >= 0 and Time < Time[1] then
value9 = TimeToMinutes(Time) - TimeToMinutes(Time)[1] + 1440
else
value9 = TimeToMinutes(Time) - TimeToMinutes(Time)[1];
end;
If Ticks <> 0 then
Value10 = Value9 / Ticks;
If Value9 > CapMinutes then
Value9 = CapMinutes;
Plot1(Value10, "Vol/sec");
If myTimes[1] = 0 then
SetPlotColor(1, NonRTPlotClr)
else
SetPlotColor(1, RealTimePlotClr);
If Value9 = CapMinutes then
SetPlotColor(1, OverCapClr);
regs
_GetMachineTime.zip