
Welcome to the new Traders Laboratory! Please bear with us as we finish the migration over the next few days. If you find any issues, want to leave feedback, get in touch with us, or offer suggestions please post to the Support forum here.


moneymarkets
-
Content Count
25 -
Joined
-
Last visited
Posts posted by moneymarkets
-
-
I am having problems finding new highs or lows when the macd crosses under 0 line.
It seems to plot with cross above zero line. I am trying to reset the time with cross overs of zeroline. With cross over it needs to reset the time and from there start finding new higher highs and lows etc.
Any help would be much appreciated.
Thanks
{Start of code_____EasyLanguage__________________________________}
var: HH(0), LL(0),TimeOK(false),start(0),var10(0);
{"Macd Added"____Need to reset time or Start as macd crosses over 0 line-from Data2--Then Reset highs and lows and start looking from there for new Highs Lows from new start time____________________}
inputs: FastLength( 12 ), SlowLength( 26 ), MACDLength( 9 ) ;
variables: var0( 0 ), var1( 0 ), var2( 0 ) ;
var0 = MACD ( Close , FastLength , SlowLength ) ;
var1 = XAverage( var0, MACDLength ) ;
var2 = var0 - var1 ;
condition1 = var0 {data2 }crosses over 0 {data2} ;
if condition1 then begin
var10=time_s;
var10=time;
start=var10 ;
end;
condition2 = var0 crosses under 0 ;
if condition2 then begin
var10=time_s;
{start=time ;}
start=var10 ;
var10=time;
end;
{High Low find from Time reset }
TimeOK = time >= start ;
if TimeOK = false then begin
HH = high;
LL = low;
noplot(1) ;
noplot(2);
end else begin
if high > HH Then begin
HH = high;
plot1(HH,"HH",red );
end;
if Low < LL then begin
LL = low;
plot2(LL,"LL",cyan );
end;
end;
-
Thanks for your usual quick response. I may not understand but I think the Keltner channel is based on average true range . I need the average daily range for say 14 days, and at beginning of new day or session plot lines with average low and high of those 14 days.
Thanks again.
-
Can anyone help with making an indicator that will plot on the price chart , the average daily range for a session?
I use Multicharts . Easylanguage is ok.
Thanks
-
Thats what I thought, ticks may be impossible to get the price at x time. Guess have to use minute charts for it.
Thanks again.
-
Will that give you the close of that bar or price of time? I tried something similar and got different results with different time frames. I was trying to get something that would work on any tick, etc. I need the open price at say 6:00 a.m.
thanks for your quick response
if time =opentime then begin
openprice=open;
end;
With above I got different prices on different time frames?
-
If I want to at say 6:00 am , take the price at exactly that time or I may change the time to 1:00 P.M., how do you program that?
I want to assign that to a variable, that then will be used in code that I already know how to do, but am having problems assigning the exact price at a time.
Please Help, it would be appreciated.
-
You can only use Multicharts On one computer at time.
-
Thanks Tams, I like price action indicators. Much appreciated.

You post some good indicators. Thanks again.
-
Thanks for your information and post.
I get an error when trying to verify the below statement--needs more inputs???
alpha=div((aa*dd-b*cc),(aa*e-b*b));
-
Thanks for your input, would you mind posting what you have for easylanguage so far, to see if we can help?
thanks
-
Center of Gravity Bands are quite different from the Oscillator. I know easylanguage , but not exactly how to convert from Metatrader language.
It would be appreciated if someone could do it.
-
Thanks Tams, I had the oscillator, but would love to have the bands that go with it.
I have attached two pictures of it.
Thanks again.


-
Does anyone have Center of Gravity Bands coded in Tradestation or MultiCharts?
It would be much appreciated for your help.
Thanks
-
Please post the indicator or picture of it, not sure what CqG means? Is it Center of Gravity Bands?
-
Very Good, Thanks phim9hi3n:)
-
Tams, did you get a plot error in MC, trying to reference future data -1 error? I did, so just wondering if you knew how to solve the error. I tried adding more space on it, but still error?
Thanks
-
I don't completely undersand all you want to do, but Most Stops are formated to Points or showmes. Try doing that and see if it will get you the effect you want.
-
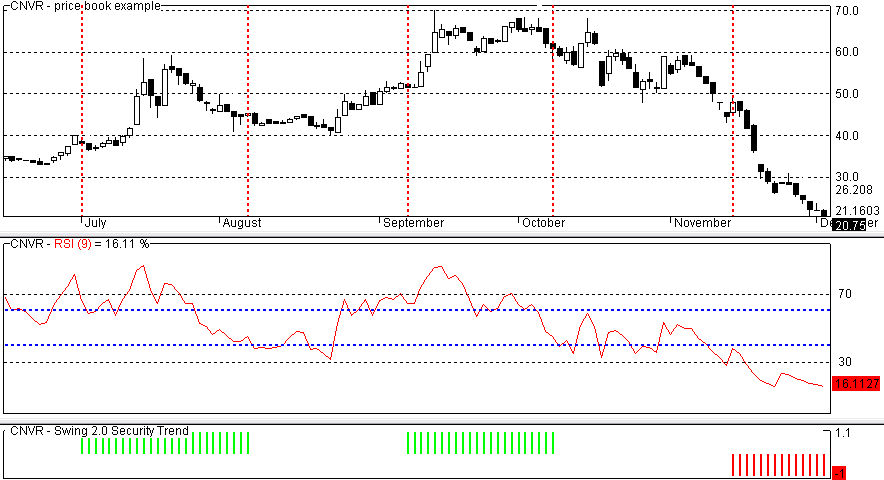
Does anyone know how to convert this amibroker formula to TS or MC?
Amibroker formula
Aup=40;//40
Adown=60;//60
up=BarsSince(RSI(9)>70);
down=BarsSince(RSI(9)<30);
Graph0=IIf(up<down,1,-1);
Graph0Style=2;
Graph0BarColor=IIf( up<down AND LLV(RSI(9),up)>Aup ,5,IIf(down<up AND HHV(RSI(9),down)<Adown,4,0));
Graph1=1.1;
Graph1Color=0;
Graph2=-1.1;
Graph2Color=0;
-
I must be missing something , and I appreciate you posting code, but I am lost on how to do this. When I open the text it has something that looks like programming. I tried renaming from text to pla and did not work.
Could you just post the compiled pla?
-
Multicharts indicator would be great, I also have Multicharts. Thanks for your Reply.
-
Would someone please post the completed eld. Also if possilble a chart of how used.
Thanks:)
-
btrader2 ,Did you get the code of the br_squeeze to plot in MC 3.0, if so would you post the PLEditor.Document for it?
Thanks
-
Thanks Blu-Ray for your Excellent Programming. I am also having problems with this in Multicharts. I also copied the above code, and get no plot. If anyone can get this to plot in Multicharts, please share it.
-
Thanks for those good charts. Would you mind telling us what the settings for the Keltner Band and is normal CCI Settings also?
thanks
Billionaire Indicator Live Calls
in Trading Indicators
Posted
Where do you get this?