
Welcome to the new Traders Laboratory! Please bear with us as we finish the migration over the next few days. If you find any issues, want to leave feedback, get in touch with us, or offer suggestions please post to the Support forum here.

jperl
-
Content Count
363 -
Joined
-
Last visited
-
Days Won
1
Posts posted by jperl
-
-
Do you ever use the average of the past few trading sessions for the opening play? Or do you only take the previous session data?
I usually use only the last trading session for a position trade. Once I decide on a trade entry, I will then take a look at the VWAP and SD's from previous 2 days, 1 week, 1 month, 2 months and 1 yr data to see if there is anything that would block the progress of the trade. I haven't gotten around to preparing a thread on this for want of time. Probably do so when I get back from my China trip.
-
I have another question regarding the SD. How narrow is narrow? It appears that Jerry would take trades with risk:reward ratios of slightly below 1.0. I personally do not take these type of trades even if Im scalping. If scalping the minimum I aim for is a 1:1.5 risk reward ratio. I understand that these risk:reward thinking is not entirely correct as it is geared for newer traders. However, I just never found myself worth taking a trade with so little reward opportunities.To restate this question, how large does the SD have to be before you enter a trade?
If you are only using today's distribution, then at the open, the SD is virtually zero. As more price/volume data is added, the SD grows. What's nice about watching this is you can see how the volatility is changing as the day continues. First growing, possibly leveling off, then growing again, then reaching some kind of stasis.
So when should you first consider taking a trade? My rule of thumb is, don't trade until the range of the bars on your chart are less than 1 standard deviation. If the high of a bar touches 1 SD level and the low of the bar touches a second SD level, then the bar range is too large to consider entering a trade on that time frame. You either need to wait until the bar range gets smaller, or go to a faster time frame.
-
Thanks Blowfish,However, I am trying to figure out a way to play the open. For example, if price is below the previous day VWAP and PVP go short, etc.... Im curious to here any comments on such strategy. Perhaps add a few filters like candle patterns, etc...
Both Blowfish and Dogpile have correctly stated when to use today's distribution and when to use yesterdays.
Since today's distribution has not developed yet at the open, use yesterdays distribution and simply add on to it as the morning price/volume data develops. I do this for position trades as described in [thread=2423]part X[/thread]. You can then switch to today's distribution at your convenience.
-
the one set-up that is very useful is that when PVP = VWAP in the middle of the day, think of it state of near-perfect 'balance'.
This unfortunately is a misleading statement.
Near perfect balance would be price = PVP = VWAP.
Very often when PVP=VWAP, price action can be far from the PVP, even as far as the 3rd Standard Deviation. That's not a balanced market.
-
Thank you Jerry. Regarding the skew, a long position would be the option in a negative skew and a short for a positive skew? I think I may have these two definitions mixed up as I had though a negative skew with price action below VWAP would be a short and vice versa.Your initial thought was correct
The sign of the skew tells you where most of the trading has taken place. Positive skew: Most of the trading has taken place above the VWAP
Negative skew: Most of the trading has taken place below the VWAP.
Your first order of business when looking at a volume distribution is to determine the sign of the skew. Once you have done that, see where the price action is.
a) If price action is above the VWAP and skew >0, look for long trades only.
b) If price action is below the VWAP and skew <0, look for short trades only.
These are the best trades to look for and Newbies should only do these to begin with. When you take these kinds of trades, you will be trading in the high volume zone of the distribution.
It's when price action is BELOW the VWAP and skew > 0 or
price action is ABOVE the VWAP and skew < 0
that things get interesting and exciting. Then your looking for breakouts into the low volume region with range extension. "Exciting" means "Living on the edge". If you like the rush of living on the edge, then look for trades in the low volume zone. These types of trades are described beginning in [thread=2232]Part VII[/thread]
-
First I wanted to say thank you for the great series of threads. I recently had a chance to go over them and has been quite enlightening.Your very welcome. I thank you for providing a forum where we can post videos. Without that, I would not have begun these threads
First, regarding the VWAP, PVP, and SD do you use the previous day value for these? For example, at the open what values do you use and when do you adjust the values for todays trading in real time?The thread on position trading [thread=2423]Part X[/thread] describes how I use the previous days volume distribution to take a position trade near the open. Today's developing volume distribution is simply added onto yesterdays. Once the position trade is completed, I then switch to using todays volume distribution for further day trades.
Second, you mentioned to stay away from trading around the PVP as market indecision takes place. I have been using the POC as a potential support/resistance the entire time and found this concept quite interesting. Could you care to elaborate on this?I pointed out in this thread that the PVP is a dividing point between a high volume trading zone and a low volume trading zone. Consider for example a distribution with a negative skew. Several things can happen around the PVP as follows:
a)Price can break out into the low volume zone above the 1st SD, in which case you want to go long or
b)Price can break back into the high volume zone below the VWAP in which case you want to go short or
c)Price action may simply oscillate between the 1st SD and the VWAP, in which case you might consider a short after a bounce off the 1st SD or a long after a bounce off the VWAP.
So at the PVP itself you have no idea of any expectation until one of the above 3 conditions occurs
Trading at the PVP thus becomes a slippery slope as I described in [thread=2232]Part VII [/thread].
Third, when the skew is negative but price is trading above the WVAP, do you not fade a retracement back to the VWAP to SD1? Or would you wait to fade the SD1 above the VWAP and a target back to the VWAP?Not quite sure what you meant in the first part of this question. With a negative skew (VWAP<< PVP) and price action above the VWAP, wait for a breakout to occur above the 1st SD for a long trade. If that does not occur (if for example price bounces off the SD) then go short with the VWAP as the profit target. As I indicated above you might get oscillations in this region between SD and the VWAP.
Once the breakout occurs say above the SD, you would only consider long trades away from the VWAP. example a retace to the SD, go long, or if price action is above the 2nd SD, again go long on a retrace to the 2nd SD. Such trades should be viable as long as the skew is negative. Eventually however the skew will become zero as the breakout continues. It's at that point you would take a countertrend trade TOWARD the VWAP. This is described in the thread on counter trend trading [thread=2285]Part VIII[/thread]
Fourth, do you play the range between SD2 and SD3?Above SD2, you are on your own. I usually don't take trades above SD2, mainly because continuation to SD3 is not that viable. And as I say that, you realize that in the last two months trades to the SD3 and beyond have become quite common.
Is any price movement extending beyond SD3 a fading opportunity? I have been using your concept to observe the Nikkei and have found price to break out of SD3 at times and never fall back.Beyond SD3 is no mans land. When I see the market extend beyond SD3, I just shake my head in amazement, take a break and go have a cup of coffee.
-
Hi Jerry,How did you determine the breakout would be to the upside when the 4 bars back hit the high around 13230ish. I would usually consider that a flush and would have a hard time playing that particular breakout trade. Also, what timeframe are you using in your videos? Thanks
Hi James,
Chart is a 2 minute chart of YM.
To answer your question, breakout trades are dangerous to take under any circumstances. As you indicated, you noticed four bars back, price action broke out above the 1st SD and then failed to continue. Second breakout could have failed also. Tough call. I usually don't take breakouts. But if I do, I will move my stop to breakeven quickly.
-
Position Trading is generally described as a trade which you enter and expect to hold for a considerable period of time during the day. Such a trade can be entered at any time after the open. My personal preference for a position trade is at the beginning of the trading day using market statistics from the previous day as my guide for determining entry, profit target, stoploss and scale in points if necessary. The direction of the trade is based on interpretation given in the last 9 "Trading with Market Statistics" threads but using the previous days statistics as the starting point. Position trading is thus no different than any other type of trading that I have previously described.
Here is the idea:
a)Set up a chart with yesterdays volume histogram, PVP, VWAP and SD's on it. Leave sufficient room to the right of yesterdays close so that at the open you can continue to add to the statistical data as todays market begins to unfold. In effect you are continuing to update yesterdays volume distribution as more data is added to the chart.
b)Before the open, decide on your trading plan. Pick a direction for the trade, an entry point, profit target and stoploss based on what you see in the volume distribution function. It will help to reread the previous threads to determine what you should be looking for.
c)When the market opens, execute the plan.
In the following video on trading the ER2 (Emini Russell 2000), you will see that the previous days volume distribution ended the day in a symmetric state with the VWAP = PVP. I then concluded that I should look for a countertrend trade back toward the VWAP as described in [thread=2285]"Trading with Market Statistics Part VIII"[/thread].
Watch the video to see what I did on September 06, 2007.
This trade was a good position trade which would have been even better if I had traded more than one contract. After having climbed up to the 2nd SD above the VWAP, the price action continued on down below the VWAP to the 1st SD and then evenutally to the 2nd SD, a very typical signature of a symmetric distribution.
-
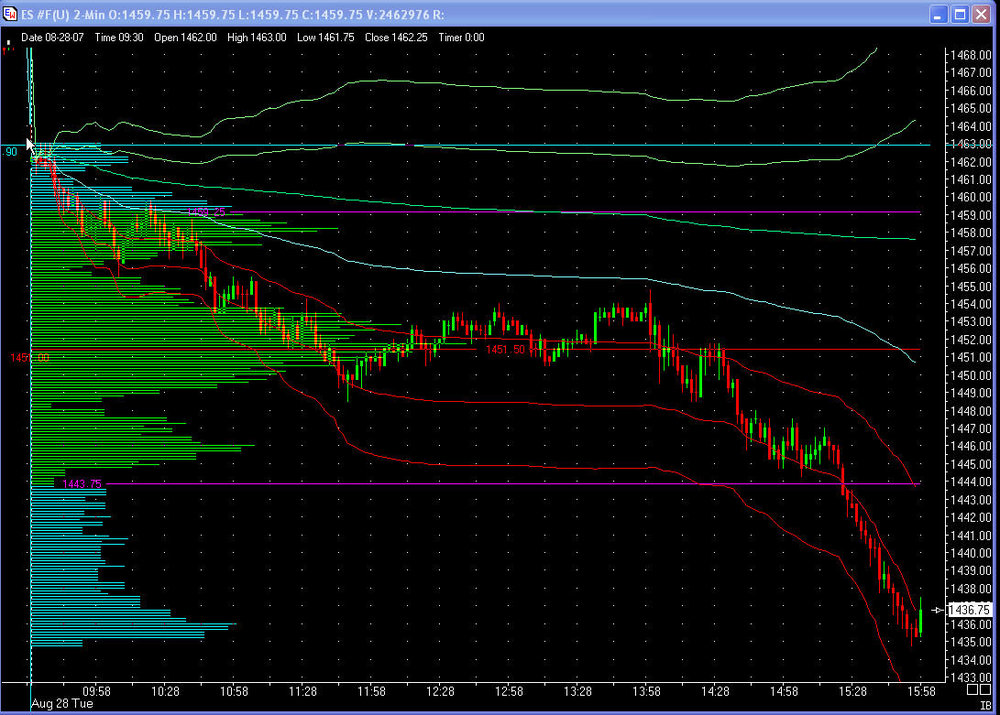
This is an excellent example of a 'price spike'... yes it could gap down and blow-up the next day -- but it is higher odds that this is a price spike and is just bad location to be short. Getting long takes some guts here and I didn't do it on this day -- but you can 'feel' the emotion involved by investors on this move.This actually was a good example of a developing symmetric volume distribution. Notice in the attached chart the fact that the VWAP touched the PVP at 15:50 eastern time (light blue line crossing red line) and then 4 bars later crossed back above the 2nd Standard Deviation, the perfect long entry for a return back to the VWAP.
If you were willing to hold on till the open the next day you could have bagged 7 ES points.
-
but I have a question about Shapiro,1) does the price bar have to make a "floater" above the SD band before the pb bar qualifies as a Shapiro bar? Or does 1 bar just have to close > the SD band and the next bar that reverses under the SD band is the Shapiro bar even without an earlier "floater" above the band?
Using Buy as example
2) what if there are successive bars that sit right on the SD band with Close < Open but the HIGHs keep getting LOWer. Do you use the last bar HIGH and keep moving the entry price LOWer or is the 1st bar that crossed the SD line used as the HIGH/entry price?
Thanks
Otto--the Shapiro Effect doesn't say anything about which bars to use. But here is what I do:
Long
The last down bar that touches the SD is your test bar. Doesn't matter where or how it touches.
Entry bar: The first up bar with any price higher than the high of the test bar, pull the trigger
The simplest situation would be 1 down bar touches SD. Next bar has a price higher than the high of that down bar.
More complex situations would be several down bars touching SD. Next up bar does not have a price higher than the last down bar high. But the one after that does. Pull the trigger on that second up bar.
It is also possible that your entry bar which looks like it is going to be an up bar and you pull the trigger long, eventually turns out to be another down bar. Tough luck.
-
I trade the ES but I'm not a scalper. I was wondering what kind of entry techniques scalpers use (tape reading, candlestick patterns,...)? Is profitable scalping possible with a risk/reward <1 ? Who has expierience with scalping (target 2-6 ticks) and wish to share his/her experience!
Check out the [thread=2322]"Trading with Market Statistics"[/thread] threads. There you will find a description of one scalping technique with a video of the technique.
-
Hi Jerry,I guess you are still considering how to present HUP's....gives you a well earned weekend off I guess! Still I missed my 'trading with market statistics' fix.
I don't know when I will get to discussing HUP in detail. Next week I will be away for most of the week, and the the week after I'm heading off to China for 3 weeks. So you won't hear from me for quite a while.
I know BO trades should be from the bands wrapping round the PvP. Counter trends when PvP & VWAP are 'close'. There are situations where both look like valid possibilities? actually I was hoping maybe a few more examples might help if HUP's are a way off. (scalp charts are perhaps good for this as things happen 'quickly'). Forgive me being presumptuous.The break out trades occur when price action is near the PVP Nick. If you have the situation where the PVP is also near the VWAP at the same time, you do nothing. Just sit and watch.
Also it seems to me that there is case to be made for a trade you have not mentioned (yet at least). This is a counter trend trade when price is a 'long long way' from the VWAP (and possibly the PvP). For example if price is outside the 3SD and moves back in.Yes, that is correct. In fact Cooter mentioned this one early on. I usually don't do anything when the market reaches the third standard deviation. It's a tough call.
-
There are some interesting statistics being presented here that the probability of the high/low occuring in the first hour of trading is very high. The first hour of trading represents about 15% of the trading day. So the expectation is that the high or the low will occur in the first 15% of the trading day.
Here is something then to think about. If you think markets have a fractal behavior, then the time span for the high or low to occur should scale on different time frames.
Example:
Suppose my trading day is only 10 minutes!! If the 15% figure for the high and low is correct, then I should expect that within my 10 minute trading day, the high or the low should occur within the first 90 seconds of my trading day.
This should be correct for any time frame that you trade in. If you trade 30 minute bars, then the high or low for that bar should occur within the first 4.5 minutes of that bar's open.
Check it out.
-
Yes and I think we can take this a little further than just the open. It seems that one can use the shorter term chart to trade those "in between" times when the skew is does not show direction (skew = 0). Or when a sudden shift of the skew occurs, looking at the shorter term chart (for me it is either a 1 minute chart or 200ticks) lets you re-orient yourself and prepare for a possible reversal. We had a good example just now on the ES contract where the skew shifted, I changed over to the 1 minute chart and took the long entry around 1448 looking for a scalp profit at the 1 SD (about 1449). In fact the move continued on up to 1452 (a previous "HUP").Previous "HUP" areas seem to act like magnets or pivots and in this case price has stopped there at least momentarilly.
Good show Steve. Keep up the good trading.
-
I took a stab at fixing the program bugs that stopped my tick chart from displaying correctly, and during the evening I replayed intraday charts using both tick charts and chart with 5 min candles. What I observe is that one can use the tick charts to trade the pre-open and open (first 30 to 45 minutes), watching the market develop and taking a few quick scalps. You can then "switch over" to the longer term chart (2-5 minute candles in my case) and not feel as though you "missed" the open..Just a thought.Yes Steve, that's one way to trade the open. I usually use a 15 second chart on the open and watch to see if there is a NEWBIE entry for a quicky.
-
Jerry, what is the name of your DOM software again?I missed it twice now when you said it, that looks really nice.The Interactive Brokers front end is from http://www.zerolinetrader.com.
Use a player like Nick suggested for easier replay of the videos.
Also, do you do anything as far as keeping this information on a yearly chart for stocks if you wanted to buy a stock for a roth or what not? Do the same concepts apply if your looking at daily data?Yes, it should be useful for stock daily data. I look at a 1 year chart with the PVP and VWAP on it for the various futures I trade.
-
is it fair to say that PVP is really a proxy for peak volume area? I mean, if you have a cluster of huge volume in one area -- but the PVP happens to be slightly higher in another area, it would seem to me that the cluster of huge volume is more important than the particular PVP... is that right?Well, if your intent is to integrate over a small price region, where the integration is consistently done for the whole distribution, then that is another interpretation for the distribution. But that's not how I look at it in terms of determining the types of trading zones. The PVP is whatever it is. It's possible for the PVP to oscillate back and forth between the two peaks, but to do that requires price action to oscillate.
-
Back in the newbie days when things where nice and simple the way I understood it was you would enter at the VWAP with a stop at the PVP? (or was it a couple of ticks the other side perhaps?).
Yes. Simple trade simple stop. Only 1 complication. Profit target was arbitrary.
You then introduced us to SD's With options of taking a trade there. At this time the stop would still be the PVP with the option of adding to your position at the VWAP. In fact a Whole section was devoted to risk tolerance. Again if I understand this correctly we decide what the maximum amount is we are ever to risk (based on account size) and then use market statistics (VWAP,SD) to enter and the PVP for a stop?Correct. Still reasonably straight forward. I probably should have introduced the Shapiro Effect at this time to help eliminate bad entries.
All well and good to this point however when you introduced breakout trades and counter trend trades I think a couple of different styles of trade management where also introduced. With BO's you would move the stop to BE as soon as possible? As an aside because BO's break and go you would consider entering these aggresively without waiting for the Shapiro effect? Also the way I understand it you would only do this at a BO of the SD band. A BO through the VWAP would be managed normally?Yes this is essentially correct. Break outs are difficult to trade under any circumstances. It's still possible to use the Shapiro Effect if you get a retrace. If not, tough luck.
With countertrend trades (symmetric distribution) you offer a couple of choices for stops - add 1 at the SD2 for a return to SD. -or- Stop and reverse if your trade moves against you for a journey to SD2 (I guess you are switching from counter trend to BO) Does this sound correct? Things are certainly a bit more complex than when newbie started out!?Correct again. As you are seeing, the trade threads get more and more complicated and more difficult to manage. This does not mean you have to expose yourself to these more difficult trade setups, but you should be aware they exist.
One other thing you mentioned briefly (can't remember where) I seem to recall you mentioning those with low risk tolerance could put the stop behind the Shapiro bar? Maybe I dreamt that.I did say that, for those who feel queasy about risk tolerance trading.
I also recall you saying you where 'conservative'. I wonder how you reconcile that with wide action points (I hesitate to use the word stops) particularly those introduced for 'newbie'? Especially in light of the paragraph that follows :-Not sure what you mean by wide action points. If you are referring to days when the SD is very large, don't trade those days if the SD is near your risk tolerance. (We have had a bunch of those lately)
Another thing about the Shapiro effect - if the tigger bar (the bar that touches the band) is of a wide range, we can end up giving away a lot of potential profit and adding to our risk (as your stop must be further). For example for a short at the VWAP if the bar comes from halfway between the SD1 & VWAP we give up half the potential profit and our stop is correspondingly further away while we wait for the low of this bar to be broken. Do you pass those trades or maybe not use Shapiro, or maybe drop down a timeframe for a more precise entry?The Shapiro effect is a two edged sword. You don't get something for nothing here. If you use it, as you point out, you will decrease your profit potential and increase your risk. And yes, you can drop down a time frame to find a better entry point.
Sounds like you've got the statistics down pat, NICK. Now all you have to do is trade it and see how it works out for you.
-
In your code line 3 does not sum total volume it sums volume up to bar N. Whenever a new bar comes in (with added volume) every single preceding bar needs re-calculating with the new total volume for the series. You need to do something like
for n = 1 to totalnumber of bars VolumeTotal= VolumTotal + Volume(n)
then you run the weighting.
for n = 1 to totalnumber of bars VWAP = close * Volume(n) /VolumeTotal
Basically you need to use the volume for the whole series (not just up to bar N) for the weighting. The same issue as with the SD.
If you are calculating the variance with total volume for the whole series should you not do the same for the VWAP itself?
Yes, that is correct Nick. Every time you add a new bar, with new volume, you have to renormalize the VWAP computation to include this new volume. What that means is computing the VWAP terms beginning at the start time each time you add a new bar.
-
Slow creep upward price action is difficult to trade under any circumstances.Jerry can u please explain why this is the case with respect to trading with market statistics.
What makes it difficult to trade even with market statistics, is that the slow creep usually hugs one of the standard deviation lines rather than rotating between the SD's. As a result while you may have an entry point, you don't have an exit target that get's touched before you get stopped out.
-
I watched the movie ... where do you place your stops on that kind of scalps ?I don't maildigger. If I have to reverse the trade, I'll do that instead and increase position size
-
Just a quick tangential question - Have you ever researched 'rolling' distributions for scalping? (I plan to try this at some stage).By rolling I mean using a fixed N period for your indicators. So for example you could use just the last hours data. When a new 2 min bar paints you drop the oldest bar and factor in the newest.
Cheers,
Yes, in fact I did try that, but discovered that it didn't add anything to understanding the price action.
-
1.) Why not look to a longer time frame when trying to determine how long a distribution will remain symetric. I am thinking that following the skew on a daily and/or weekly basis might add value to the process.2.) I have started to look for, and catalog "HUP's". Based on Jerry's characterization of them as places where price is held up while the market decides direction, I am keeping a list not only of the price but of the time (time and duration) to see if there is some utility to be had from that.
Good points Steve. These two issues are related. I was going to do a thread on HUP but discovered that the presentation was too complicated. I'm still searching for a simple way to start it.
-
1. You said about VWAP that it being a average the volume traded above & below should be identical, i take the word identical as equal here.
So my question is , Is there a mathematical proof which says that for ANY distribution
P[X>=E(X)] = P[X<=E(X)]
i am thinking of VWAp as the expected value.
There is no proof Naveen, because my statement about equality is only partially true. It's true for the median value by definition. You can see why it is true for a normal distribution and other well known distributions when the mean equals the median. For all other non analytic distributions what you can say and prove is that the
mean-median< 1 standard deviation
The proof is here
can this method be applied to stocks too.Short answer is yes. I qualify it with the statement, that there needs to be sufficient data to be statistically meaningful. So very low volume stocks would not work.

Trading with Market Statistics X. Position Trading
in Market Profile
Posted
You are right on track Darth. There are two kinds of HUP, static and dynamic. The static ones are for example yesterdays high, low and close. The dynamic ones are all the VWAP and SD's from yesterday, 2 days ago, 1 week, 2 weeks, 1 month 2 month, 1 year ago. I think you can see that how these cluster will be important for determining price action. The rest of the story you will have to wait until I come back.