
Welcome to the new Traders Laboratory! Please bear with us as we finish the migration over the next few days. If you find any issues, want to leave feedback, get in touch with us, or offer suggestions please post to the Support forum here.

jperl
-
Content Count
363 -
Joined
-
Last visited
-
Days Won
1
Posts posted by jperl
-
-
Hi Jerryfirst ..thank you a lot for your nice job here
I would like to ask you please. I red almost all your threads but my english is not very good and I didnt get self- contained information about study that you use . I am new user of enSign (I downloaded trial version) but I cant see study SD,PVP,VWAP.... Please give me some information about it or I have to program it ???? Thank you very much.(sorry maybe offtopic)
Kuky,
If you have the latest ensign version (Nov 13 version), you will find the VWAP and SD as one of the studies. Just right click on your chart and choose studies. At the bottom of the list is the VWAP. To get the PVP, choose the price histogram study and set it to volume. The PVP will appear as a red line on the histogram
-
Jerry, in your global strategy, when you talk to dynamic HUB, can you quote the virgin POC (of steidlmayer) too ?Thanks.
Alex
If you are asking, do I include previous PVP's as dynamic HUP, the answer is yes. In fact, if I see price action approaching a PVP, I will just stand aside and not trade there. If I am already in a trade and price action approaches a PVP I will usually exit there. As far as the PVP's being virgin or not, I don't make a distinction between virgin or non virgin ones.
-
Hi, Jerry and the other traders.I trade the Bund with the market profile and want more understand.
Too, sorry for my bad english language, sorry.
Someone can write a summary of the main lines of your method for a French newbie trader (to this fantastic method), advanced trader to the MP of steidlmayer.
iA summary of all the posts of Jerry, will be the hightlight for me.
Best regards.
Alexandre.
Alexamder.
This may help you;
-
Hi Jerry,In previous threads you mentioned that HUPs play an important role in the momentum of the trade and also offsetting the entry point for a trade from SD. Now that we are in the HUP business can you please explain it in more details.
Thx,
Karish
Karish,
If you think of the HUP lines as pivot points, you will understand what I am referring to in the previous threads.
For example suppose you are thinking about entering a short trade at the 1st SD below the VWAP. As the price action approaches the 1st SD from below, you notice there is a HUP point just below the SD. What do you do? It would seem to me the only thing you should do is pull the short trigger at the HUP rather than wait to see if the SD is touched.
Similarly on trade exit. If you enter a long trade say at the VWAP with the intent of exiting at the 1st SD, but you notice there is a HUP line just below the SD, you should exit your trade at the HUP or at least remove some contracts at the HUP rather than wait to see if the SD will be touched.
These are just two examples that I use every day.
There is a rich variety of other things you can do at HUP lines, but I will leave it to you to discover these on your own.
-
Jerry - what time do you start your vwap from for intraday?Ensign currently starts from midnight, but that is not good for comparing to a market profile or pvp that starts at 9:30 est..
I start my VWAP computation for today at the 9:30 open. But even if you start it at the beginning of the overnight session, it usually won't make much difference. Remember, VWAP is volume weighted and there is not much volume overnight compared to the 9:30 open.
On the other hand i see some of your trading was already green by 9:30am meaning you must have done some trading during pre-market.Occaisionally, I will enter a trade premarket open using VWAP data from the previous day, but not too often.
-
I have a computer-related question if anyone can help?I
1. Buy a dual head PCI-compatible video card. A pretty cheap solution again but my concern is I hear is here can be a lot of compatibility problems.
Here is a site that discusses compatibility issues with a database of users who have tried various combinations of video cards. Use the database to see if the combination of cards you are interested in has been looked at before.
-
Jerry, MAE of 6.43 today on multiple contracts!!!!!You take my breath away....
But i guess if you got 'em use 'em.
Actually there are some big traders around who risk $50k per trade. I think they do it on more contracts but tighter stops probably.
It really comes down to your risk tolerance. Once you start trading using risk tolerance rather than stops, you don't have a problem scaling-in multiple contracts. On days like yesterday, it was quite profitable.
-
Would it not make more sense to convert the VWAP bands into an oscillator. Here is essentially what it would look like:http://www.charthub.com/images/2007/11/09/VWAP_Oscillator.png
This way, you have one histogram, instead of 5, 7, 9 lines overlaying your candles. The histogram tells you how many standard deviations price is above or below the VWAP. I'll add this oscillator option to our next release (I/RT 9.0).
That's fine for the forward candles, (the ones all the way to the right). However the oscillator gives the wrong impression about where price has been relative to the standard deviations in the past, due to the fact that the standard deviation lines are renormalizing with each added data point.
For example from 12:20 to 12:50, the lows of all the candles touched the 3rd standard deviation price which kept renormalizing to a lower price.
The oscillator on the other hand gives the impression that none of those candles touched the 3rd standard deviation until about 12:40
-
Howard Arrington just told me he is including SD as a built in study in ensign to be released today in the nov 8th beta.Looking forward to seeing this.
In his words.....
"VWAP with standard dev band based on price-VWAP is now a built in study in the 11-08 beta to be released later today.
Enjoy. You can do away with the DYO for VWAP now."
Glad to hear it. It was only a matter of time.
-
Thanks for this thread JPerl. I am unable to play the Flash presentation -- are others experiencing problems or is it my computer? Thanks for a reply.Ticks-
get yourself a copy of swfopener at this site:
http://www.browsertools.net/SWF-Opener/index.html
This should solve your problem
JERRY
-
Are you able to backfill data for the monthly/yearly vwap/pvp with IB/ensign?Yes, no problem
I found this on their sitehttp://ensign.editme.com/StdDev
Have they pretty much knocked off this stuff that I wouldn't have to program my own? I notice they mention this site in the response.
Interesting....didn't know they were working on it. You should see the post by mp_trader whose has been working on this too. I don't know if he has completed it though.
-
This is the Market Statistics thread that some of you advanced traders have been waiting for. This is the "how to trade anywhere, anytime" thread otherwise called the "when not to trade thread", but not for NEWBIES. If you are a NEWBIE, back off and read the first ten threads on this topic starting [thread=1962]here[/thread].
One of the properties of most markets is the up and down motion that price action displays on virtually all time frames. Some traders call this the market volatility, others call it the natural market rotation. Newbie traders don't like this motion, because when they enter a trade they want the market to continue moving in their direction. Newbies fear volatility. Advanced traders love it. What ever you wish to call it, it is this motion that is tradeable. In the words of Nihabaashi, "To fear volatility is to fear profits".
The main purpose of this thread will be to show how you can use market statistics to determine the most probable times when the market will rotate and when it will not. Once you know this, you can then enter a trade either in the same direction that the market is moving or take a contertrend trade in the opposite direction. If you have read the previous market statistics threads, you already know how to do this. Here I want to start to put this all together in terms of a generalized concept which I call HUP.
HUP stands for Hold Up Prices. As the name implies, HUP are those prices where the price action tends to hold up, that is where the market slows down, pauses, then either reverses (read rotates) or continues in the same direction.
There are two kinds of HUP, static and dynamic. Static HUP are those prices which are fixed for the day. They don't change with market development. In contrast dynamic HUP change as the day progresses. As new data is added, dynamic HUP will readjust to reflect the new data.
Below are some examples of HUP that can be used in daily trading
STATIC HUP
Yesterdays High,Low,Close
Overnight High,Low
Any computations based on these
such as classic pivot points
DYNAMIC HUP
Yesterdays PVP,VWAP and SD's
2 day PVP, VWAP and SD's
1 week(5day) PVP, VWAP and SD's
2 week PVP, VWAP and SD's
1 month(4 week) PVP, VWAP and SD's
2 month PVP, VWAP and SD's
1 year PVP, VWAP and SD's
You can of course come up with other examples of HUP, such as previous bars highs and lows, or 2 day or longer static HUP, or dynamic HUP that are in between the ones I have listed. It really doesn't matter. More important is to realize that these HUP points are prices where the market will tend to hold up.
What HUP doesn't tell you of course, is how long the market will hold up and/or how far it will continue in the same direction or if it reverses, how large the reversal will be. Getting the direction correct doesn't mean you can sit back and do nothing. You still have to manage the trade.
In the video that follows you will see a 15 second chart with HUP lines drawn on it..
Green lines are SD's above a VWAP. Red lines are SD's below a VWAP. VWAP are dotted blue. PVP are purple lines
Now watch this video to see where these HUP lines come from and how the market reacts to them.
-
haha, yea maybe we need a little methadone maintance hit before the big HUP fix.Jerry, any chance you could do a video on how you use the longer time frame stats? I think I remember you said you look at longer time frames stats even for intraday, maybe that ties in with hups though.
Well if you read the position trading thread, you saw I used the previous days volume distribution data to decide on a trade for today. That's an example of using a longer time frame for today's trades.
You will see that HUP is an extension of that
-
Hi Jerry, great thread I hope you will find soon the time to explain us your HUP concept.I wonder if and how we can implement Market statistics trading strategy to longer term trading style such as swing of several days?
Thx
Karish
I'm still working on a presentation for HUP. Hope to have the beginning of it sometime this week.
As far as swing trading goes, I don't do swing trading, but longer term stat analyis should be useful for swing trading as for day trading. The standard deviations will be considerably larger so you will have to have a larger risk factor to do swing trades.
-
I love this quote about trading. Don't know where I saw it, but I think there is some truth in it for newbies, no matter how big your account is.
"Want to get to $1 million in 12 months as a trader. It's easy. Just start with $2 million."
-
Note that "read the tape" is in parenthesis. Agree or not, the term is commonly used to describe virtually any method that interpets market sentiment through real-time volume/price interaction.Well I guess we will have to agree to disagree. But I would think that the old pros (and some new pros) who just use time and sales would laugh if you told them you were "reading the tape" by drawing a chart. Once you introduce a chart into the analysis, you are doing a form of technical analysis.
In my "Trading with Market Statistics" threads, I only show price and volume in the analysis, but I would hardly call this tape reading. There are others discussion in these forums that use price and volume only, such as volume spread analysis, wide range body analysis, candle shape analysis. I don't think I have seen any description of these as "tape reading".
If you want to say T&S is the "only" form of "tapereading" have at it. It is closest to what early traders had. But to say it is the only way to interpret the principles taught by Wyckoff, Scabacher, etc. is wrong.Schabacker (that's with an h and a k) as far as I can tell, never mentions the words tape reading in his books. In fact he is probably the father of modern technical analysis using charts.
-
I don't think any of those forementioned leaders of tapereading would be doing the same thing they did when all they had to watch was numbers rolling across the tape.I think you are wrong on that one. In fact I know quite a number of traders who trade using only time and sales, no charts.
Also do you think floor traders are looking at charts when they trade?
This doesn't change the fact that the book cover and title are misleading.Thus the object of the book is not to give a history lesson or teach one to use only technology available decades or centuries ago. Graifer's methods are consistent with his definition and with what he promises on the book cover.In fact if you look at the book cover, what do you see? You see a picture of a ticker tape machine with tape pouring out of it.
I was thus expecting that the book would be discussing how to read time and sales data in real time. There is in fact not a single discussion of time and sales.
-
I like this book a lot. I don't understand the comments about not being about tape reading at all.I think the confusion has to do with the definition of "tape reading". Tape reading refers to the historical method of reading a ticker tape that came out of a ticker tape machine. There were no charts back in the early days. If you use this as the definition of tape reading, then Graifer's title of his book is misleading.
In today's terms, tape reading would then mean looking at "Time and Sales" data and nothing else.
If you want to learn about historical tape reading then look at the early works such as
"Studies In Tape Reading" by Rollo Tape (Richard Wycoff)
"Tape Reading & Market Tactics" by Humphrey B. Neill
"Ticker Technique" by Orline D. Foster
and the all time classic:
"Reminiscences of a Stock Operator" by Edwin Lefevre
-
I think not many people used it since it required the user to install a program on their machine. The java-based chatroom that is on this site currently doesnt require any sort of downloads.Now I remember why James dropped tradingrooms. It's slower than molasses and will lock up your machine.
Don't know anything about gotomeeting.com, but it is not free.
-
I think some people tried to use http://www.tradingrooms.com/There you can post charts in real-time. It requires a download by the user and I think that put some people off. As far as I can tell it is free to set up a public chat room, but not entirely sure.
The only other programs I know of is hotcomm and omnovia, all which are not free, so this might be a viable solution.
Tradingrooms i believe may have been used by James here. Don't know why he stopped using it. Maybe he should have a second look
-
Jerry,There is this TL chat room - http://www.traderslaboratory.com/forums/misc.php?do=flashchat
I don't think it will support live, streaming charts, but there is a chat room right here on TL. Awhile back it had people in there daily but it died off for whatever reason. If there's enough interest, you guys could just use that for the time being.
Yes that's the problem with it brownsfan. You can't show realtime charts.
What I'd like to see is something like I've done in the videos in the "Trading with Market Statistics" threads but in real time. The closest thing I've seen to this is Woddies CCI club where the moderator posts his real time charts and initiates trades off of them. Very useful.
-
Hi Jerry, nice idea.... i also had being doing some thinking on the topic...are you referring to a trading room on live with our fellow traders or recording live sessions to be posted after on the site ?... cheers The Chimp.
The former Walter. Recording live in real time so that we can watch you trade and explain what you are doing. The only thing we can do now is post videos with voice over after the fact.
But I do notice that there is a live charts "room" where James is posting real time charts of the FOREX. So it seems like it should be possible to have a real time room where the user can post a real time chart too.
-
I notice there is a live charts thread with FOREX data being posted.
Here is an idea but don't know if it is possible. Allow users to demonstrate there trading technique with real time live charts (and audio).
We have a lot of talking about trading, but virutally no walking. Live demos would help us all understand what the talking is all about.
JERRY
-
jerry,was curious your thoughts on yesterdays volume distribution? it looked like a near perfect symmetrical distribution for much of the day then ended up building a fat lower tail. In situation like this, where you would expect to go long low in a symmetrical distribution (as it looked with an hour or two to go) -- but the distribution did not END UP symmetrical. curious your take?
thx
Sorry for the delay in getting back to you Dogpile. Just got back from China.
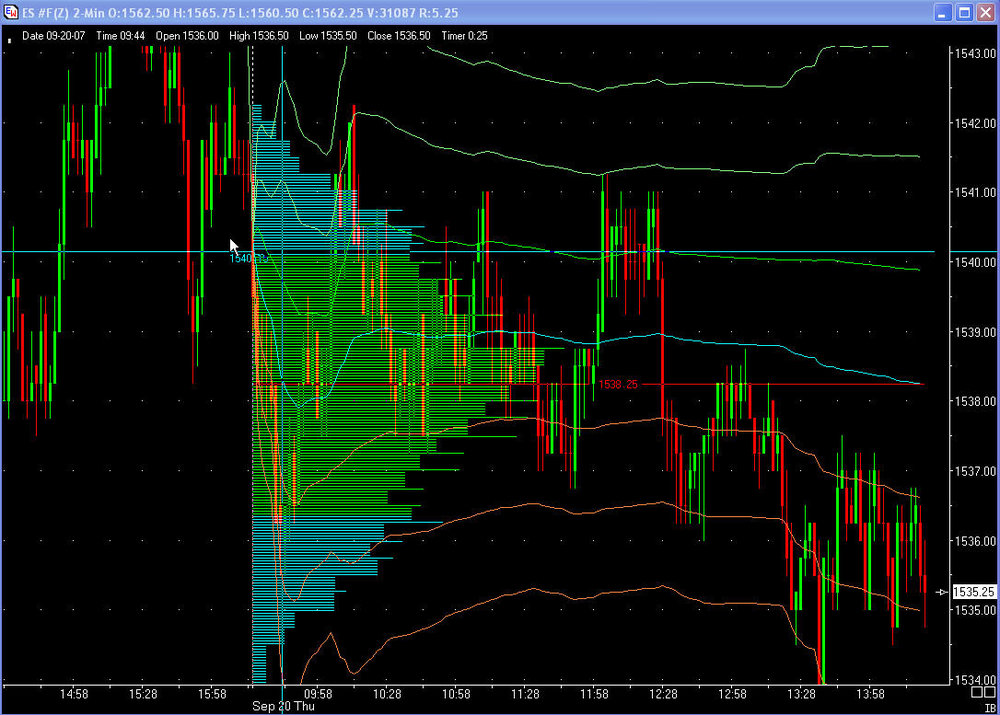
I took a look at the Sept 20 data for ES. Here is my take on it:
In the first chart you can see that the skew is positive until 14:20 PM. So I would have been biased for breakout trades to the upside. There were quite a number of these that would have been good trades to the 1st and 2nd SD. Breakout trades to the downside would have all failed until 12:28 PM when the market broke out to the downside.
It was only at 14:20 that the market became symmetric (PVP=VWAP at the last bar shown in the the first chart).
As a trader you then had to decide whether to take an upside move back to the VWAP. Here is where the Shapiro Effect comes in handy.
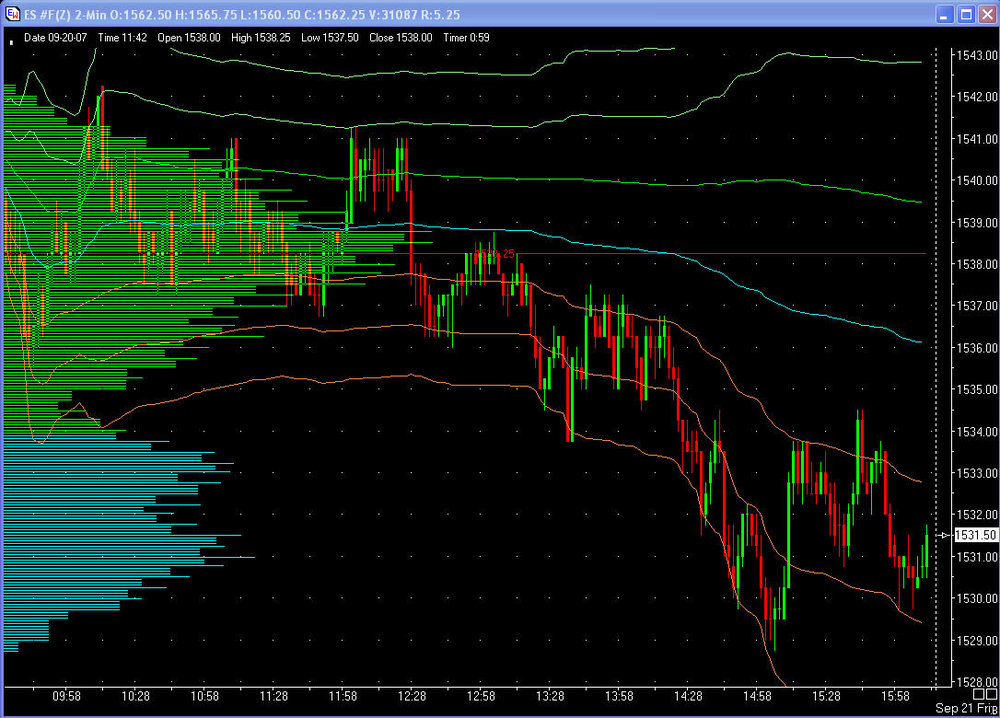
In the second chart which shows the whole day, there was no Shapiro effect to the upside after 14:20. In fact all the Shapiro effects occurred to the downside with good trade entries at 14:44, 14:58, 15:30 and 15:56. By 14:44 the skew went negative, so I would have only looked for short entries anyway.
Too bad I had already left for China. It would have been a great trading day.
JERRY


Trading with Market Statistics VII. Breakout Trades at the PVP
in Market Profile
Posted
When two humps form in the volume distribution, watch carefully. The peak in the second hump may become the new PVP. At that point in time, the character of the price action can change abruptly. If I am in a trade when that happens, I will usually exit.