
Welcome to the new Traders Laboratory! Please bear with us as we finish the migration over the next few days. If you find any issues, want to leave feedback, get in touch with us, or offer suggestions please post to the Support forum here.


johnnydaymon
-
Content Count
145 -
Joined
-
Last visited
-
Days Won
1
Posts posted by johnnydaymon
-
-
-
-
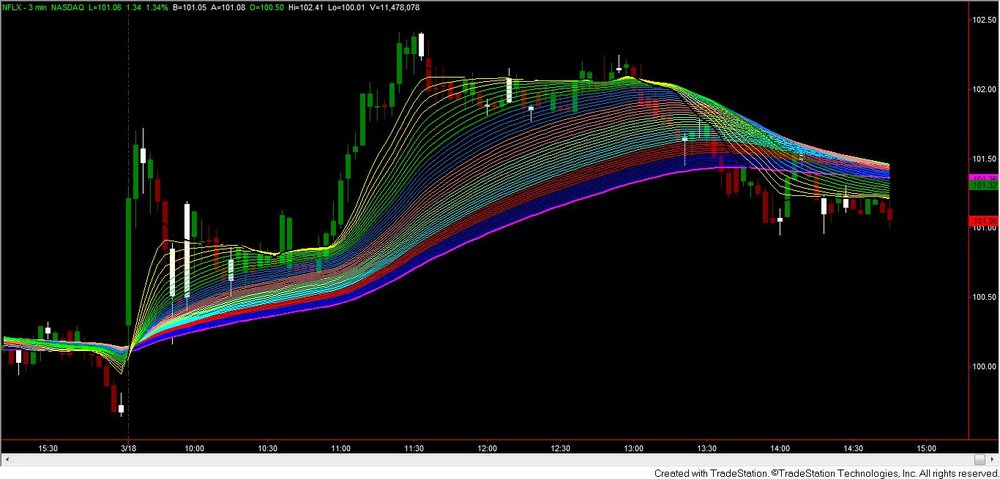
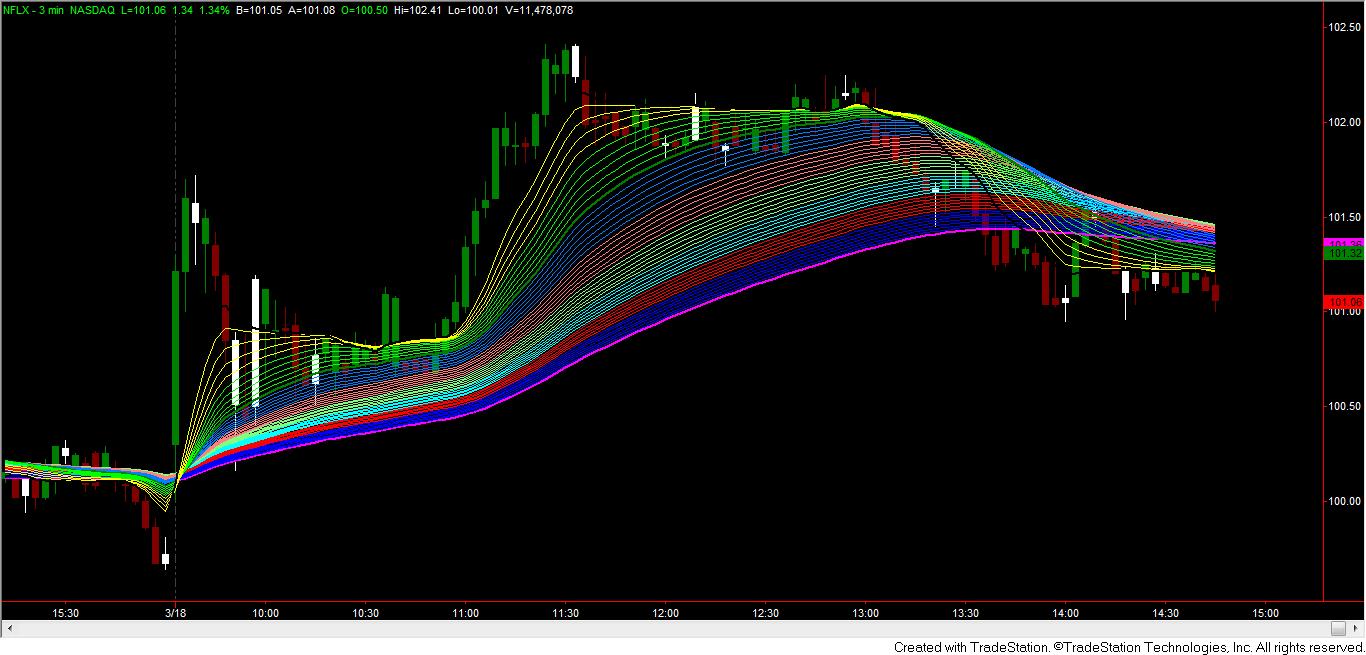
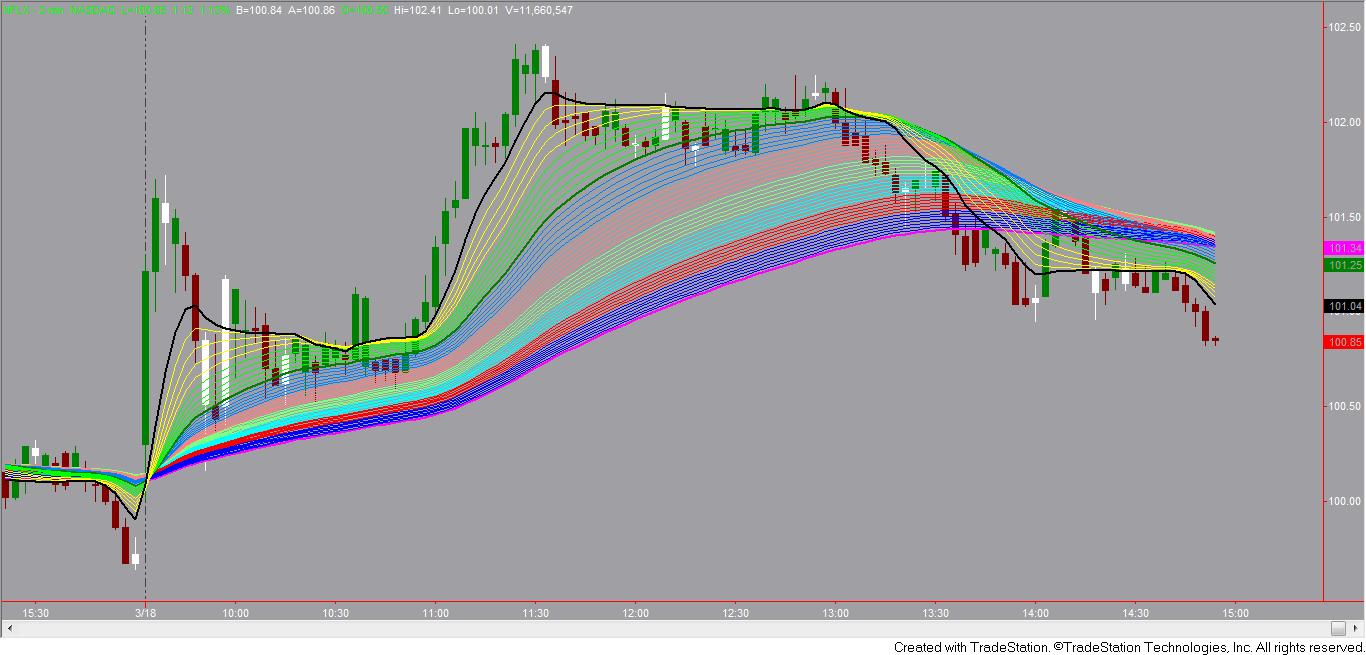
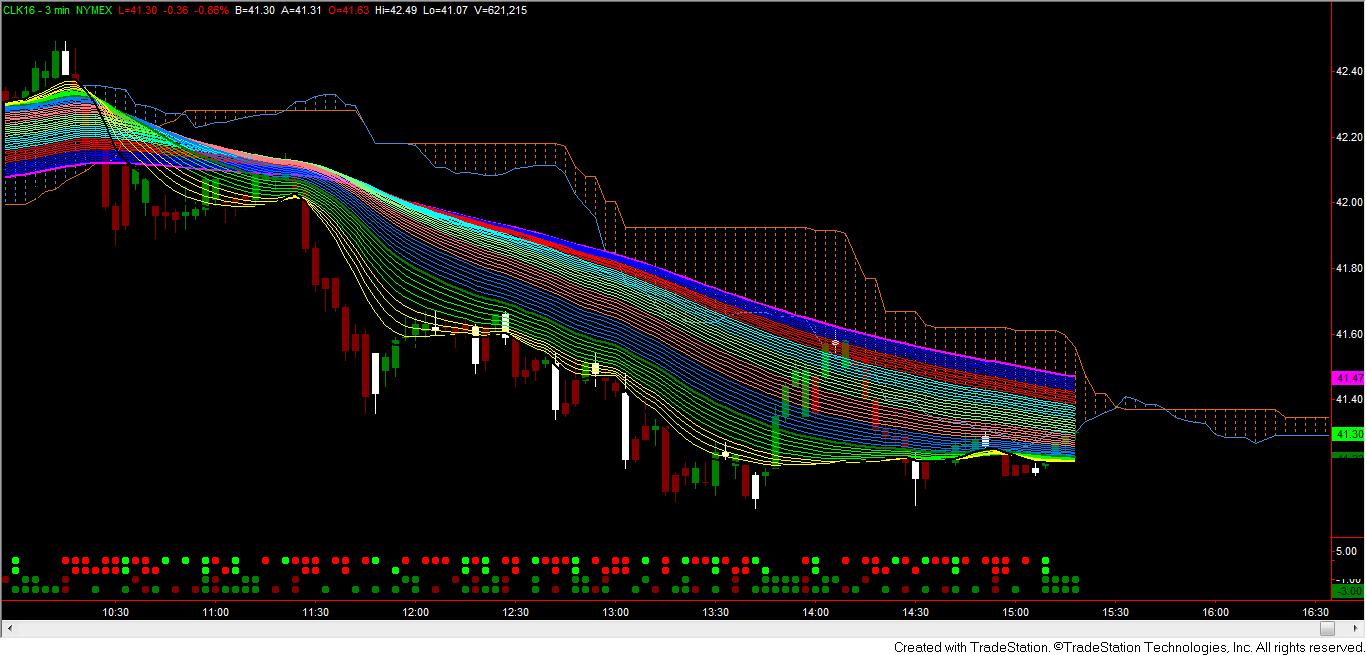
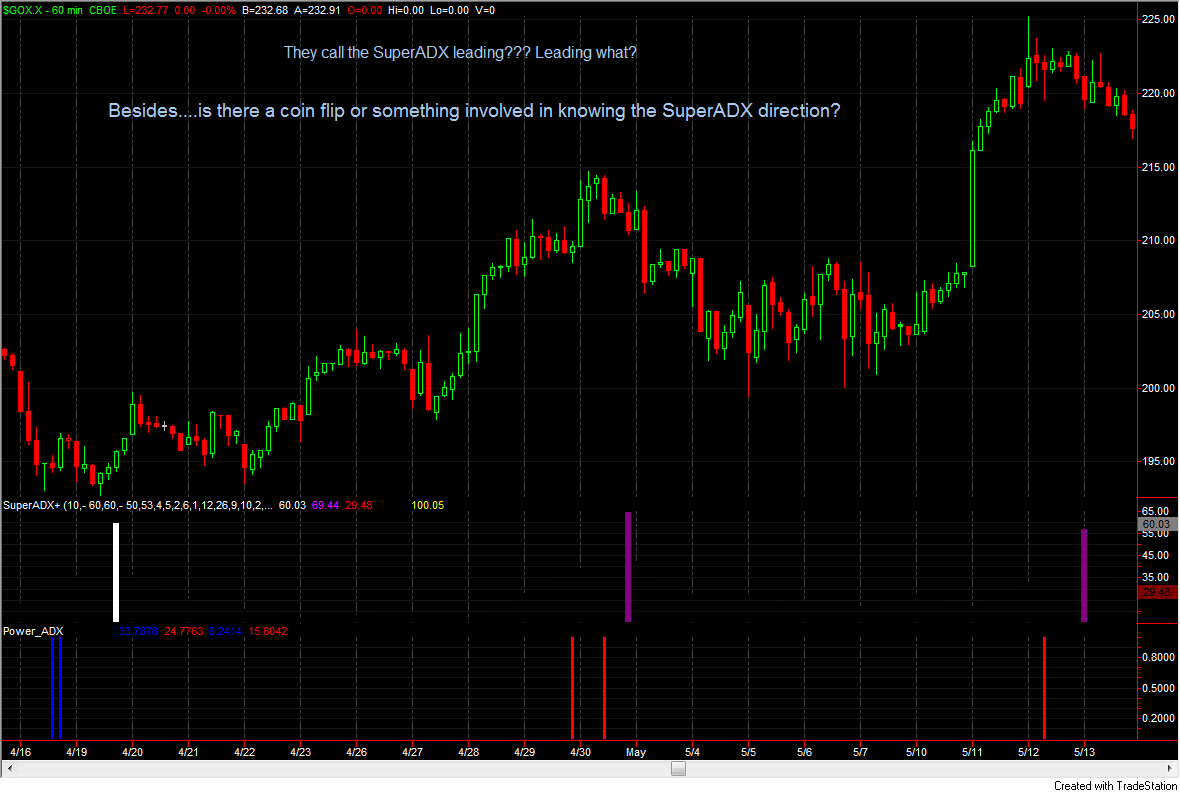
It's a junk indicator Derek ! Your better off using the vma rainbow.
-
Read J pearls vwap threads ( your homework ) Here is the first one !
-
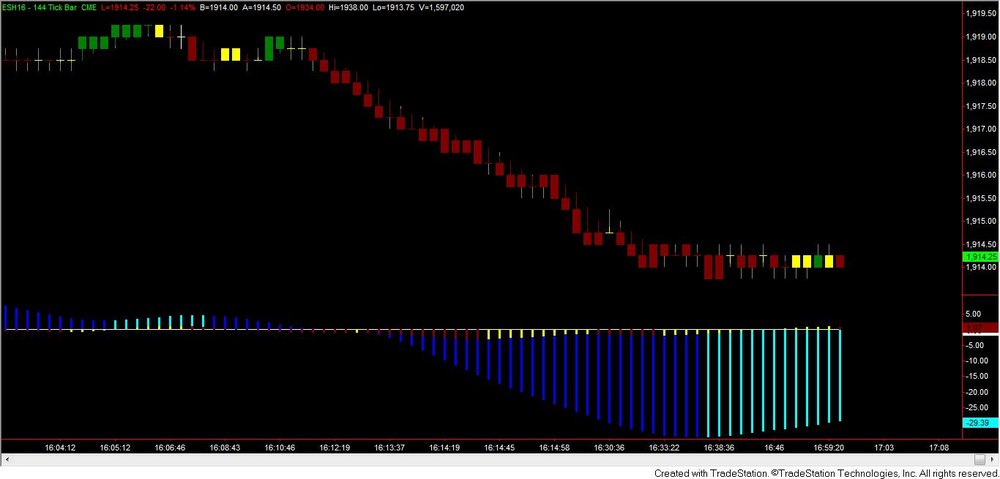
 Finding the ladders !,Fantail at work
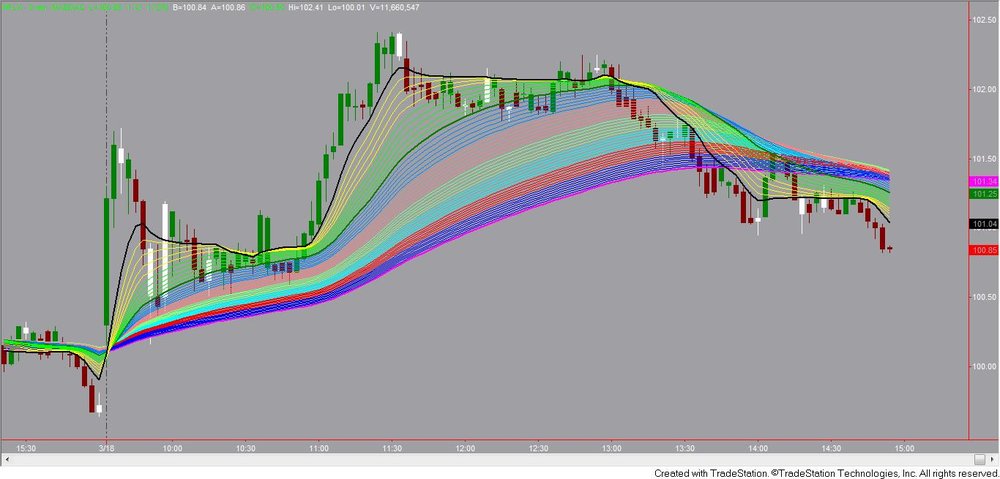
-
A picture paints a thousand words they say ! All indicators can be found on this site . One right here on this thread . Bid-Ask Tape Indicator
-
Seems like dude pasted the code above twice without the code box ! If you look closely it's the same code posted twice . Hamfon's eld of the original post
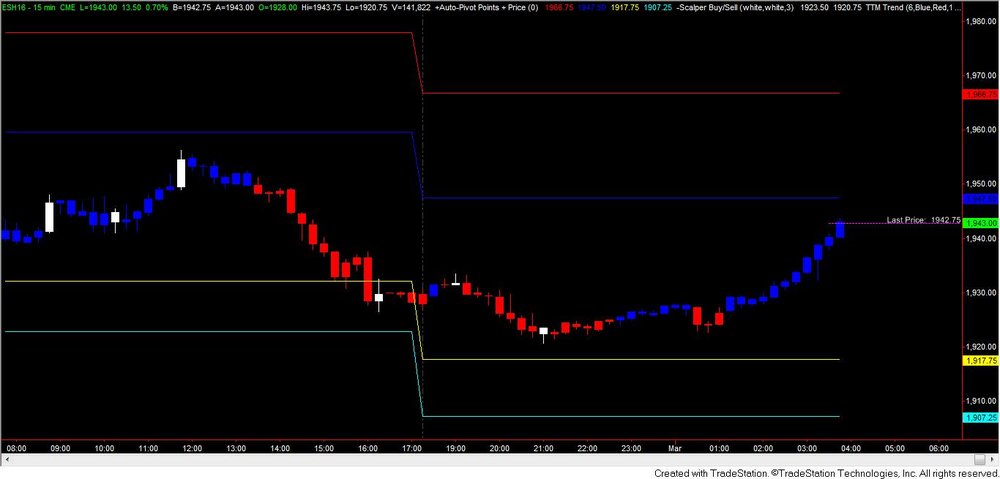
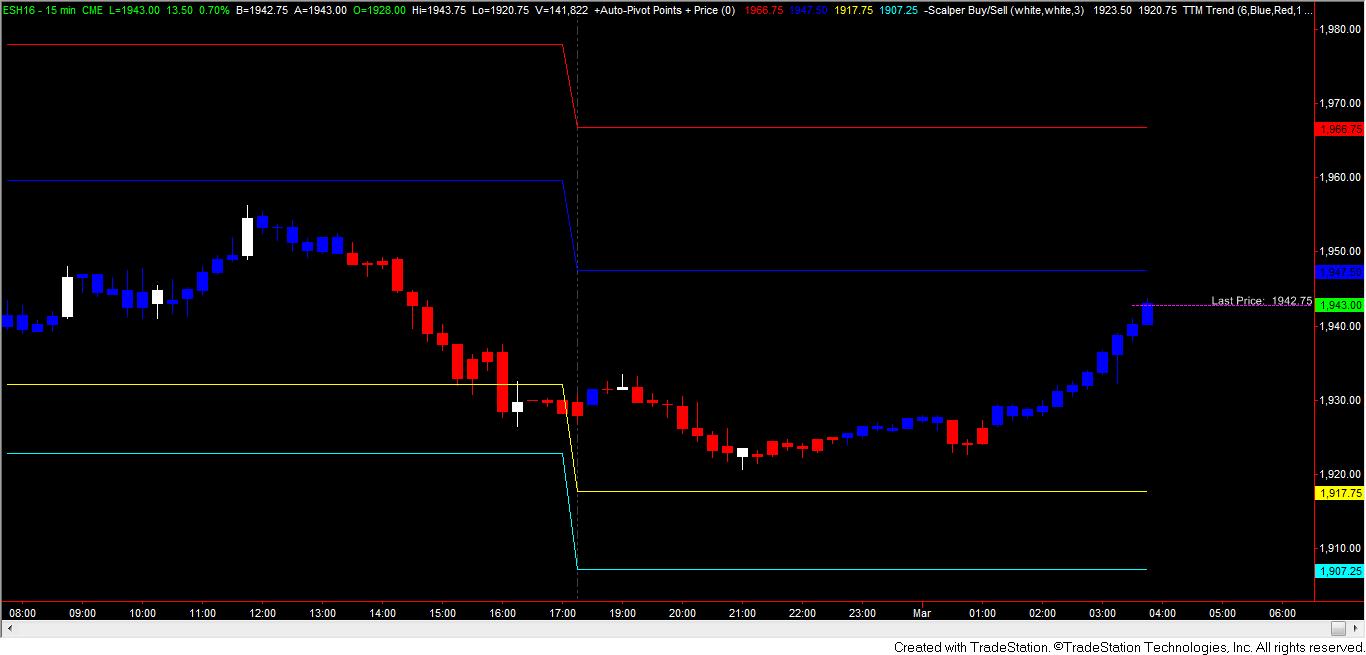
AUTO-PIVOT POINTS WITH PRICE.ELD
-
-
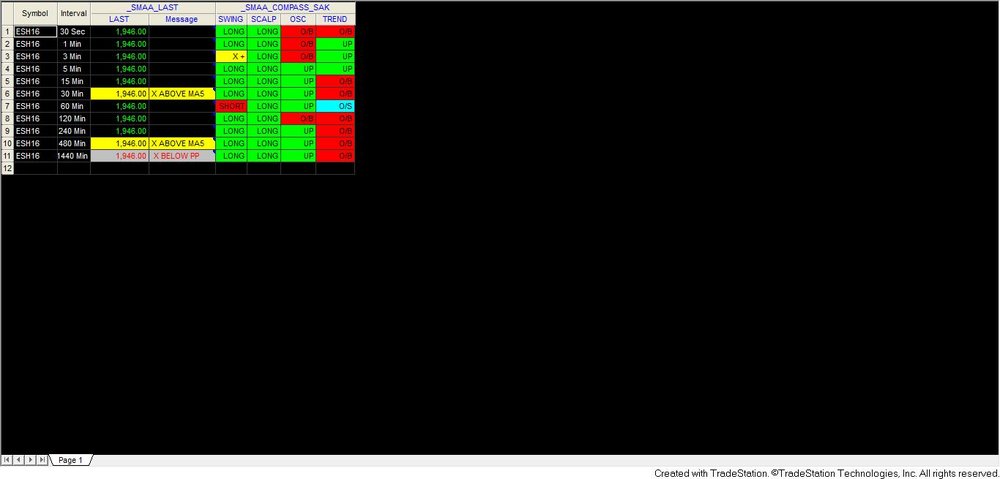
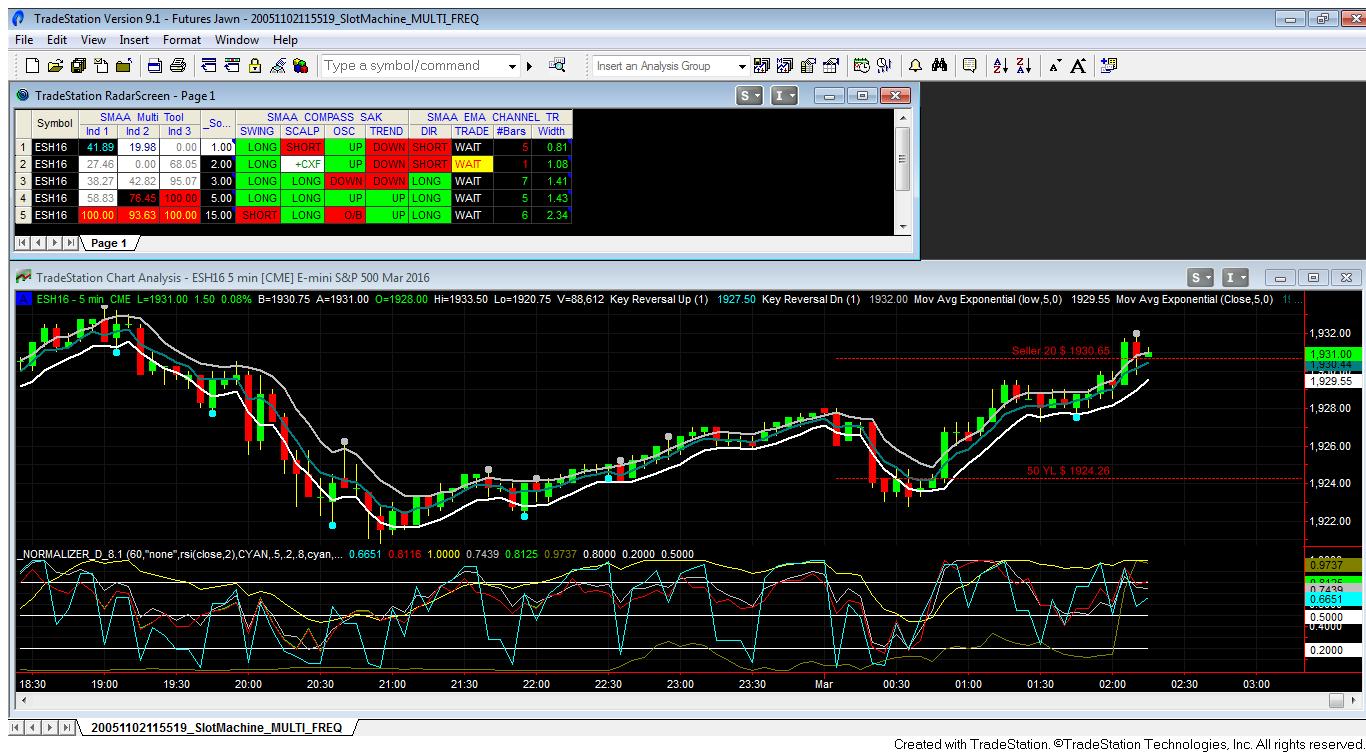
A little Radar Screen Multi Tool action ! Put an alert on that baby and when there's a move you'll know it ! Yeah and don't forget those battle line grids ! Tro makes money like He's watching a football game ! I might as well too !!!
-
-
Here is something like what your looking for . It's from TRO from back in the day .
Traders Laboratory - Forum Rules
-
-
use code box ! It's the number one reason for the errors . You have to see it to believe it ! Go back to your source and ask him or her to repost the same way . You can export save from your trading program to a txt file without the errors as well . Code gets lost or shuffled by just pasting in open space ! Please post back with the correct code from the source . It can be used as an example to all the wasted code on this site for the same reason !
Press # symbol from inside your post menu . Place code between
X here
SECTION_BEGIN("MOB Simulation"); SetChartOptions(0,chartShowArrows|chartShowDates); _N(Title = StrFormat("{{NAME}} - {{INTERVAL}} {{DATE}} Open %g, High %g, Low %g, Close %g (%.1f%%) {{VALUES}}", O, H, L, C, SelectedValue( ROC( C, 1 ) ) )); //Plot Colored Candles PlotOHLC(O ,H ,L ,C ,"Price",IIf(C>O,colorGreen,colorRed),styleCandle) ; Offset = 5; //Recommended to use two sheets: one with 5 and another with 7, or maybe other offset value Avgmov = Offset * MA (abs(ROC(C,1)) ,20); per = LastValue(Avgmov) ; numberOfBars = Cum(1); Range = 0.01; PS = TroughBars(L, per, 1) == 0; Title = Title + StrFormat("AVGMOV %g|%g|%g\n", Avgmov,per, numberOfBars); xa = LastValue(ValueWhen (PS,numberOfBars,1)) ;//x from last trough Ya = LastValue(ValueWhen (PS,L,1)) ;//y (Low) last trough PR = PeakBars(H,per, 1) == 0; xb = LastValue(ValueWhen (PR,numberOfBars,1)) ;//x from last peak Yb = LastValue(ValueWhen (PR,H,1)) ;//y (High) last peak Title = Title + StrFormat("PS %g|%g|%g|%g|%g|%g", PS,xa,ya,PR,xb,yb); Trough_ReTest = abs((L/ya)-1) <Range; Peak_ReTest = abs((H/yb)-1) <Range; Trough_Cross = Cross(ya,C); Peak_Cross = Cross(C,yb); //UP = upSwing DN = downSwing UP = xb>xa;//upSwing DN = xa>xb;//DownSwing RT23_6 = IIf(UP,yb-(yb- ya)*0.236, IIf(DN,ya+ (yb-ya)*0.236,-1e10) ); RT38_2 = IIf(UP,yb-(yb- ya)*0.382, IIf(DN,ya+ (yb-ya)*0.382,-1e10) ); RT50_0 = IIf(UP,yb-(yb- ya)*0.500, IIf(DN,ya+ (yb-ya)*0.500,-1e10) ); RT61_8 = IIf(UP,yb-(yb- ya)*0.618, IIf(DN,ya+ (yb-ya)*0.618,-1e10) ); RT78_6 = IIf(UP,yb-(yb- ya)*0.786, IIf(DN,ya+ (yb-ya)*0.786,-1e10) ); RT12_7 = IIf(UP,yb-(yb- ya)*1.27, IIf(DN,ya+ (yb-ya)*1.27,-1e10) ); RT16_1 = IIf(UP,yb-(yb- ya)*1.61, IIf(DN,ya+ (yb-ya)*1.61,-1e10) ); RT= IIf(UP,-100* (yb-L)/(yb- ya), 100*(H-ya)/( yb-ya));//Retracement_ Value InZone = C<yb & C>ya;//use it for filter to receive only signals that are in in the Retracement zone. Buy = Trough_ReTest OR peak_Cross; Sell = Peak_ReTest OR trough_Cross; Filter = 1; AddColumn(RT, "RT%"); AddColumn(Trough_ReTest,"TR- Test",1.0) ; AddColumn(Peak_ReTest,"PK-Test",1.0) ; AddColumn(Trough_Cross,"TR-Cross",1.0); AddColumn(Peak_Cross,"PK-Cross",1.0); //AddColumn(CdDoji( )OR CHammer(),"Candle" ,1.0); //Plot(C,"C",1, 64); Plot(IIf(numberOfBars>xa, ya,-1e10) ,"Bottom" ,colorBrown, 1+8); Plot(IIf(numberOfBars>xb, yb,-1e10) ,"Top",colorBrown,1+8); xab = IIf(xb>xa,xb, xa); //Retracements Plot(IIf(numberOfBars>= xab+1,RT23_6,-1e10), "R2 23.6% Retr.",5,styleLine | styleNoTitle | styleDots); Plot(IIf(numberOfBars>= xab+1,RT38_2,-1e10), "R1 38.2% Retr.",5,styleLine | styleNoTitle | styleDots); Plot(IIf(numberOfBars>= xab+1,RT50_0,-1e10), "ZR 50.0% Retr.",colorBlue, styleLine | styleNoTitle | styleDots); Plot(IIf(numberOfBars>= xab+1,RT61_8,-1e10), "S1 61.8% Retr.",colorDarkRed, styleLine | styleNoTitle | styleDots); Plot(IIf(numberOfBars>= xab+1,RT78_6,-1e10), "S2 78.6% Retr.",colorDarkRed, styleLine | styleNoTitle |styleDots); // Plot the MOB Cloud Plot(IIf(numberOfBars>= xab+1,RT12_7,-1e10), "127% ext.",colorBrightGreen, styleNoTitle | styleNoLabel | styleLine); Plot(IIf(numberOfBars>= xab+1,RT16_1,-1e10), "161% ext.",colorBrightGreen, styleNoTitle | styleNoLabel | styleLine); CondA=IIf(numberOfBars>= xab+1,RT12_7,-1e10); CondB=IIf(numberOfBars>= xab+1,RT16_1,-1e10); PlotOHLC(Condb,Condb,Conda,Conda,"",ColorRGB(30,13 0,30),styleCloud, styleNoTitle | styleNoLabel); GraphXSpace = 0.5; //Plot(Gauss2ord(C,5),"M5",4,1); //GraphXSpace = 1.5; //Title = Name()+" per = "+WriteVal(per, 1.0) +" Close = "+WriteVal(C, 1.2)+ " ("+WriteVal( ROC(C,1), 1.2)+"%)" +" Current Correction = "+WriteVal(RT, 1.0)+"%"; //Plot( Volume,"V", ParamColor("Color", colorBlueGrey ), ParamStyle( "Style", stylehidden| styleOwnScale | styleThick, maskHistogram ), 2 ); _SECTION_END( ); -
Ok , you should post any links and pictures you might have to help . Perhaps you should just download some of TRo's old indicators .

-
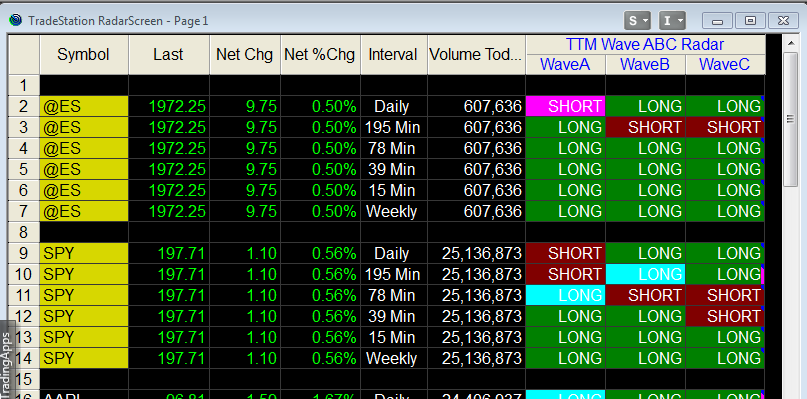
Check the video out here ; How To Use The TTM Combo Wave
He says you don't need wave b just a and c waves . The indicators are already posted here ; http://www.traderslaboratory.com/forums/trading-indicators/16938-ttm-wave.html
Download and install indicator from the other thread . Place indicator in tradestation my work folder .Open this workspace and you should be good to go . You'll have to adjust the settings to your liking . Good luck and happy trading .
-
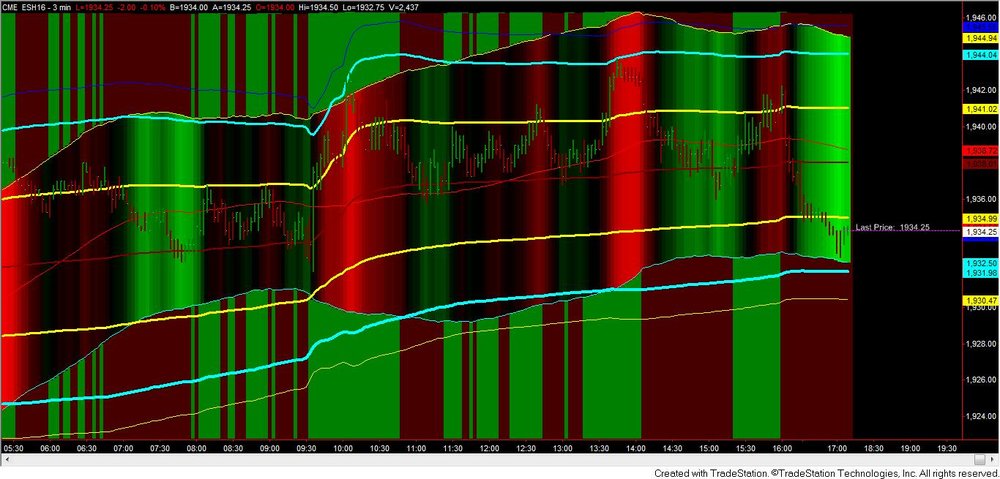
You can add Tam's paint the town red and a J pearly vwap and your thrunning !
-
Thanks Tams ! hope your doing well .
-
Works fine sir , you need the correct ticker ! right click, Format analysis techniques, format ,(select your indicator ) , scaling , scale on ; same as underlining data ! Done and any other changes you got to go under the hood (code )
-
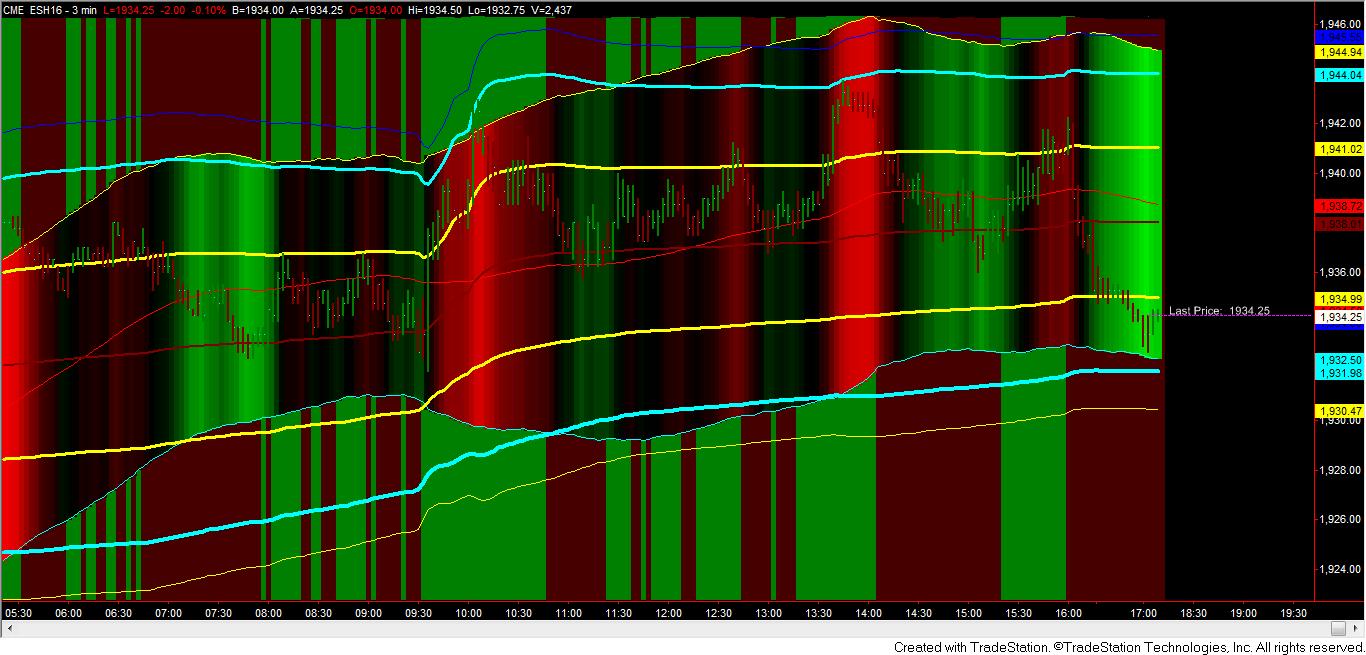
The wick zone is looking good there TRO . The Tradestation forum will never know what could have been (since you left). Nobody every gave as much as you . Best of luck to you Sir . Your ideas scared them Drain The Banksters !
-
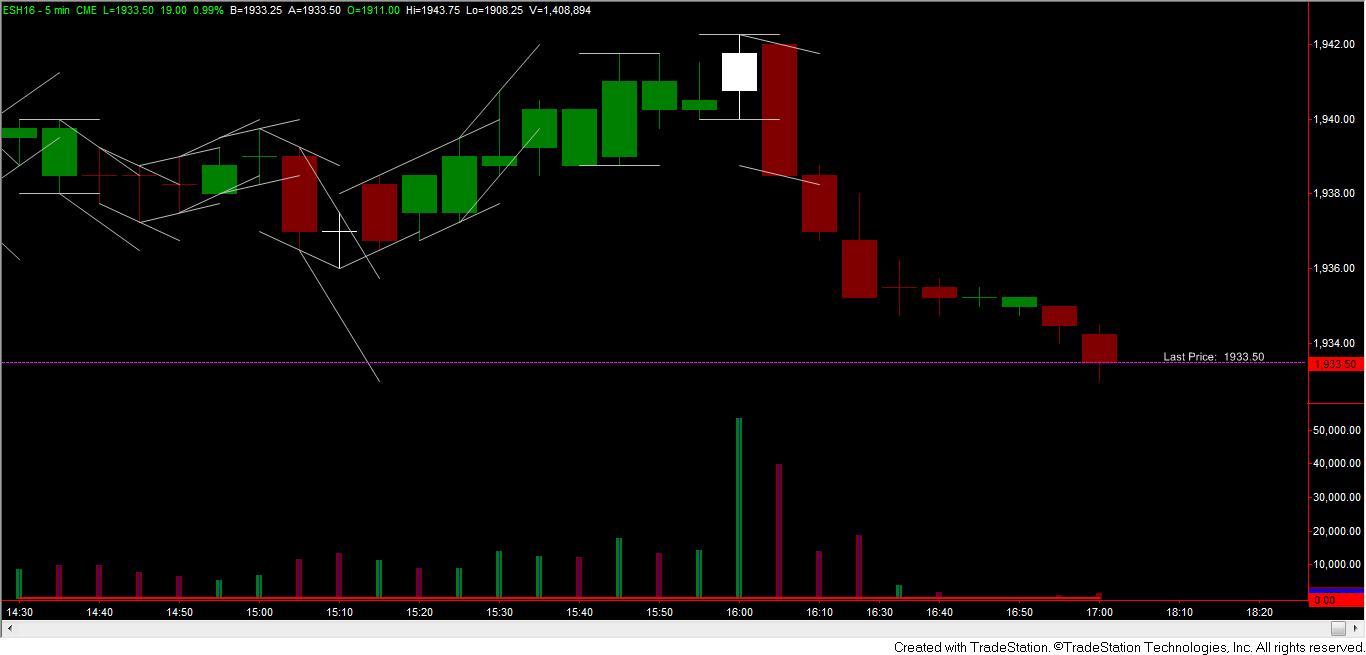
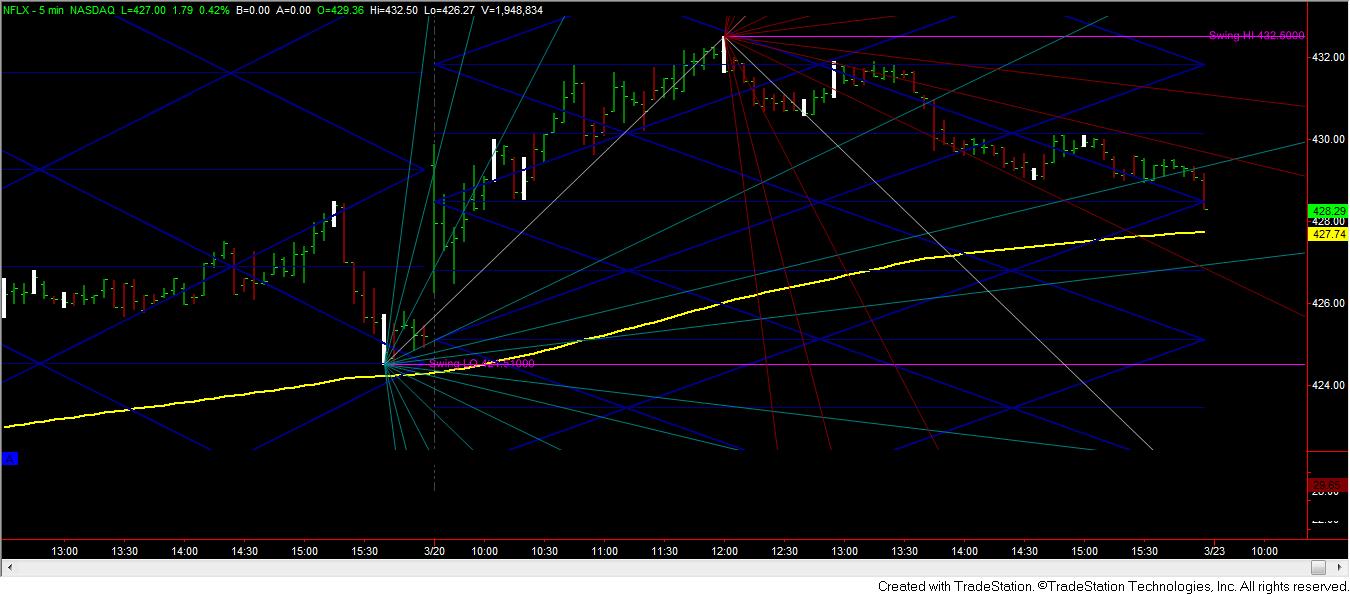
Alan Sqaure & Gann Lines ! Looks like a Star Trek episode but ........

-
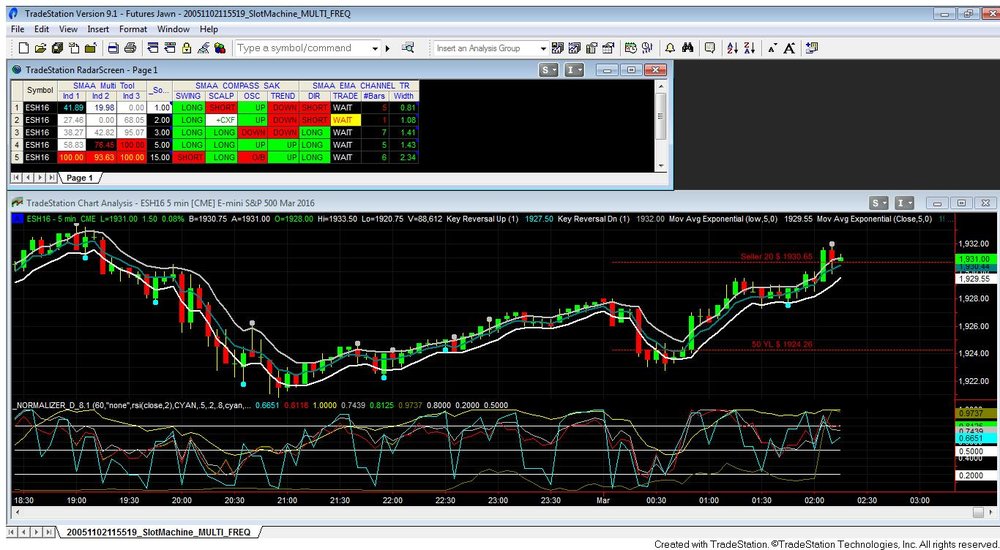
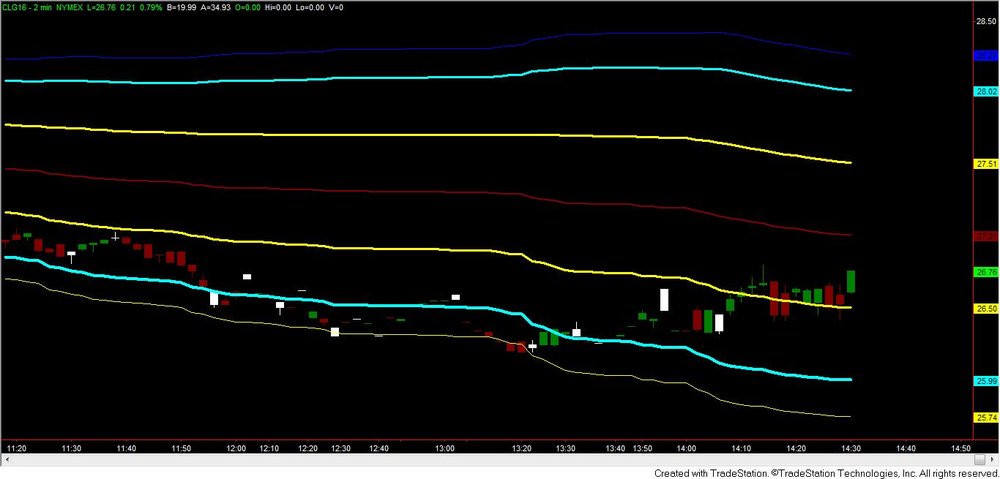
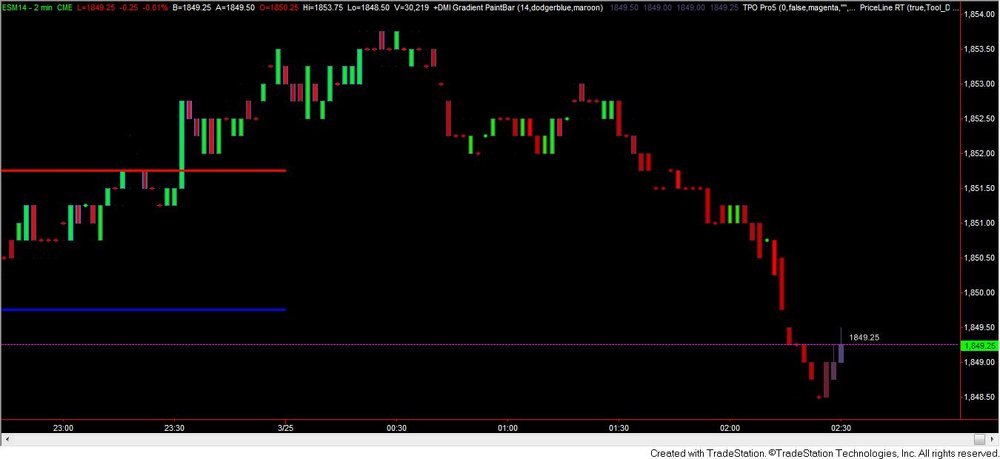
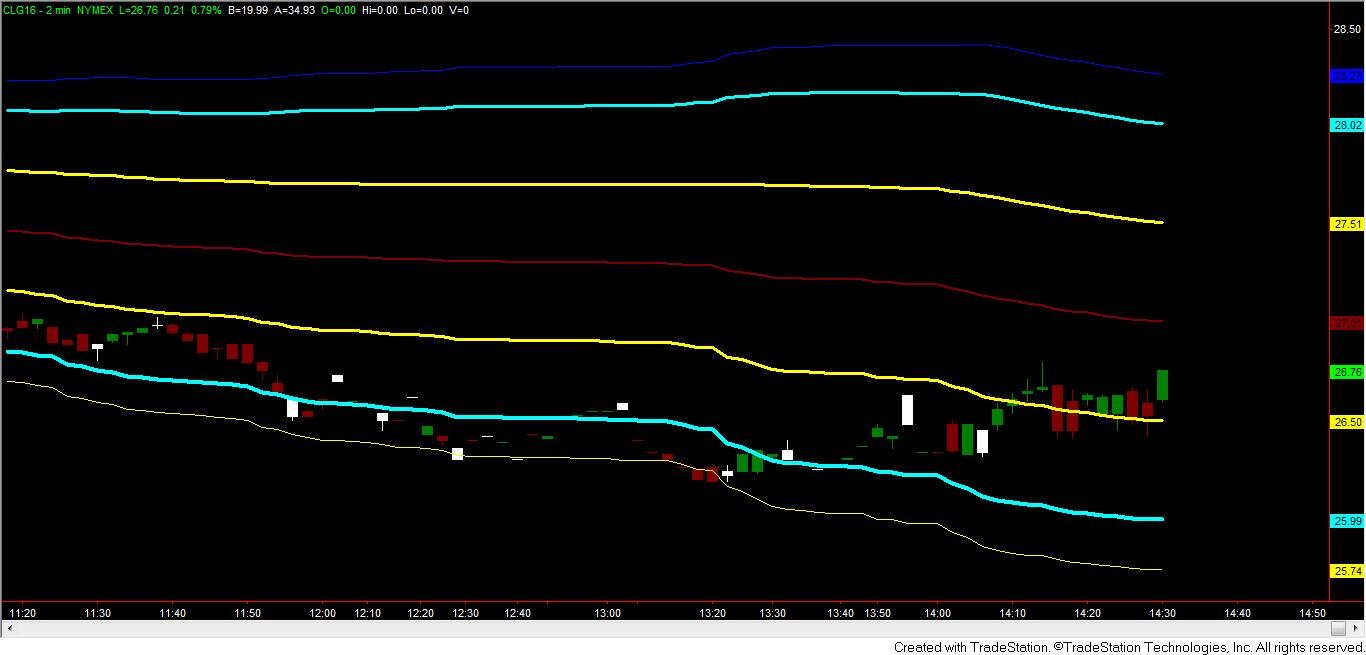
The chart has 3 moving averages. When they cross you make a trade long or short. The yellow highlighted area is done manually most likely .
Go here and down load these indicators for starters . Good luck
http://www.traderslaboratory.com/forums/technical-analysis/2788-chimp-s-new-futures-scalps-3.html
-
Do a search a NinjaTrader version is posted on this site .
-
CODE]
http://forum.as-1.us/redirect.php?fid=13&tid=2892&goto=nextoldset
-
Screen shot of above posted indicator !


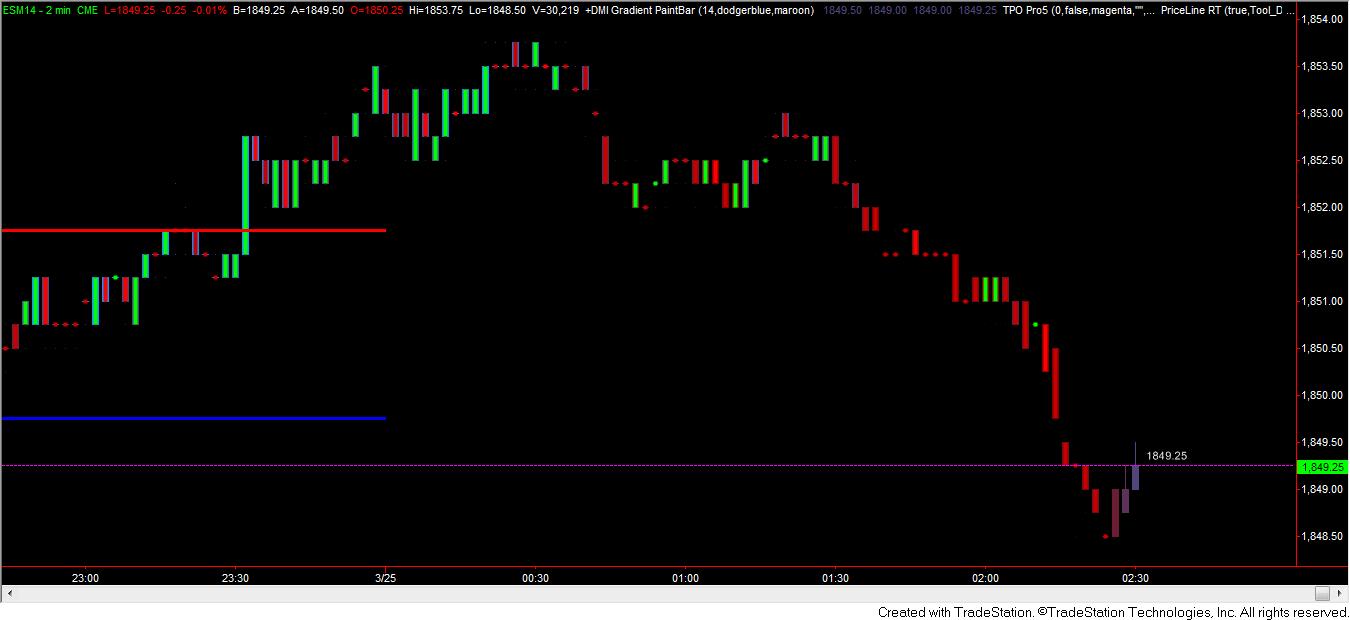
Harmonic Indicator
in Coding Forum
Posted
Marsalla Marceau is no longer using Tradestation and the indicator is a work in progress. The Butterfly indicator seems to be as well. However there both worth having but I like to watch Tams's in a 30 minute chart.
surinotes sells an abc indicator worth having however you wouldn't be able to see the code! Most of the harmonic code logic seems to be well guarded . However some information is out there to kick start your efforts!
I would add a PRZ zone and fib zone to Tams's and Marsalla's indicator and go from there. May I add that Patterns are not the holy grail.Patterns work and they fail as well!
MQ4 indicator and pdf down below .
PRZ Backtesting with Harmonic Pattern Plus_v1.0.pdf
Harmonic.indicator.zip