
Welcome to the new Traders Laboratory! Please bear with us as we finish the migration over the next few days. If you find any issues, want to leave feedback, get in touch with us, or offer suggestions please post to the Support forum here.


johnnydaymon
-
Content Count
144 -
Joined
-
Last visited
-
Days Won
1
Posts posted by johnnydaymon
-
-
Hello TRO!,how are you adjusting from short to longer period trading? Great political vids and hope you keep the trading vids coming too! Did you ever make a mq4 tunnel indicator?
-
Thank you aaa for the links! Good trading to you.
-
Thank you Andrew Jackson.Posting some links are good too.Keep up the good work.There is a lots of code laying idle because nobody has any idea what the hell it is without a picture. I want to encourage everyone to contribute in the war on HFT BOTS! Every time they steal the bid and ask from you it's them! Spoofing in and out like a cloking device from star trek. Stealing your money with the help of QE3 unlimited at a tune of 85 billion a month!Good day sir.
-
Seems there is but yet another version here also; http://www.traderslaboratory.com/forums/trading-indicators/10265-support-resistance-auto-plots.html
-
Nice indicator but it's done by TRO too! Only a hundred years ago! TRO coded it to MQ4,TS, Esignal,Multi Charts and so on. http://www.traderslaboratory.com/forums/trading-markets/4859-never-lose-again-therumpledone.html
-
Code with out a picture is just code. Code with a picture you get an idea what it does.
-
Kool will check that out and if you think of anything else please post it.Thanks again estate1997.
-
Check out three different types all doing the job!
-
Tradewinds your code did not verify. Can you post the eld or the verified code?
-
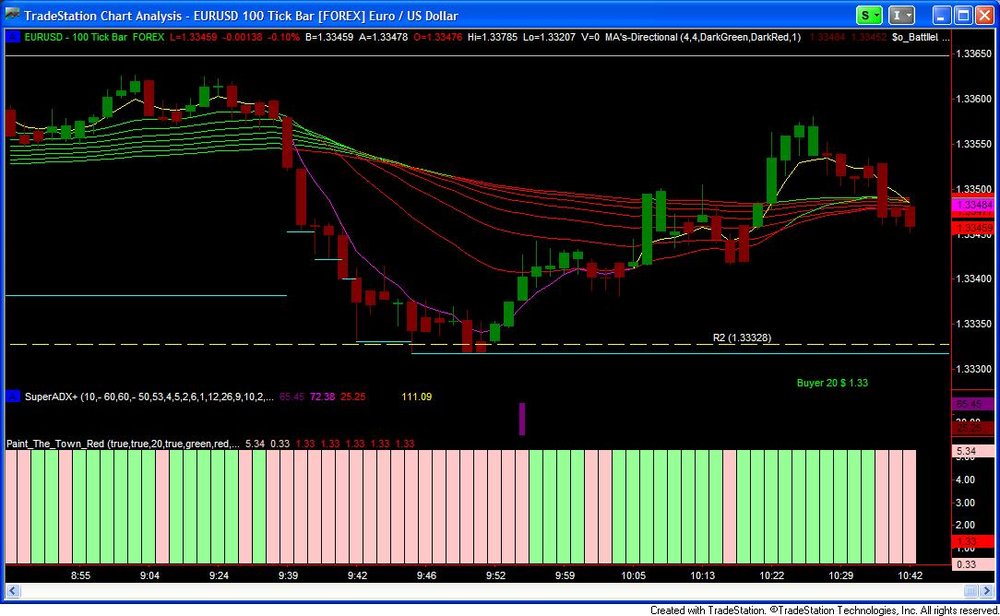
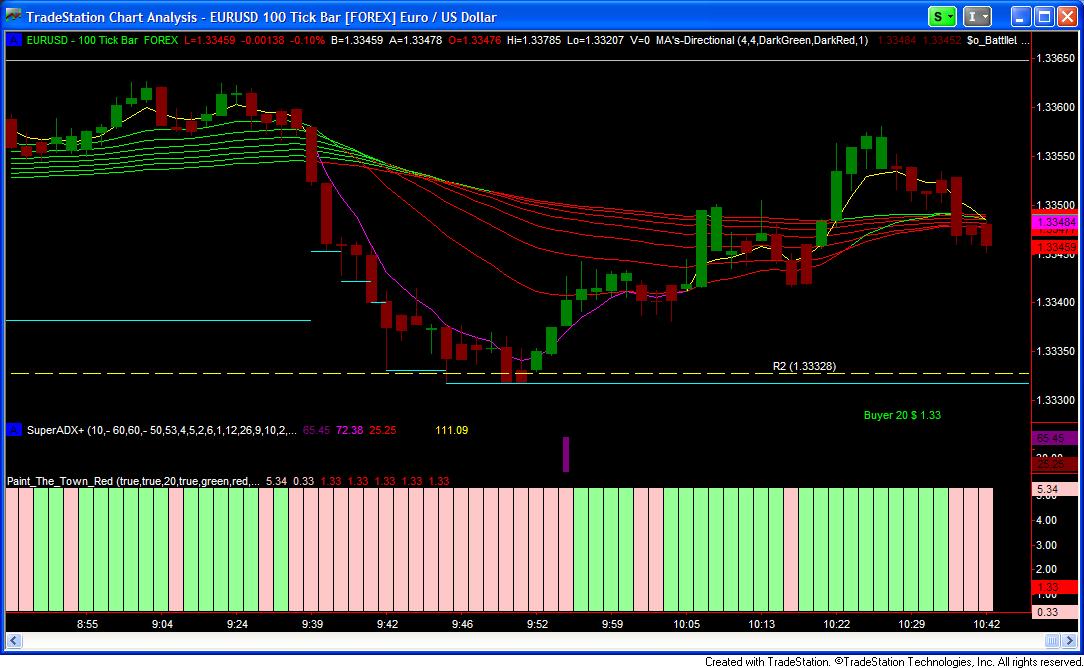
Red bars are the most powerful.Make sure you format all styles to histogram.Custom your sound and set alert to continuously. It is best to have them set on different time frames.

-
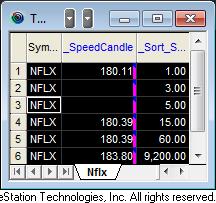
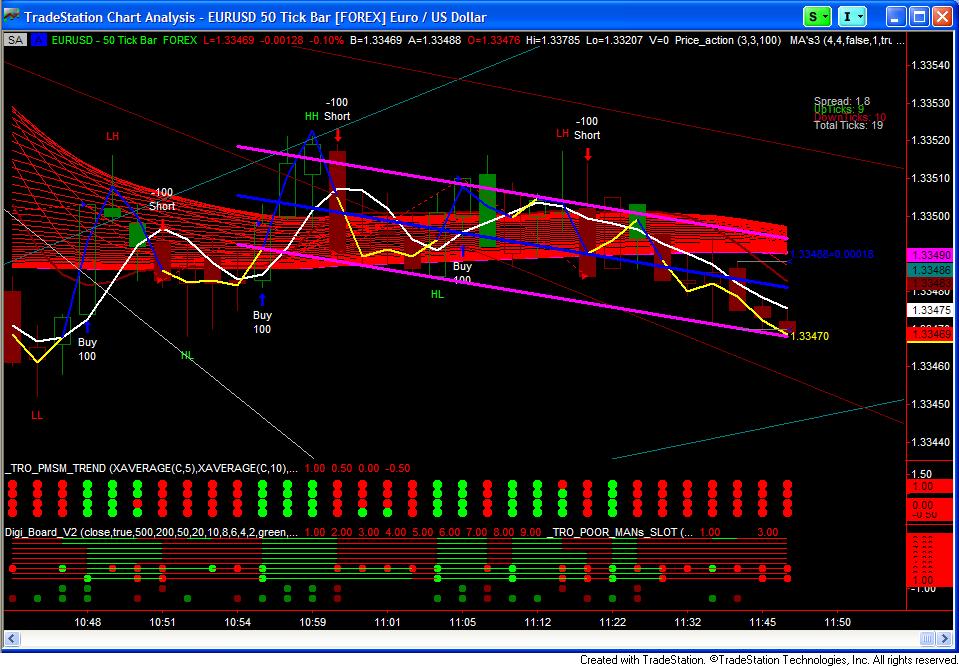
In the retail trading community we are limited in many ways.However we as traders can share ideas of how to track the bots. At least this way we can stay in the game.Here is one simple radar screen indicator tracking the speed of a candle,alert included. I hope coders will share their ideas and help everyone make more capital.
-
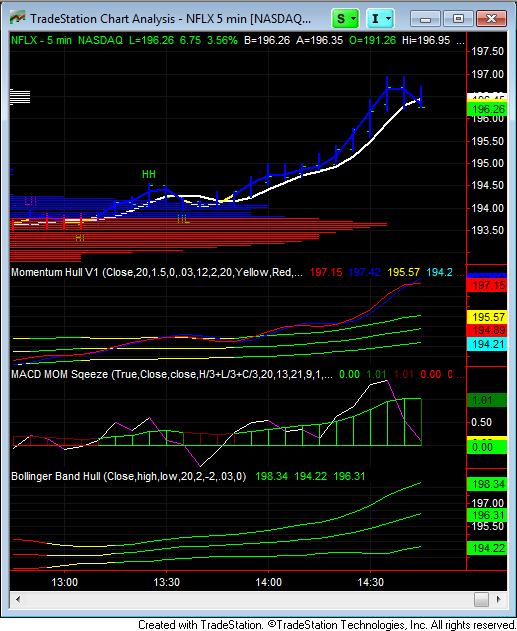
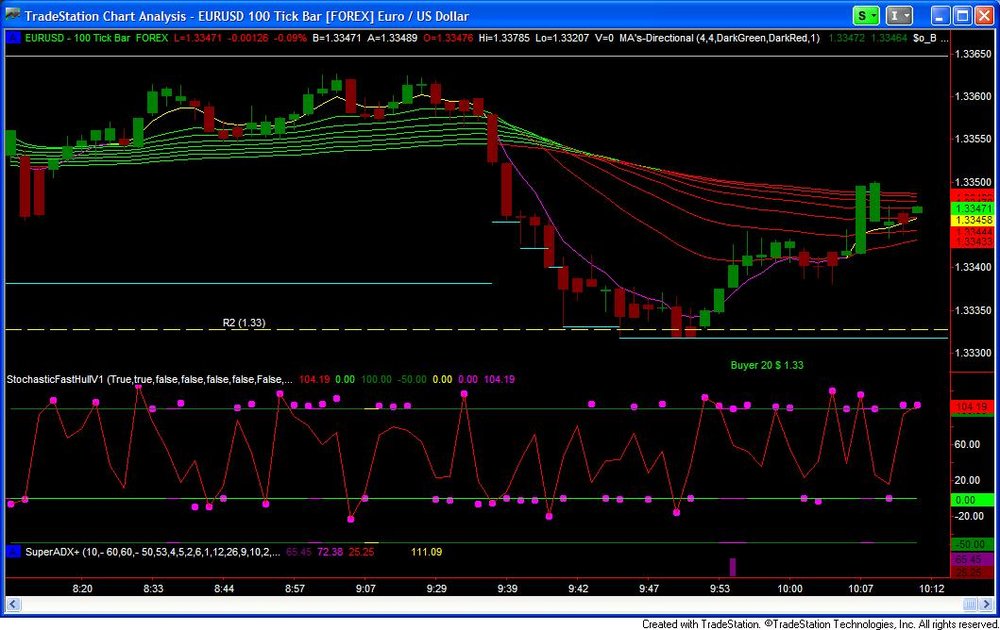
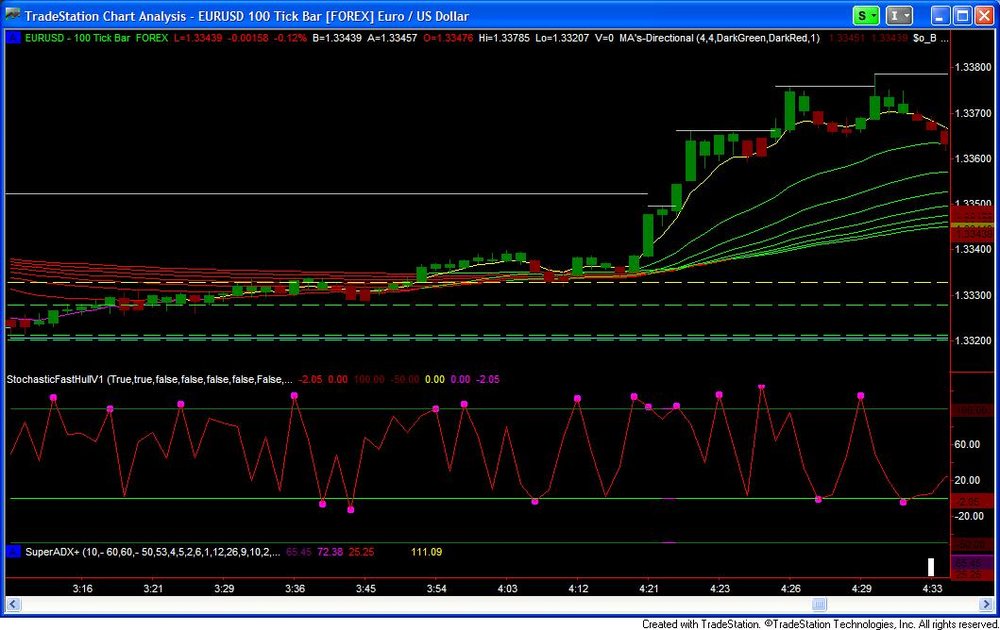
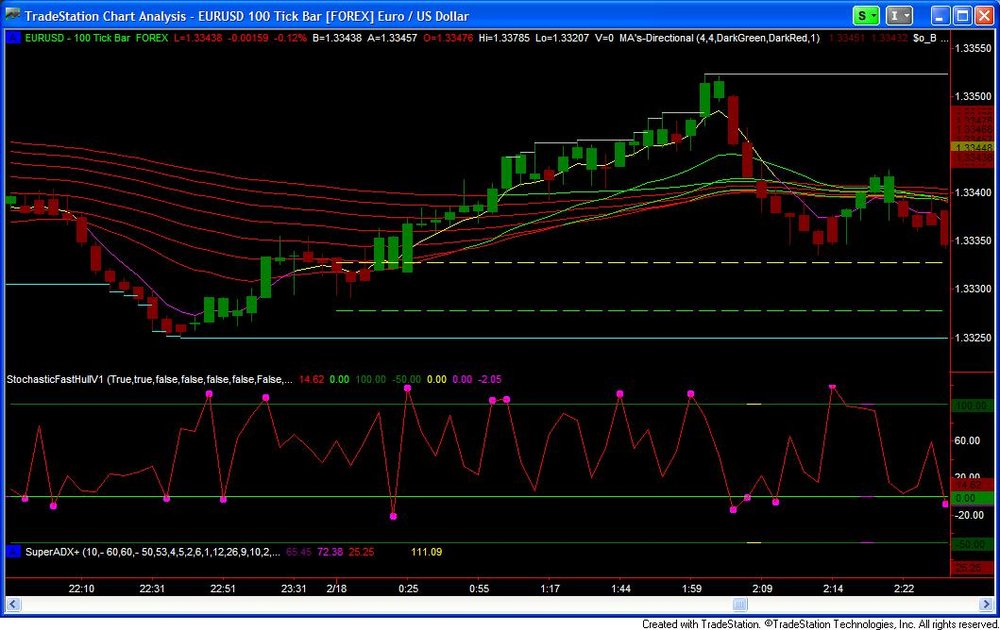
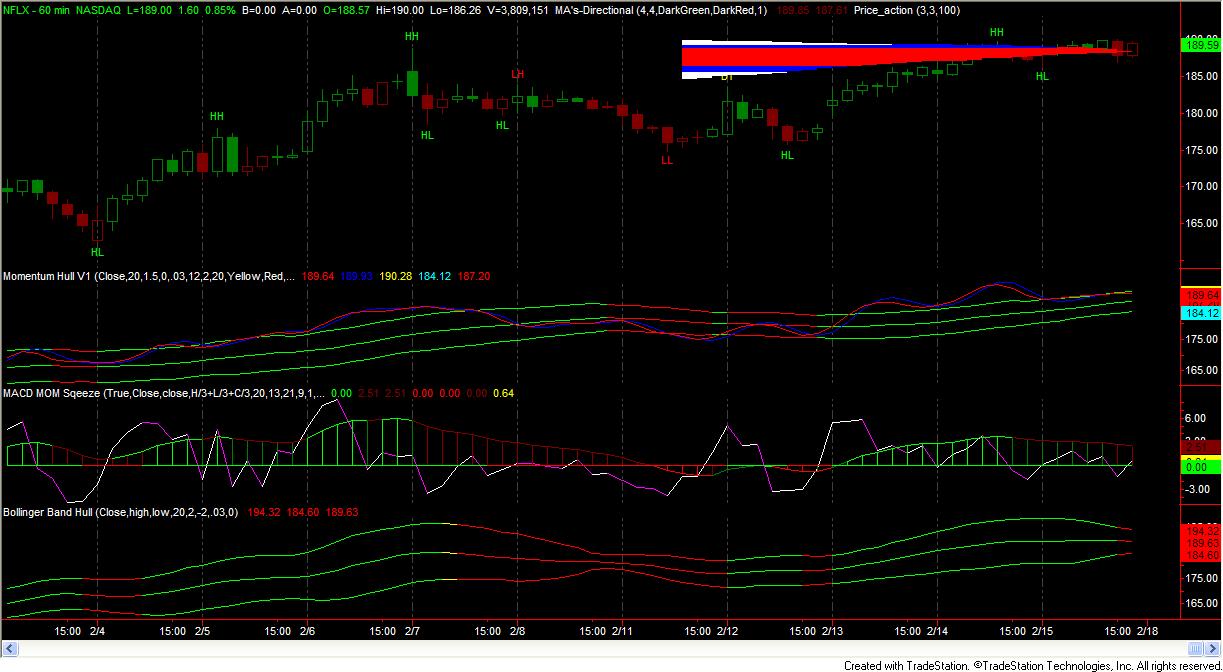
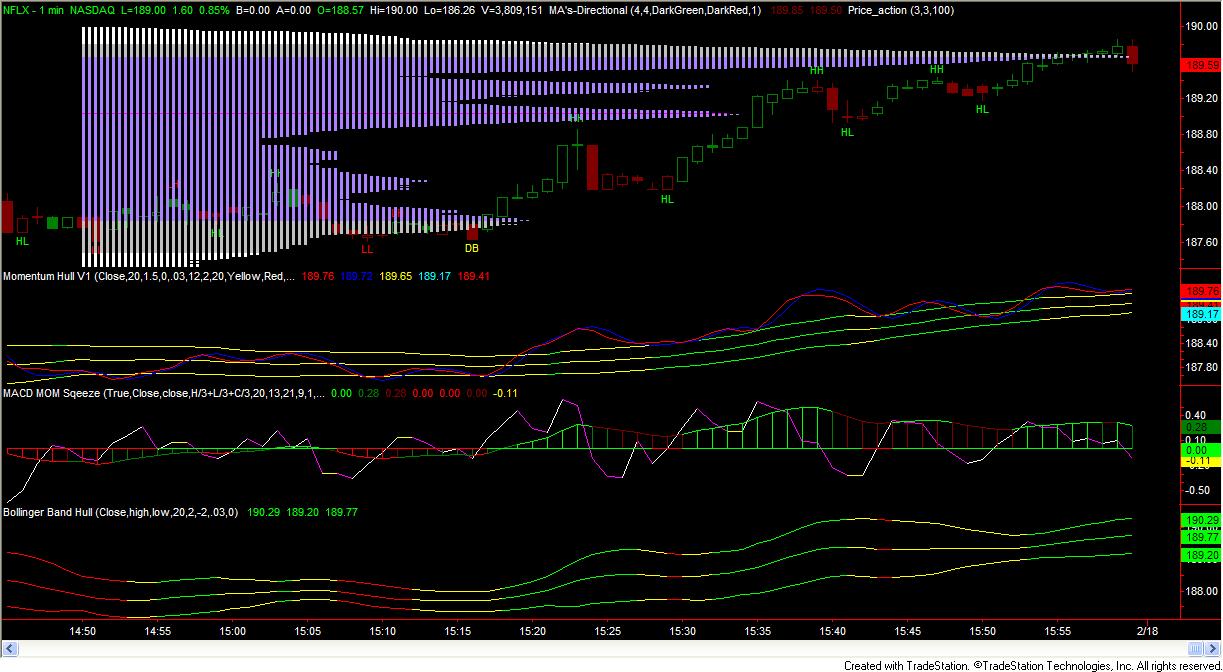
Those Hulls & Mac are pretty darn nice Estate1997! I retired my old ones because yours are Scoring like bobby hull!
-
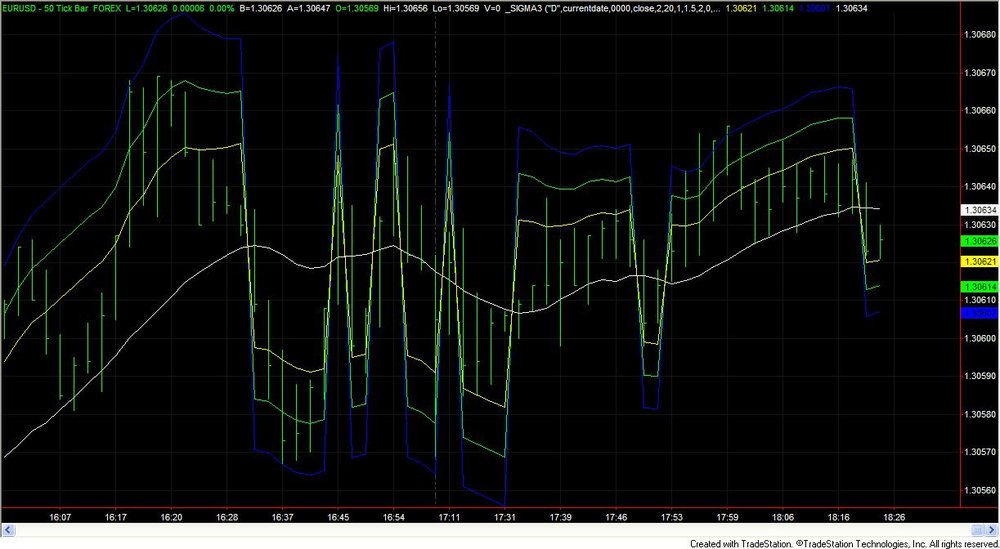
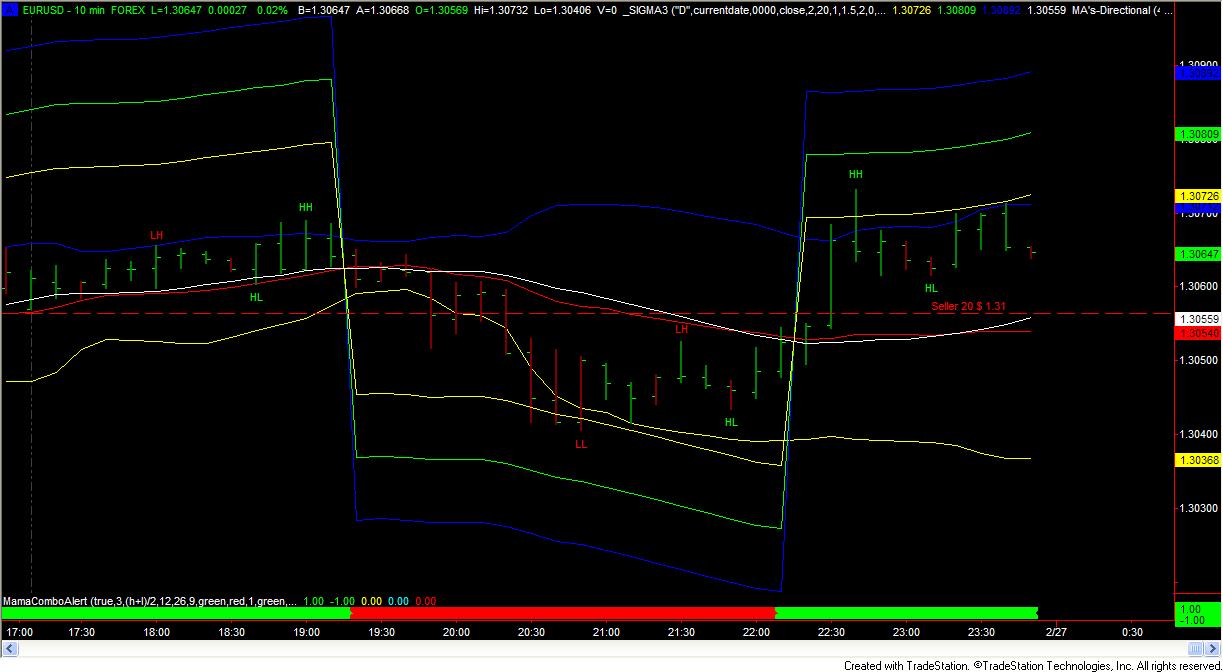
Found another Tro indicator _SIGMA3 here; http://www.traderslaboratory.com/forums/trading-indicators/4606-sigma-bands-cqg-2.html#post175035

-
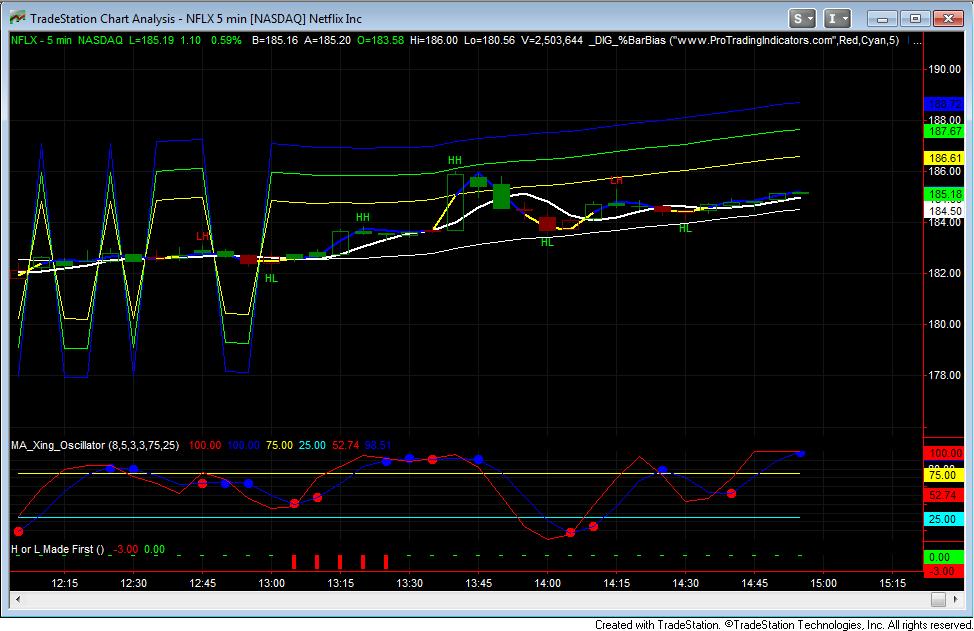
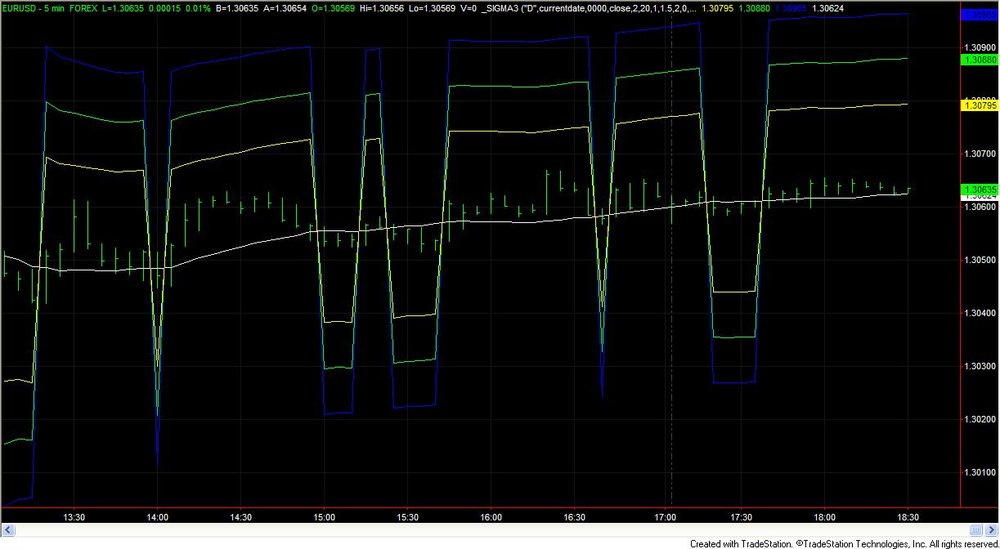
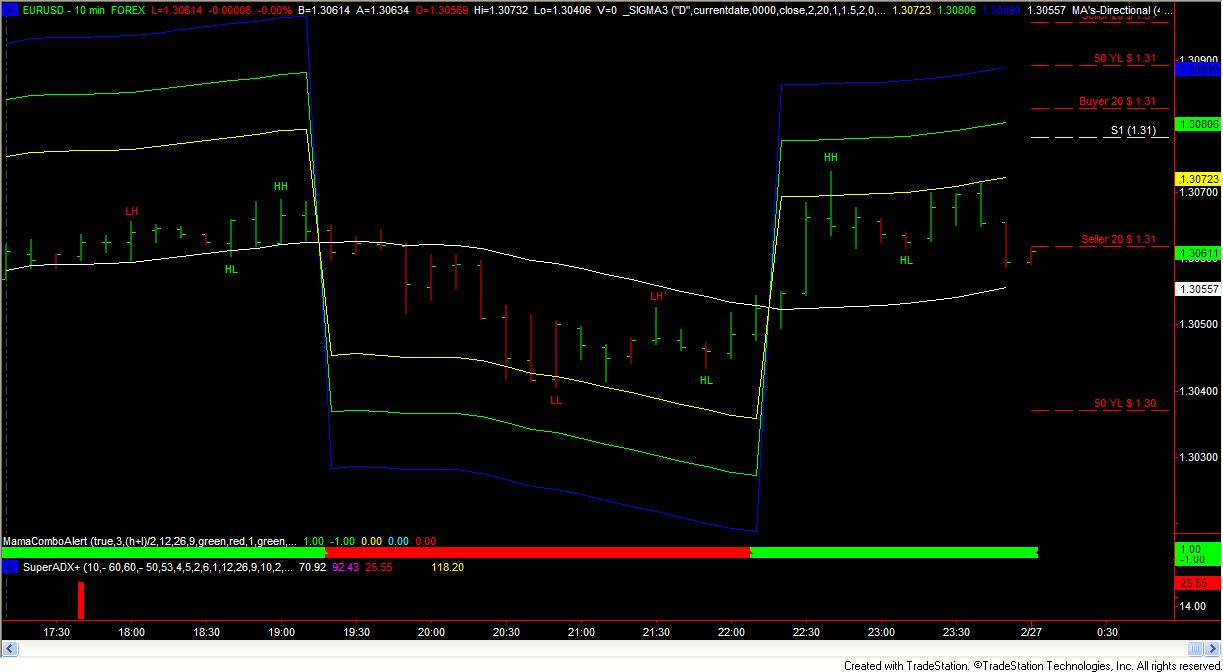
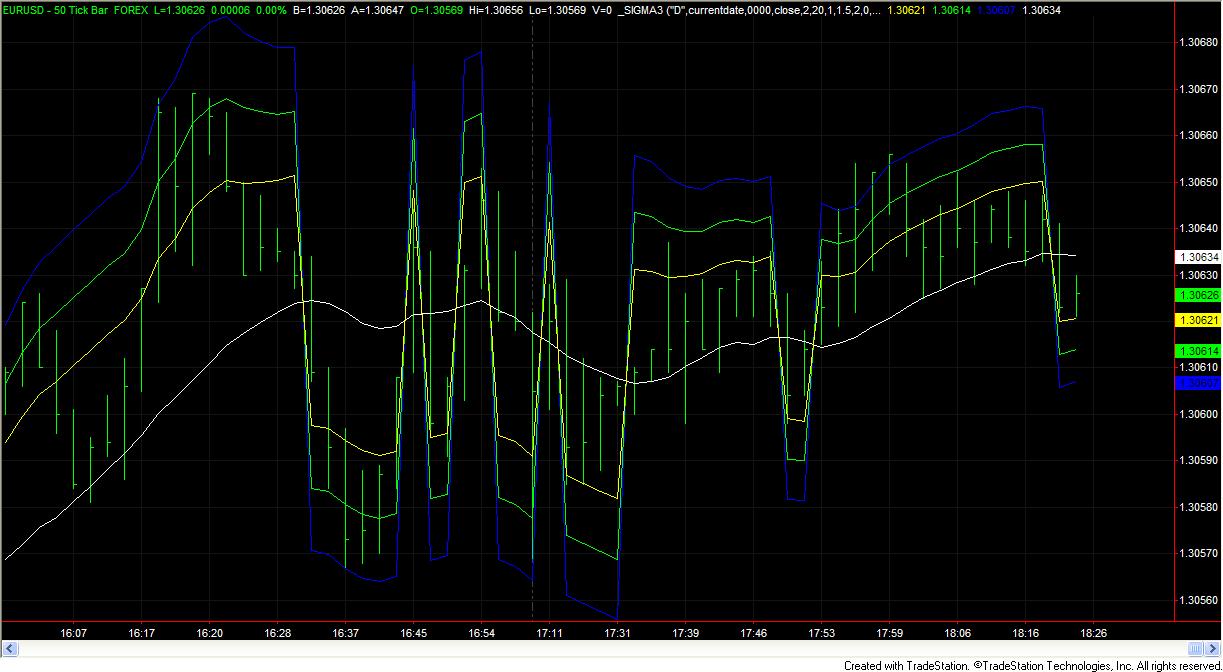
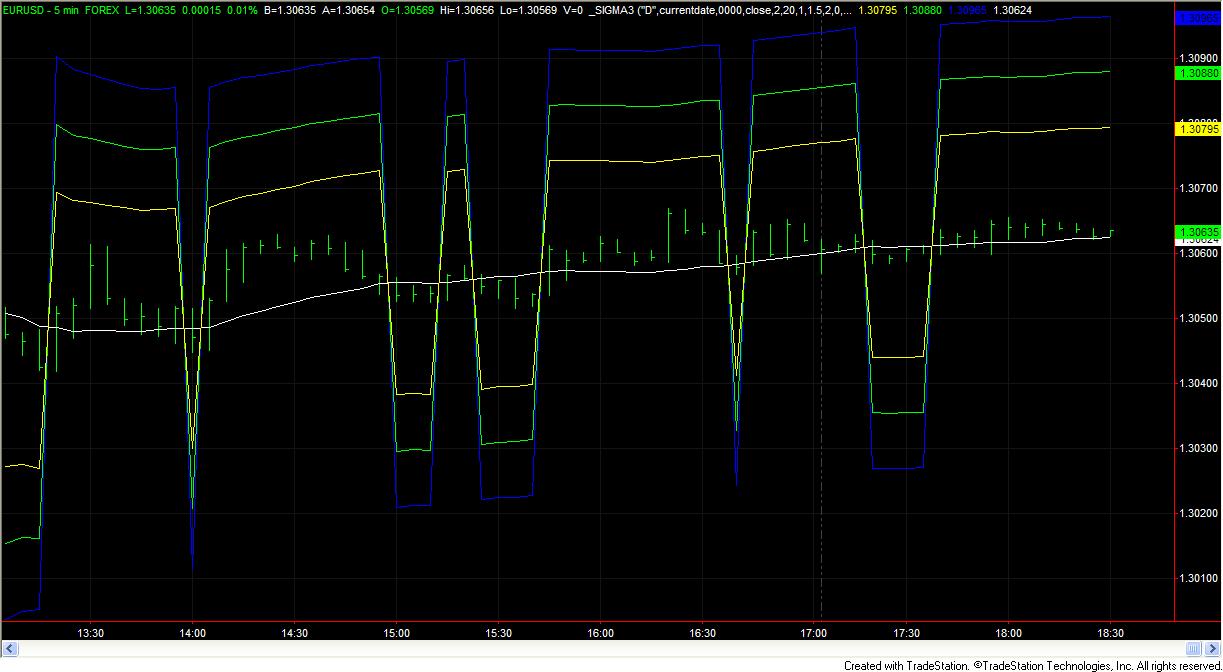
The last Part of this code in the text file in post # 13 does not belong in the _sigma3 indicator! TRO's code Works on OHLC Bars,HLC Bars only. Doesn't work on Renko or daily charts, just minuts and tick charts.When Vwap is overlayed on the chart you see the white line and red line match. The white line is from sigma3 and the red is vwap. Now you know what the white line is.
-
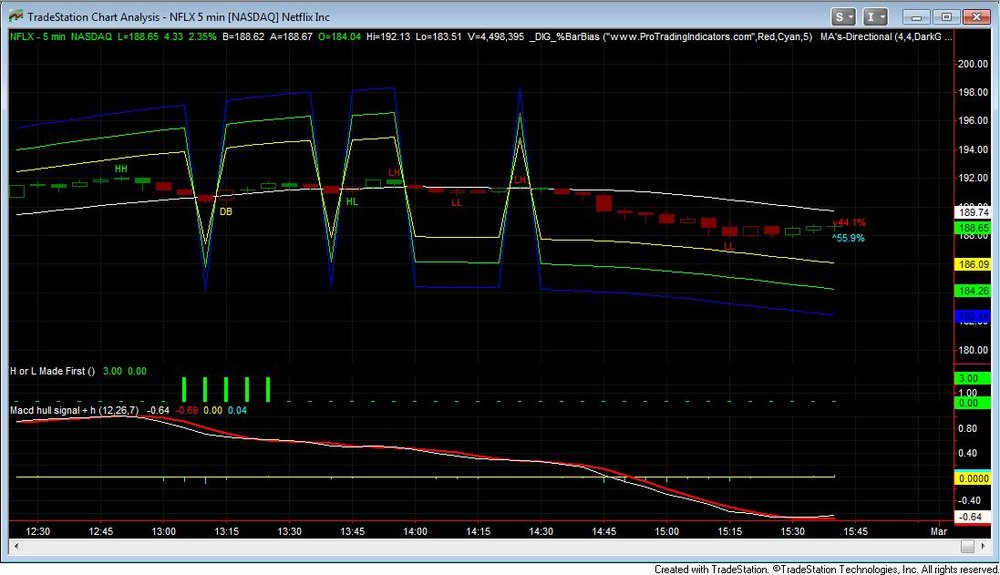
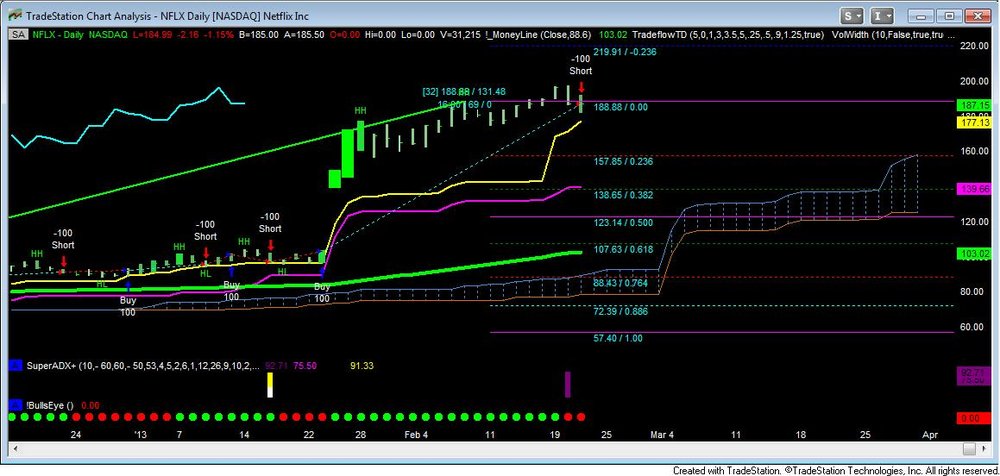
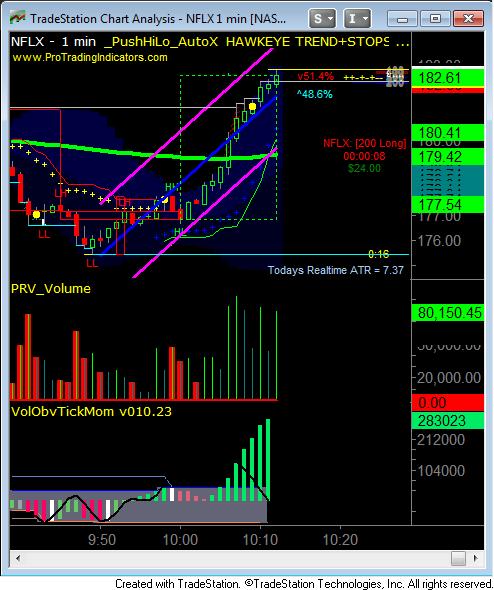
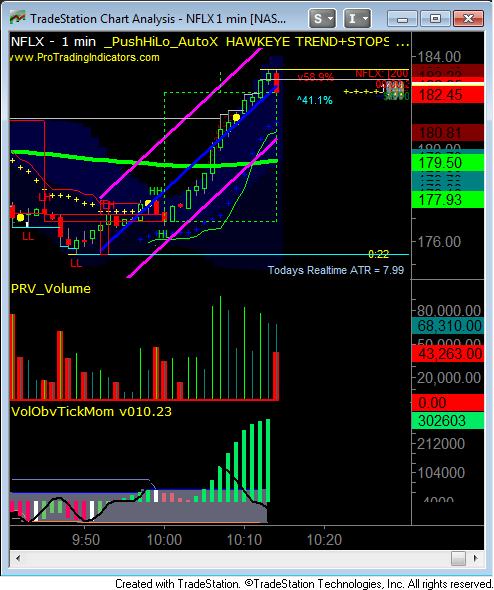
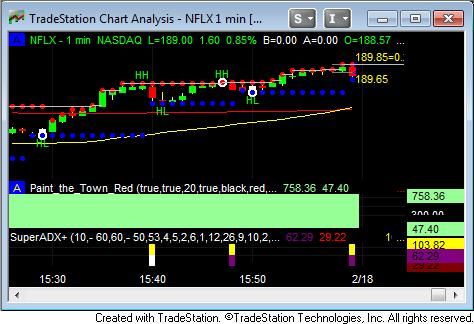
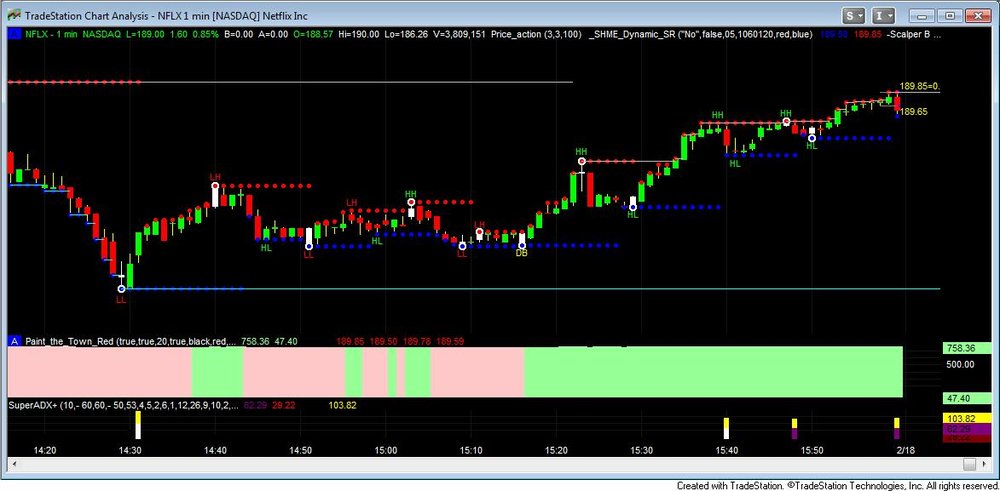
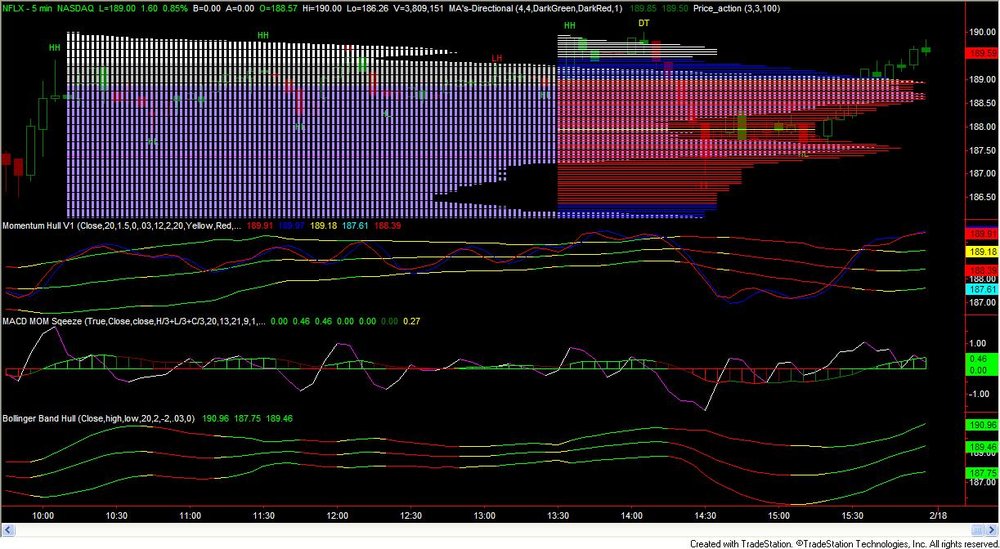
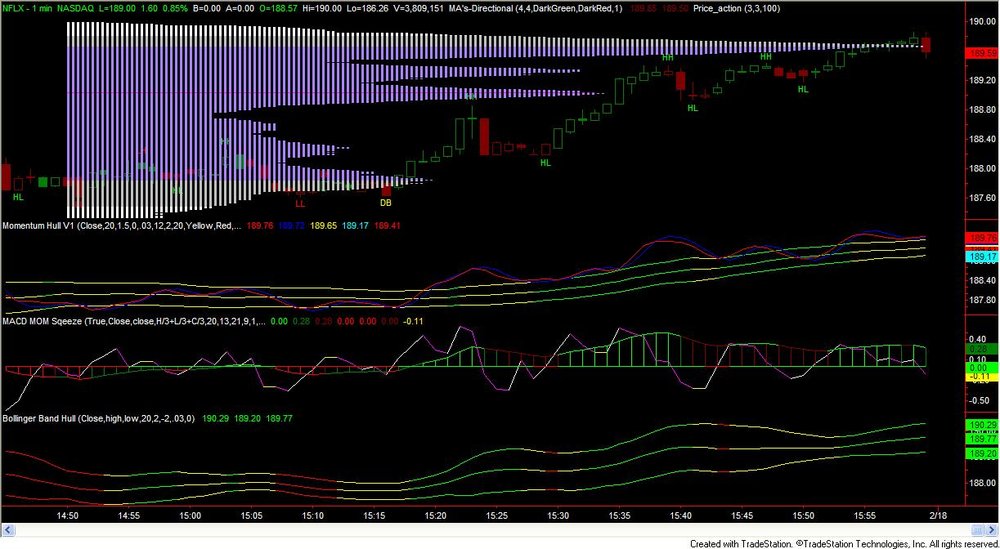
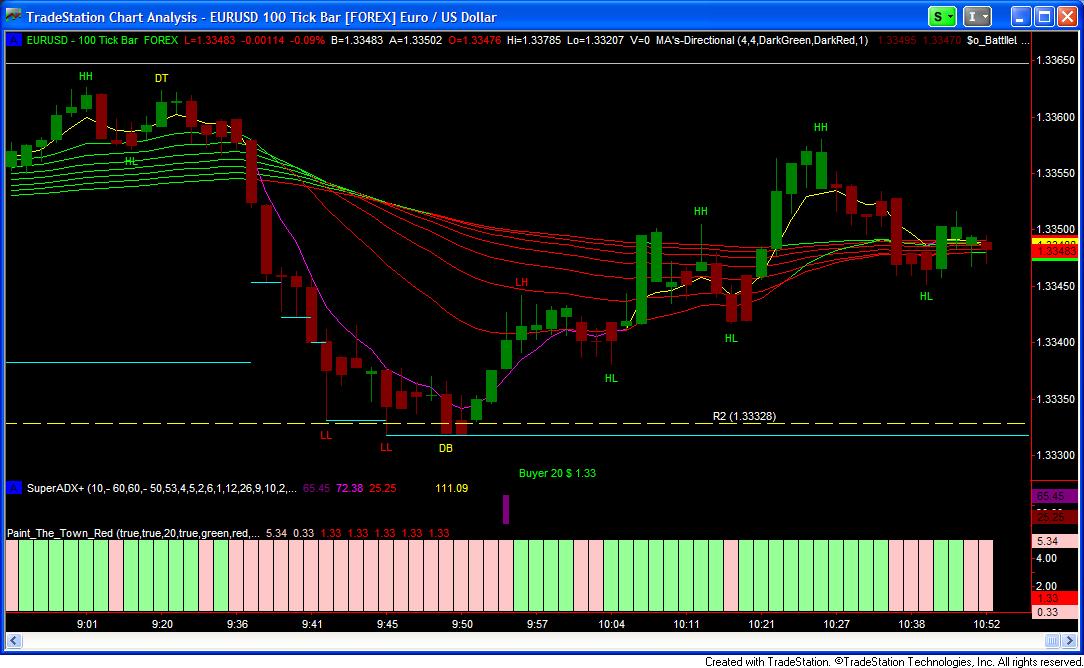
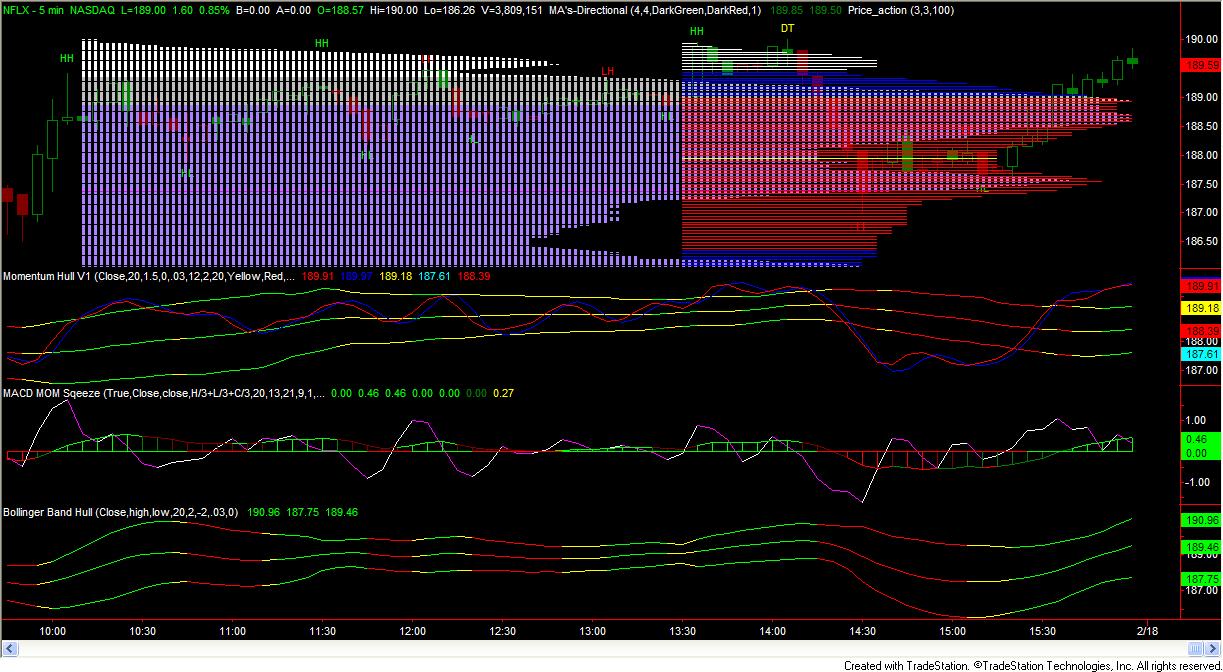
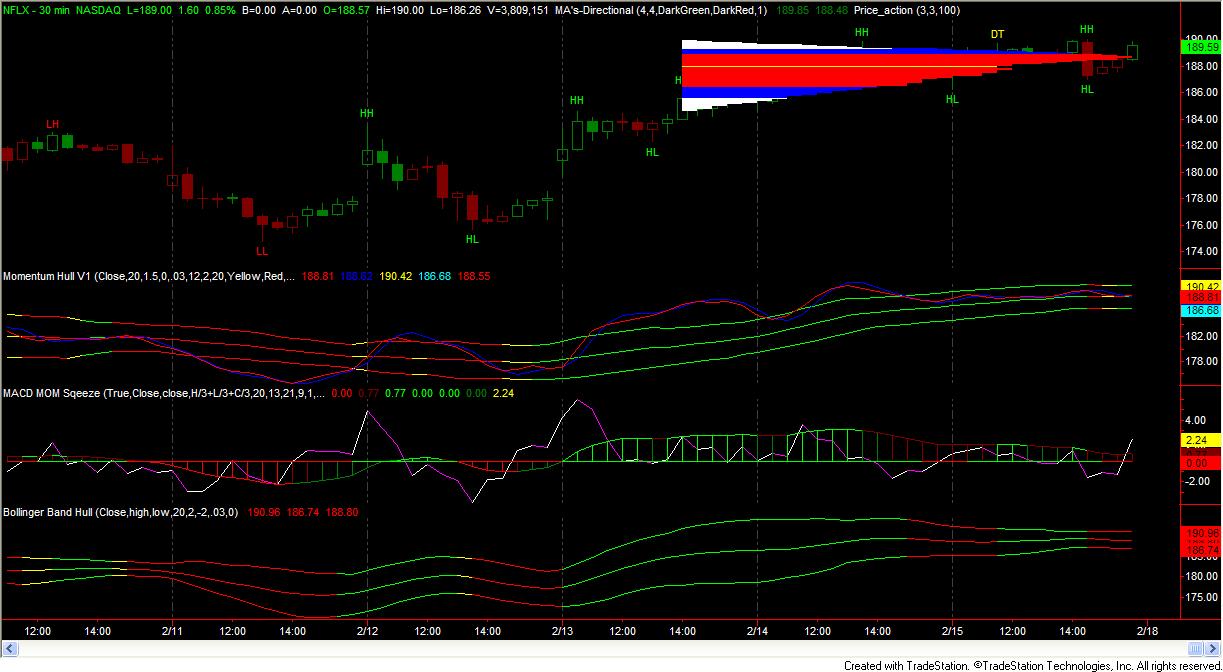
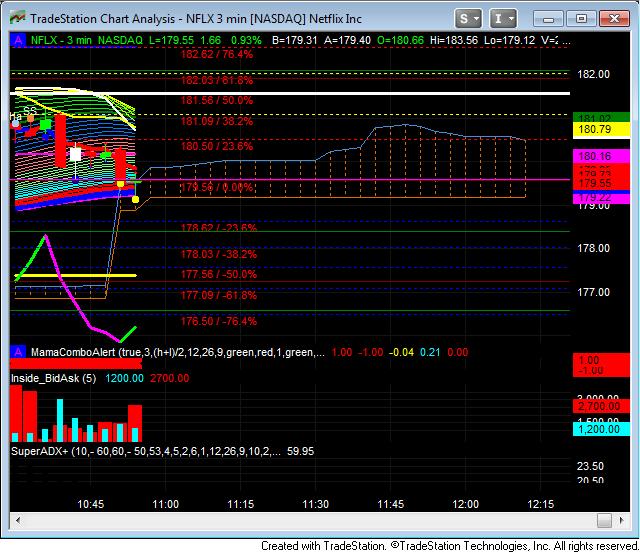
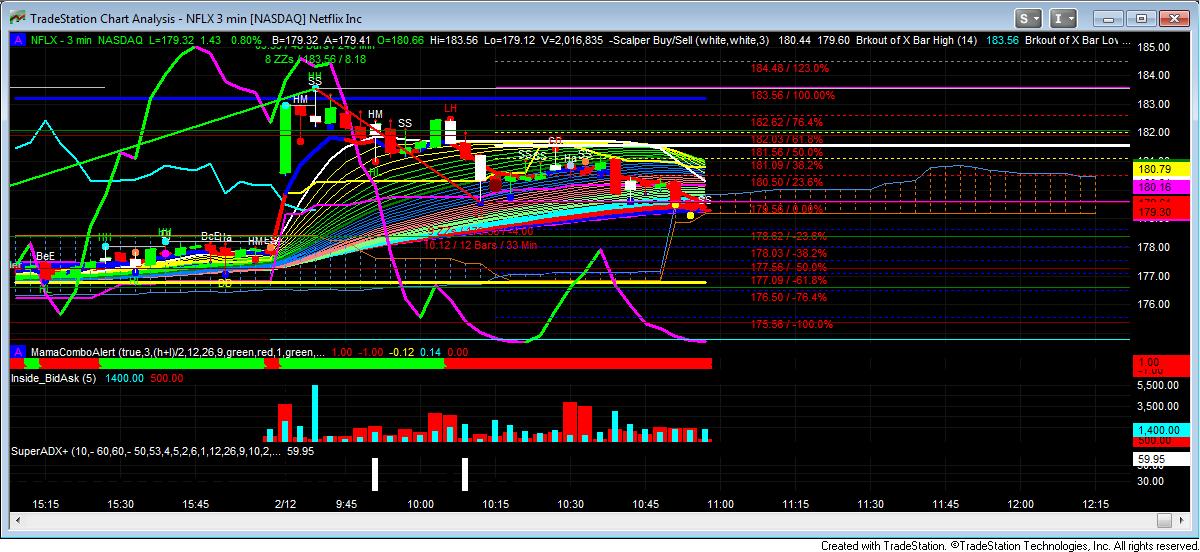
Super Adx + Nailing the top on Nflx! However you need to add alerts for the rest of the colored bars.Not all of the colored bars alert. Coding your alerts are critical for the reversals. The Hft Bots come quick on the daily as well. A must indicator on all charts!
-
Here is another type of Sigma-Hurst bands.It's a variation of the last post.Both are nice indicators
-
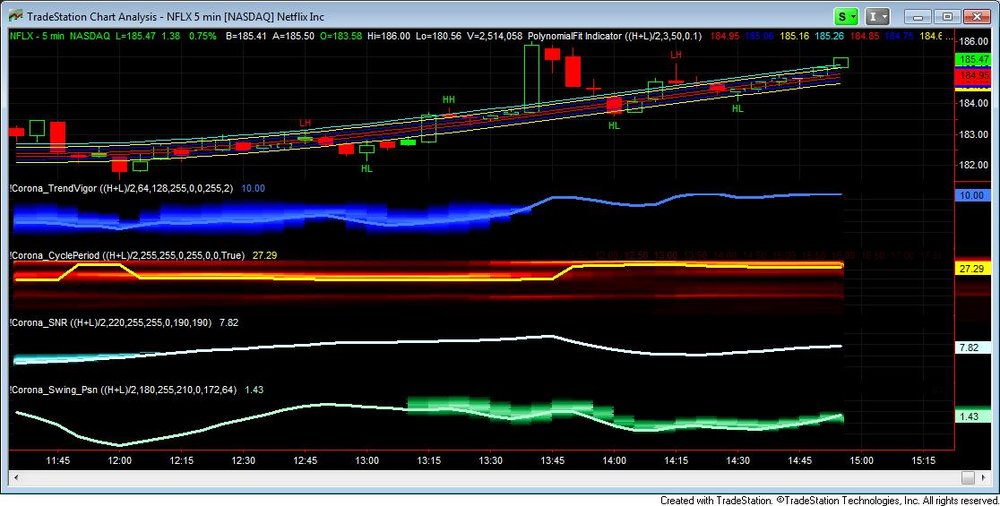
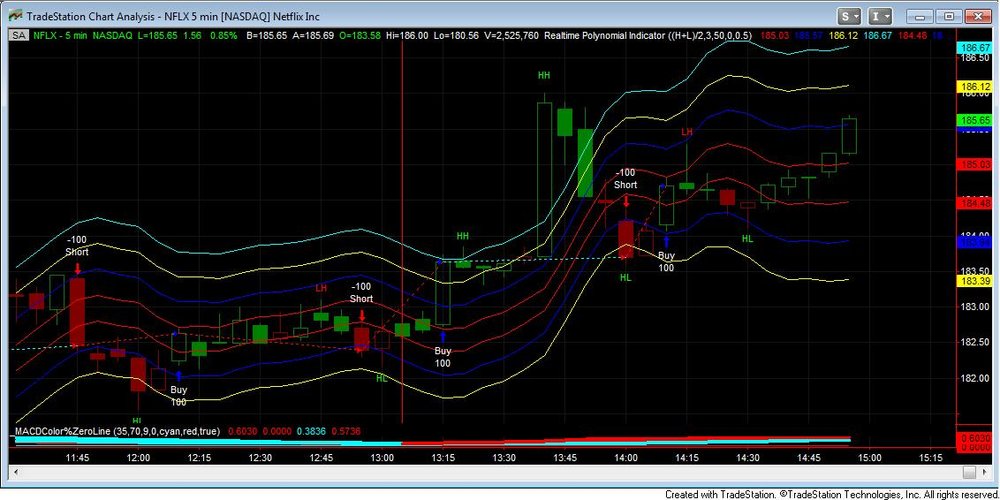
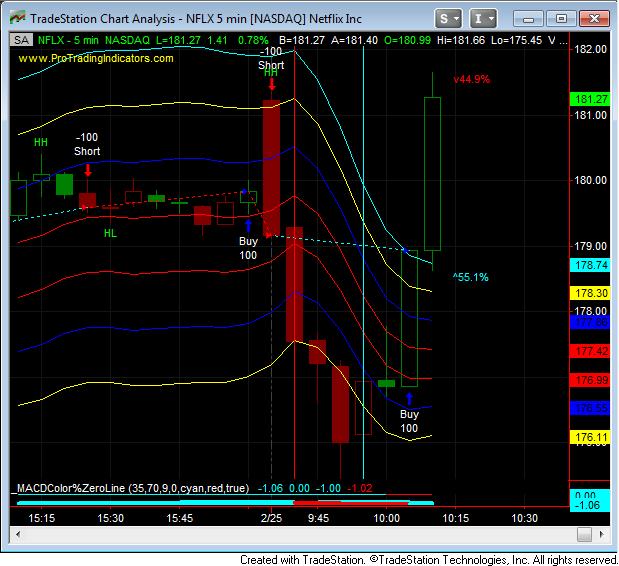
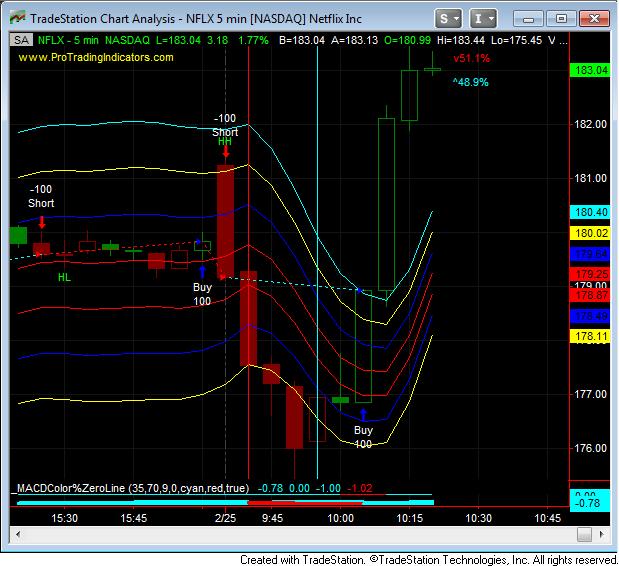
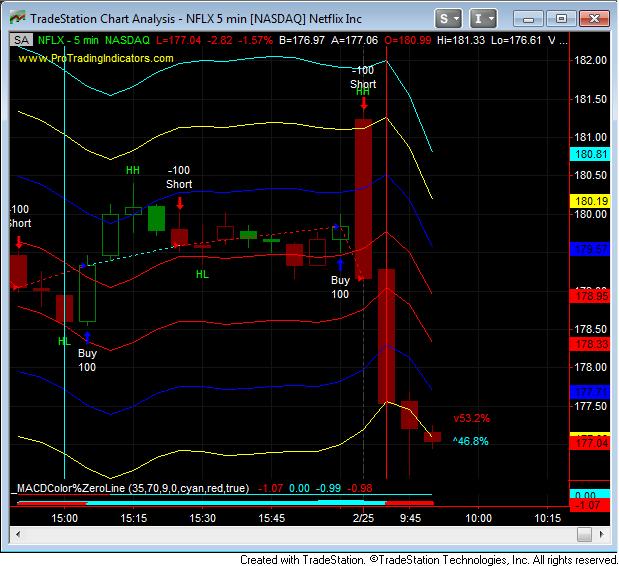
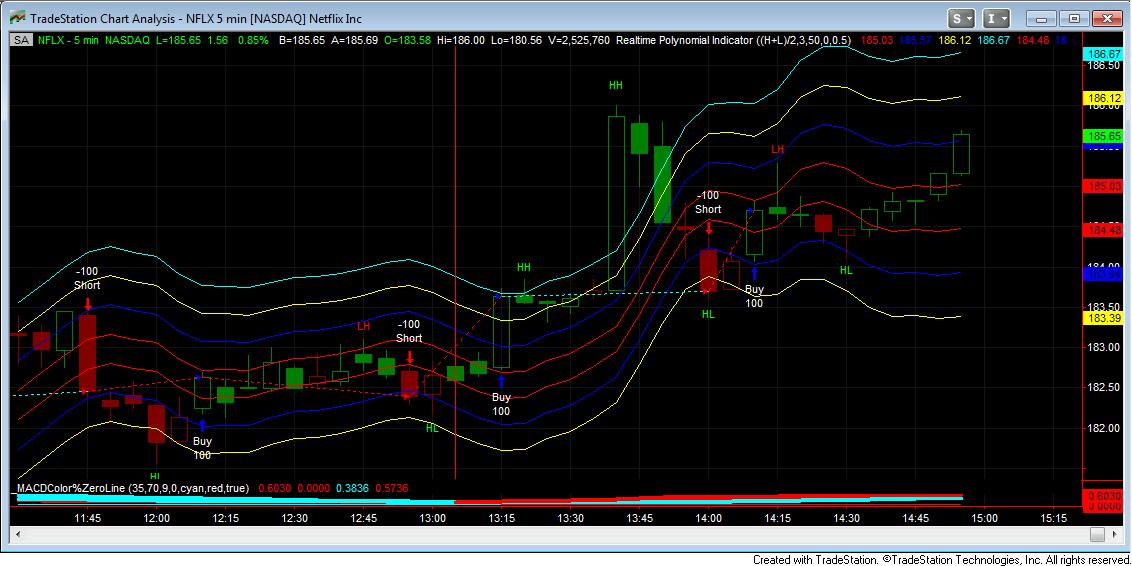
Nice example of PRV_Volume catching a natural breakout. All green and not a touch of the shorts coming. Second we have PRV Volume showing a possible short coming
-
The first chart attached below shows a stream of orders sitting overhead. These orders are placed above the market at price levels where they will never be likely to interact with the bid. They don't serve any obvious function in the market.What is significant is that the orders streams manifest as geometric patterns that become apparent in sub-second timeframes. Sometimes these patterns evolve on a price axis, sometimes on an ordersize axis (ie at a constant price), and sometimes combine both (order size diminishing as the last traded price is approached, say). See the second attachment.
What possible purpose could such orders serve?
One possibility is that they allow the producer to introduce apparently random noise into the market with the intention of confusing other market participants. But because the producer knows the underlying algorithm generating the orders, this firm can then cancel out the noise from their own data.
Many HFTs are, we're told, well versed in procedures for cancelling out noise to produce an accurate estimate of a system's underlying state (many of their developers coming from backgrounds in speech recognition and encryption) - but what could be easier than cancelling out noise when one is adding that noise in the first place, and it is governed by a simple formula?
Maybe you never look at the Matrix or DOM more than three or so tiers away from the last traded price, so how could this affect you?
Because other market participants do, and then they act by executing orders, and also by cancelling them. So the next time you're about to act on any kind of information derived from the order flow of other traders, you might wish to consider whether these traders are themselves acting under a misapprehension induced by the pretty patterns an HFT is drawing 30 points overhead . . .
BlueHorseshoe
Hello BlueHorseshoe!,can you post those indicators on post 1 & 3? Tryen to track the enemy.
-
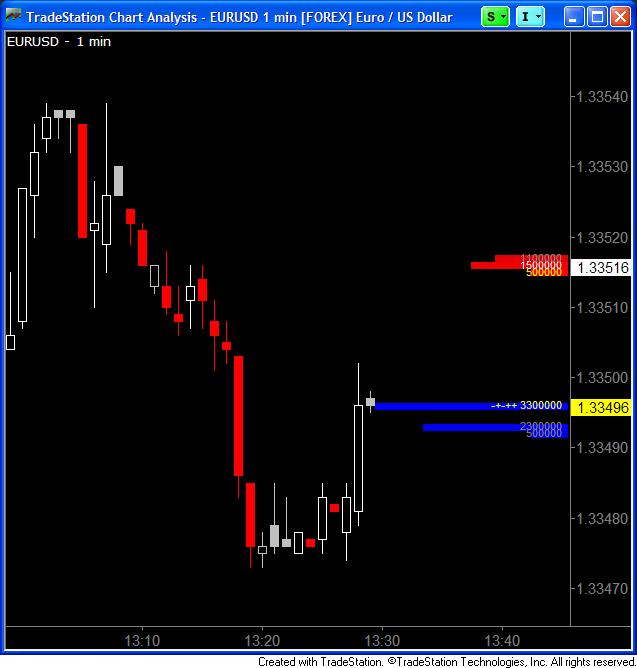
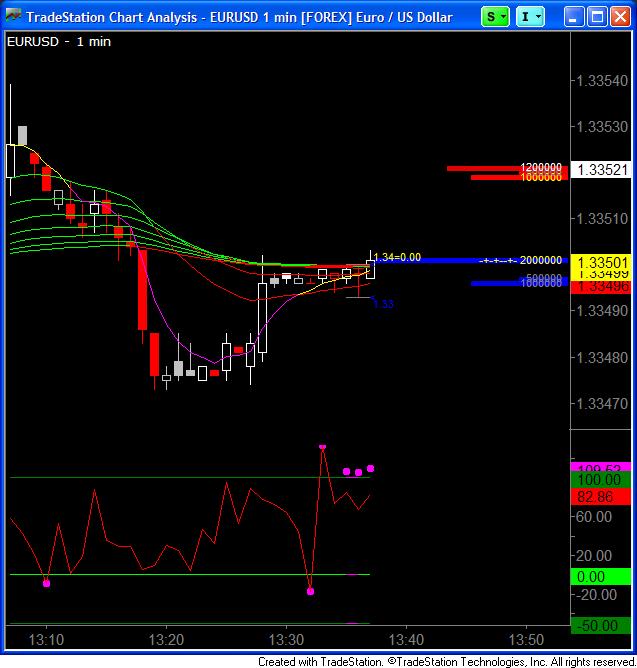
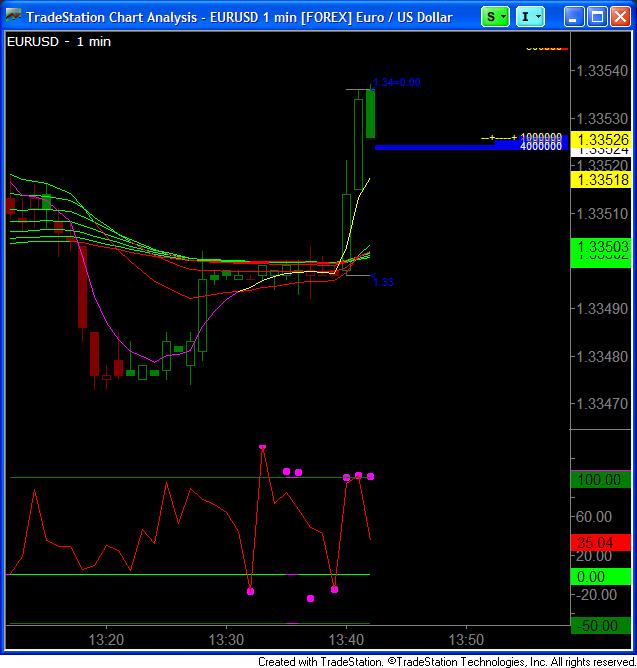
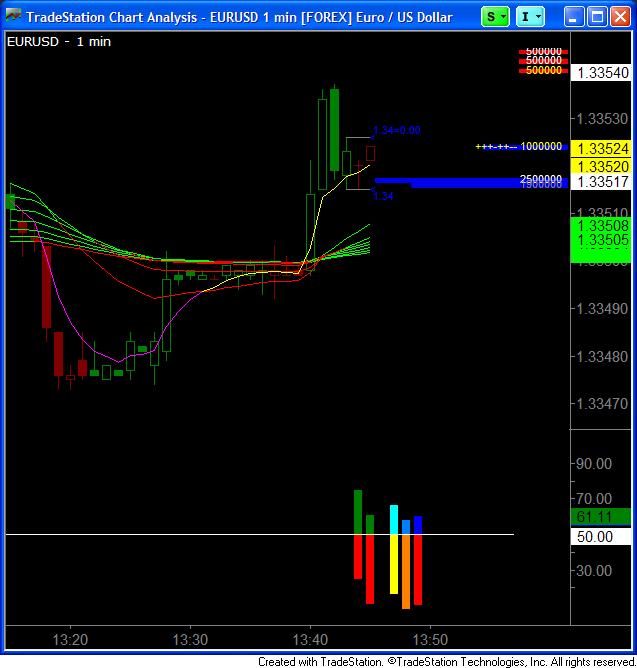
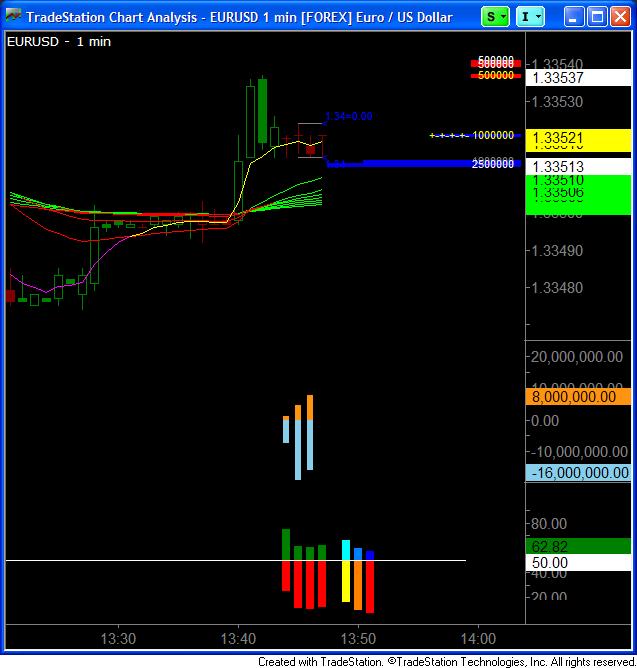
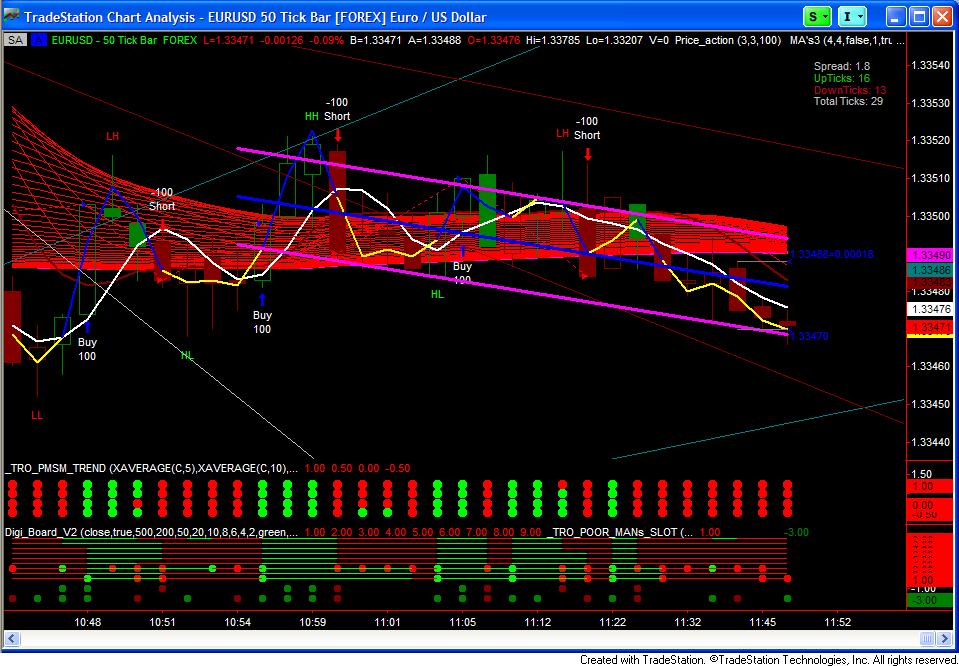
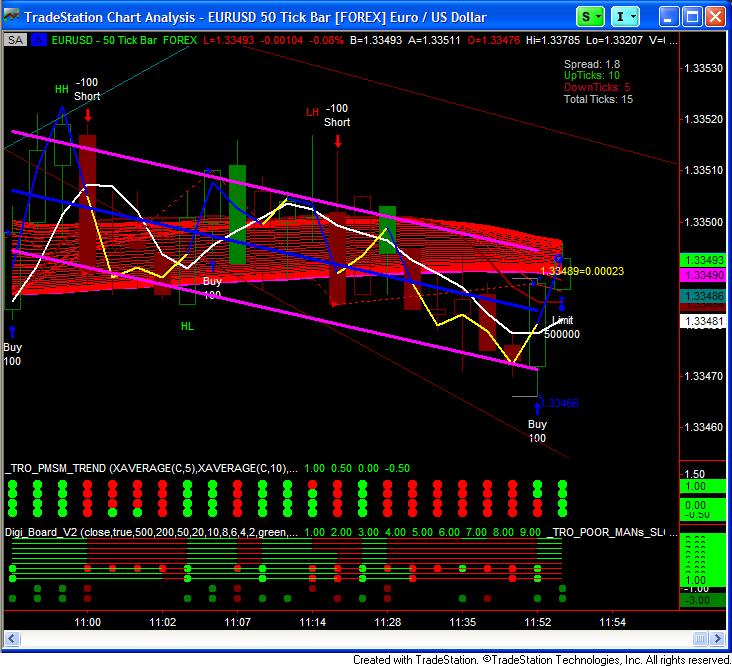
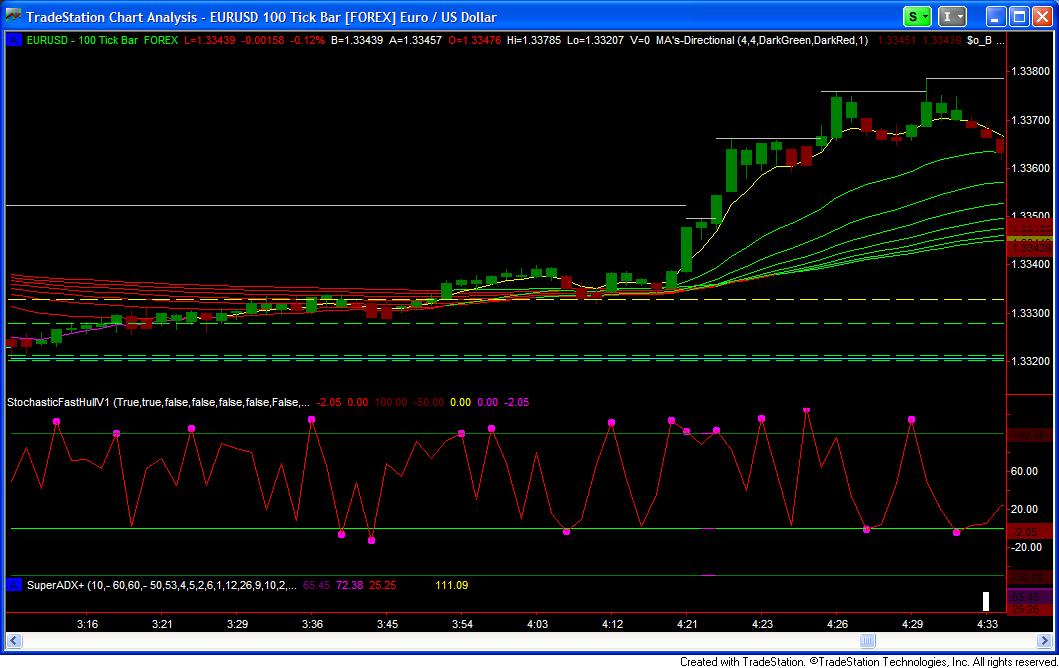
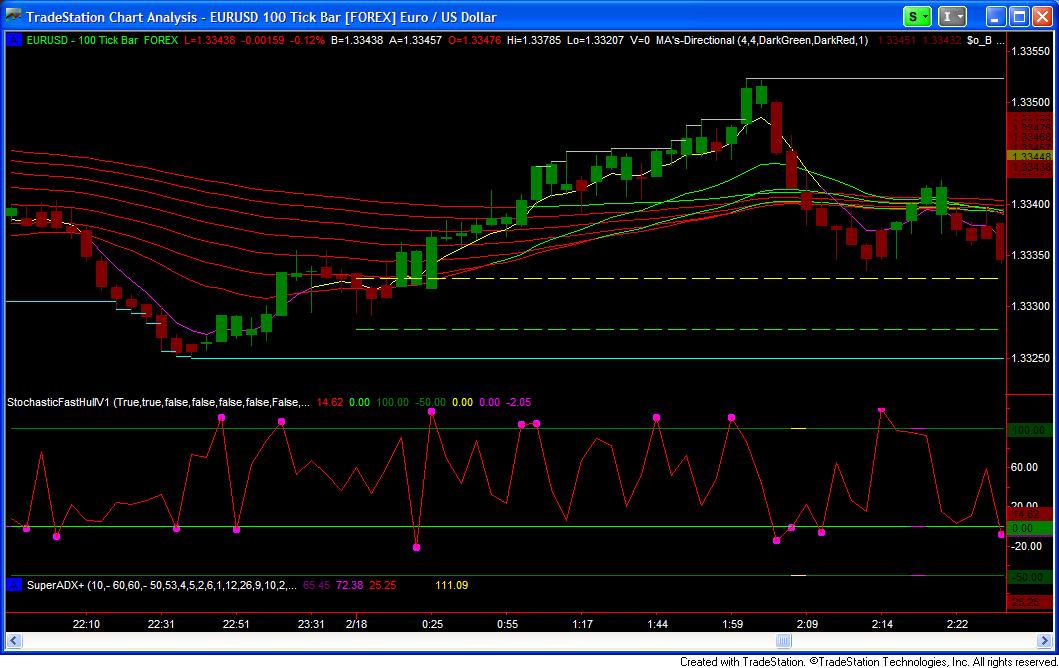
I want that indicator! Here is a few level 2 Tradestation indicators. Pics are on the EURUSD minus time & sales. One version on the right and two below.
-
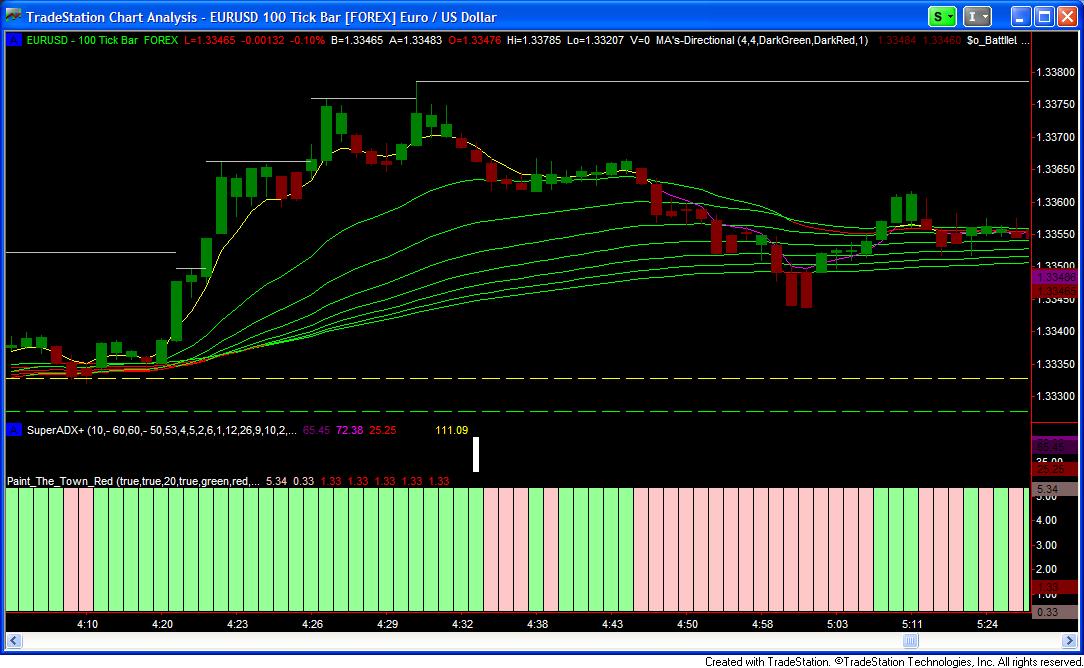
Nice Indicator Tams! Been using this for awhile.
-
Nice indicator Tams!,I added an alert! I'm using it as an analysis technique below my chart. It's just another way until Tradestation comes up with better gradient backrounds.Thank you Tams!
Paint_The_Town_Red_With_Alert.txt


-
I too have been trading with Fantail VMA3 and honestly I like it very much.I'm wondering is someone can add a color change function based on the slope of the ma?
Kind of like the slope direction line. If there's a positive slope it'll be one color and when slope changes to negative it changes color.
thanks
Walter and Blueray must be on vacation spending all their earnings! I got something here and all you need is an alert! Walter's and Blueray's are still the best but this can be added next to them. Thanks to everyone else who helped them along the way with this VMAR Ribbon.
-
Kool stuff eastate1997! You got me hullen now!
-


Center of Gravity Bands
in Coding Forum
Posted
You can find one type of these bands here http://www.traderslaboratory.com/forums/trading-indicators/4606-sigma-bands-cqg-2.html#post175035