
Welcome to the new Traders Laboratory! Please bear with us as we finish the migration over the next few days. If you find any issues, want to leave feedback, get in touch with us, or offer suggestions please post to the Support forum here.


phantom
-
Content Count
286 -
Joined
-
Last visited
-
Days Won
2
Posts posted by phantom
-
-
Let me guess....that "juicier" way is the Keltner/BB squeeze...?Nice guess Flex. But more important, its the price action inside the squeeze...
-
What markets do you suggest?Have you read my thread? I even show charts of the markets I trade along with actual trading examples.
Enjoy!
Luv,
Phantom
-
Back on topic, a straightforward way of using BB's. Indeed the bands are at SD's from the average. Do you use default settings (not that it is that big of a deal)? Do you only go in one direction (in the direction of trend or momentum or something else)?
I ALWAYS use a 20 period sma (I prefer it to ema) and a 2 SD channel.
I will take a buy signal coming from the bottom of the band in a descending market. Heck, most of the time natural gas (one of my favorite markets to trade) is too hard to distinguish whether the weekly trend is up or down so I depend on the info that the bands and price rejection bars are telling me.
Hope this helps.
Luv,
Phantom
-
Okay, back to business.
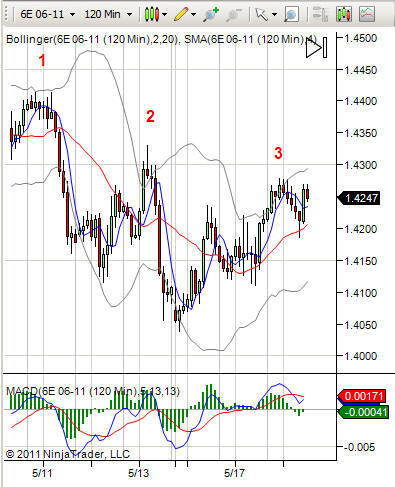
Today I would like to discuss how I use Bollinger Bands to tip me off as to when I can expect a consolidation, and therefore a subsequent breakout and trading opportunity.
Today's chart is a 120 minute euro chart with 3 numbers atop the price action. Notice how the market traded up to these three zones and then consolidated. These zones are located roughly at the top of the Bollinger Bands! When price approaches the top band in a downward moving market, I go on "alert status" to wait out the pending consolidation breakout with a downward bias.
The same thing applies at the bottom of the band. I wait for the bottoming consolidation pattern with a definite upward breakout bias (isn't this what standard deviation bands are all about?) and trade the breakout > price rejection methodology already explained earlier in this thread.
Does it work 100% of the time? Of course not, but its been pretty good to me so far.
Luv,
Phantom
-
I've never really been someone who spent much time in forums in the past... fact is that this is the first traders' website I've ever become involved with.
My background is in nuclear engineering but I've been day trading for a living since 1999.
I browse around the various topics and see a whole lot of information being passed that, at least to me, and I'm not the biggest rock on the planet, is very difficult to assimilate.
I devoted some of my time to this website and to you fellow traders because after breaking every trading rule in the bag MULTIPLE TIMES I had to create trading methods that were so easy that even a lazy, detached, bored, etc,, etc. guy like me could make money.
Please don't be fooled by the simplicity of my approach to trading the futures markets. The simplicity in my methods is paramount to my own ability to make big money, week in, week out. I've got 5 mouths to feed and not much patience for a losing trading program.
My hope is that at least some of you traders can relate...
Luv,
Phantom
-
What I would like to see posted in this thread (and I'll go way out on a limb and assume others would also like to see) is an actual trade, annotated in English showing how consistent trading decisions could be made with volume as the "indicator" and without the use of calculus...
Is this really asking too much?
Luv,
Phantom
-
And there they are...the true intentions! Why not being honest from the beginning? All you had to say was...."Hello, I am Phantom and I am offering a paid coaching service for beginning traders. This is wat you will learn.........(and you make a reliable case of all information nuggets you're selling)".Clear and honest...
How's this for clarity and honesty: my "coaching program" is unfolding right before your eyes, and its free of charge!
Pretty good deal, huh?
Luv,
Phantom
P.S. I do actually intend on getting back on subject soon. Sometimes a little housekeeping is necessary when running a project of this magnitude...
-
Has anybody actually made any money off the info posted here???
Just curious...
Luv,
Phantom
-
Dearest Flex, Mighty Mouse, and anyone else who only visits my thread only to look for inconsistencies and spread quasi-malicious comments,
My posts are fully intended to be didactic in nature.
If, for whatever reason, my posts offend you, you are all certainly invited to refrain from coming here. I can tell by the sheer numbers of visits that some of the folks who frequent my thread are actually interested in learning something.
I just hope that the folks who are well intended are not put off by your comments because I intend to continue teaching in spite of all your off-color comments.
Furthermore, I will teach on indicators when I am ready, and refuse to be pushed around by the few of you who don't have the patience to wait, and don't know a good thing when you have it right in your hands.
Now go do something constructive with your time and leave us alone if you can't behave yourselves...
Phantom
-
Well assuming price is what we are actually interested in watching it through indcators is akin to watching a movie through time lapse photography that transforms the image as well
I, for one, couldn't care less about price...I'm only concerned with price direction, volatility and liquidity.
The indicators I use serve the function of amplifying price bar subtleties, when they exist, so I can more easily decide whether or not a market is doing what I want it to do prior to my entry. I don't necessarily use the indicators on every trade, but they are there for when I consult them.
Hope that clarifies things. If indicators don't work for you, so be it. I never said I was a "purist."
Luv,
Phantom
-
Au contraire you are not welcome here if you want to scam.If I ever intend on selling anything, I'll be sure to exclude you from the offer...that way, you won't feel scammed.
-
My thoughts too (particularly on the 'squigglies') . One doesn't need a BB to see price tightening up. One Doesn't need an MA to detect trend or a reversion to the mean. One doesn't need a MACD to see a new low is on less momentum to the last low.One also doesn't need color to watch a movie (as opposed to b&w) but it sure makes the movie more enjoyable...
Luv,
Phantom
-
Hi Brent,
My best advice to you is this:
1. Read my thread "What Really Works for Technical Traders" in the TA forum. In that thread I discuss a trading method which works very well in the euro, natural gas, soybeans,...
2. Quit trading the ES. Way too choppy and spends too much time testing and too little time trending. Tough market to figure out (I traded it full time for 2 years, over 10 years ago, and even though I made money, I wised up and moved to other markets that are MUCH more lucrative on a regular basis. (How about getting 8:1 on your risk capital week in, week out?)
I cannot guarantee your success but I can surely point you in the right direction...
Luv,
Phantom
-
I do have a few things to say about technical indicators when the timing is right, but this thread is NOT a forum to display all your favorite indicators, so please do that somewhere else. I'm trying to develop your sense of price action primarily, and I don't want to confuse readers of this thread with "the latest, greatest..."
'ppreciate it.
Luv,
Phantom
-
Phantom described his 'hammer trade setup' as the safest bet you can make. I am a '100% technical analysis' trader and one rule I have is to avoid betting. When I make a trade...[/img]
My friend, understand that I said bet, not uninformed gamble. Every single trade I make is a bet in the strictest sense but I NEVER make an uninformed gamble.
I think that you and I are on the same page here, just semantics...
Luv, Phantom
-
What I struggle with, is why you refer to Bolly Bands, 20 ema, MACD, Hammers etc,
when it is obvious that you can read price behaviour so clearly.
My friend, All this "stuff" just acts like guard rails on a highway; these particular indicators have very special uses which I will most likely touch on at a later date.
Luv,
Phantom
-
Here we go again!
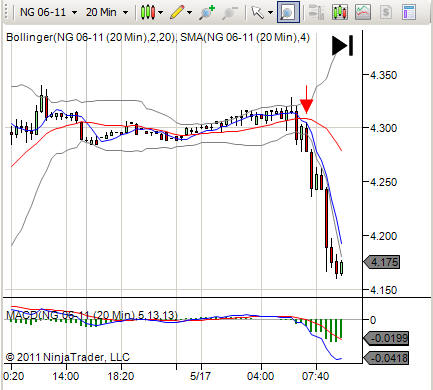
Let's take a look at this morning's natural gas market.
The bar at 6 am tests the high from yesterday afternoon and forms a hammer. The market then traverses the entire channel range in a single bar and closes near the low. The next bar tests the 20 period moving average. The bar signaled by the red arrow breaks above the test bar high and reverses all the way to the low, signifying PRICE REJECTION (my favorite two words), closing on the low. At 7 am sharp the market plummets...
Anyone else make any money on this breakout?
Start tracking some of these setups and at the very least paper trade them!
(Your bank account will love you for it).
Luv,
Phantom
-
There's always someone that wants to stir the pot. I hope you won't be dissuaded from contributing to this site. Rational and logical strategies are always appreciated. And this talk about a scam is a bunch of crap. I didn't see anywhere, where you asked for money. This guy needs to go pee in somebody else's cereal. Thank you for taking the time to contribute.You, and guys like you, are always welcome.
Luv,
Phantom
-
Jesse Livermore once said "It's easier to make a million dollars when you know how to trade than it is to make a hundred dollars when you don't."
So here's my question:
How do ya know you're "trading well" if you're not making any money?
Just curious...
Luv,
Phantom
-
for a daytrader, a trend lasts less than a day.I like to think that most "swings" are just little multi-day "trends"
I day trade the currency swings by getting in and out at the beginning of a new swing and then reentering after the culmination of the first multi-hour consolidation sometime after the 5 pm Chicago opening (the next day, technically speaking) and ride the continuation to the next consolidation zone. Think of it as "surfing two waves off the same storm" while never carrying risk through a market close.
Luv,
Phantom
-
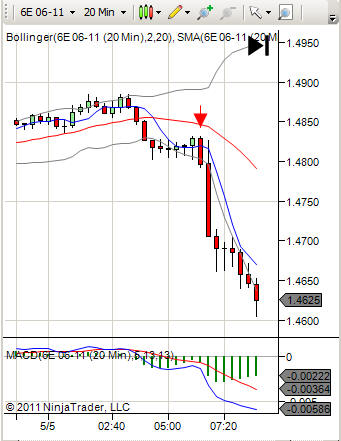
Using this chart of yet another euro breakout, allow me to instruct you on another form of price rejection, the false breakout-reversal.
Pay strict attention to the price action around the red arrow. Following a break below the 20 period moving average at around the 3:40 mark, the market moved into a sideways channel consolidation. The market moved up to a close near the high end of the channel range after peeking above the prior range high (the green bar just prior to the red down bar signified by the red arrow). The red bar moved all the way across the range and closed below the entire channel range. Following a short test, ie the "rattail" portion of the subsequent bar, the market plummeted. I sold the break of the arrowed bar with my risk stop one tick above that same bar.
Let's take a closer look at the market dynamics behind this form of price rejection. Prior to the breakdown the market tested the range high and even broke above the high. But the key element here is that the market did not FOLLOW THROUGH (false breakout). Instead, it moved all the way in a single bar through the trading range with a close outside the range on the other side (reversal). In other words, the market rejected the attempt to breakout on the high side of the range and opted to breakout strongly through the low side of the range. If the market doesn't meander back into the range and stay there any longer than it had to to complete the test (rattail portion of next bar) I am short this market!
I call the red-arrowed bar a volatility breakout bar due to its relative length with respect to the other bars in this consolidation. Also note that the MACD turned down with this vol breakout bar, confirming market direction and momentum.
This is a case whereby a hammer wasn't used to enter the market, but was replaced by a volatility breakout bar. In either case, price rejection was the "signal" used to enter the market relatively safely. Once again, the driving force behind the huge follow-through was the breakout of the much larger range that preceded the small consolidation breakout, providing enough "potential energy" to convert to the kinetic move you see at the right of the breakout bar.
That's the lesson for the day. Now go locate these opportunities for yourself and make some money!
Luv,
Phantom
-
Ever had a position on and your electricity go off before you entered a hard stop?
This happened to me in a fast market once. It will never happen again.
Hard stops for day traders is the only way to go...
Luv,
Phantom
-
One thing you said Then price then retraced towards the consolidation zone and was rejected this is the key imho, leaning too heavily on specific patterns or candles ultimately will inhibit ones understanding of price action and the underlying supply and demand equation that causes the pattern/candle to manifest itself in the first placeYou are right on the money, BlowFish. UNDERSTANDING WHAT IS CAUSING THE PRICE ACTION TO OCCUR is paramount to trading effectively. I don't take any hammer the chart provides; its always contextual with regard to previous price action. This is exactly what makes this entry so strong: the market was range bound, it broke out, it tested, it failed the test with price rejection, it continued away from the consolidation zone.
Furthermore, depending on how much "potential energy" was built up and stored inside the consolidation range, these breakouts can give tremendous reward for every dollar risked. I'd rather be patient and attack these trades than fritter my capital away scalping 3 or 5 minute charts, but that's just me...
-

What Really Works for Technical Traders
in Technical Analysis
Posted
Don't get me started on trading memories...like the time the electricity went out in my home while I had just entered the bond market after the employment #'s were released and I didn't have a (protective) stop in the market yet...maybe I'll blog on that one...who knows?!