
Welcome to the new Traders Laboratory! Please bear with us as we finish the migration over the next few days. If you find any issues, want to leave feedback, get in touch with us, or offer suggestions please post to the Support forum here.


Corey
-
Content Count
111 -
Joined
-
Last visited
Posts posted by Corey
-
-
Quite the impassioned post.Is this a thinly veiled effort to defend a stealth vender mentor or a sincere attempt to help those who struggle to successfully trade the price/volume relationship?
-river
Neither I think it is a keenly assesment of thread participants so far.
-
this women get itlatest video on vol leads price
-
this women get it
I have been trading for the past fifteen years using many different indicators — you name it and I have probably traded it.
Triangles
Elliott Waves
MACDs
Moving Averages
Trend Identifiers
They were all part of my tool kit. There was only one HUGE issue. I would have numerous winning trades, only to be knocked backwards by a couple of losers. Trading was a constant uphill struggle — I would take three steps forward, two steps back.
Frustration was often my best friend!
Then a friend told me, look trading is simple — WE make it HARD. Traders have to learn to trade volume and price, not just the color of the indicator. Volume and price LEADS all other indicators.
WOW, if only it could be that easy!
I have discovered that trading really is that easy using 3 very simple steps:
Candlestick charting because it is easier on the eyes and traders can easily identify all the key price points without squinting.
Volume LEADS price, it really is that simple. However, most traders don’t understand where to analyze the volume. I analyze volume at two critical areas:
Support and Resistance area
Overbought and Oversold areas
...
-
Sorry to be a bit ot here but what is the significance of the thin break lines in some of the formation boxes in the attached TN chart ?Thanks, Steve
look closer, one of them is outside bar.
-
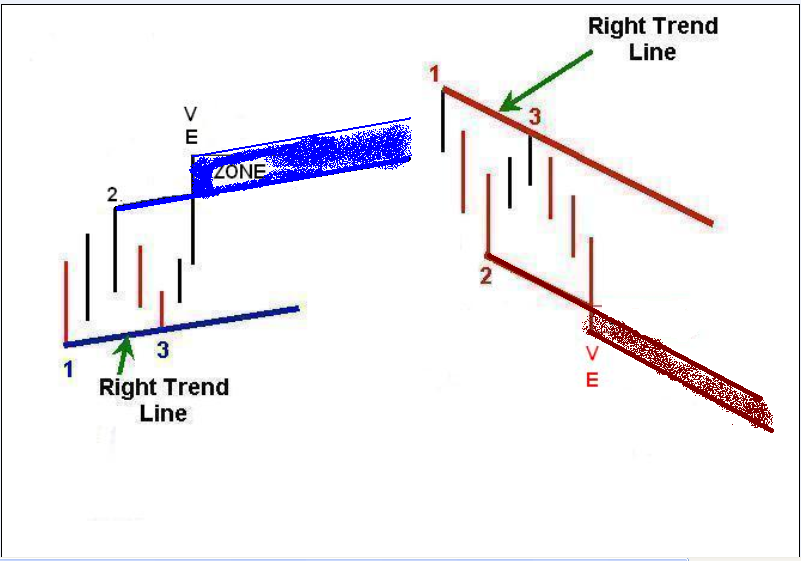
my VE zone...............
-
If you get a "Jack Hershey" search results page, it's what I intended to point to. If you don't, just go to the ET's home page, click the "search" button, then search for "Jack Hershey" 's posts.since it is a search result it will expire fast.
-
Yours works nicely. Going to upload my chart later tonight with it on my chart. The only weird thing is that it de gaps all historical bars...yes that is how it's supposed to work.
-
Hello MonkmanApplying it as an "indicator",
"NoGapChart"
try Corey's post # 3409.
Kind Regards
FilterTip
also try latest stepan7's work.
-
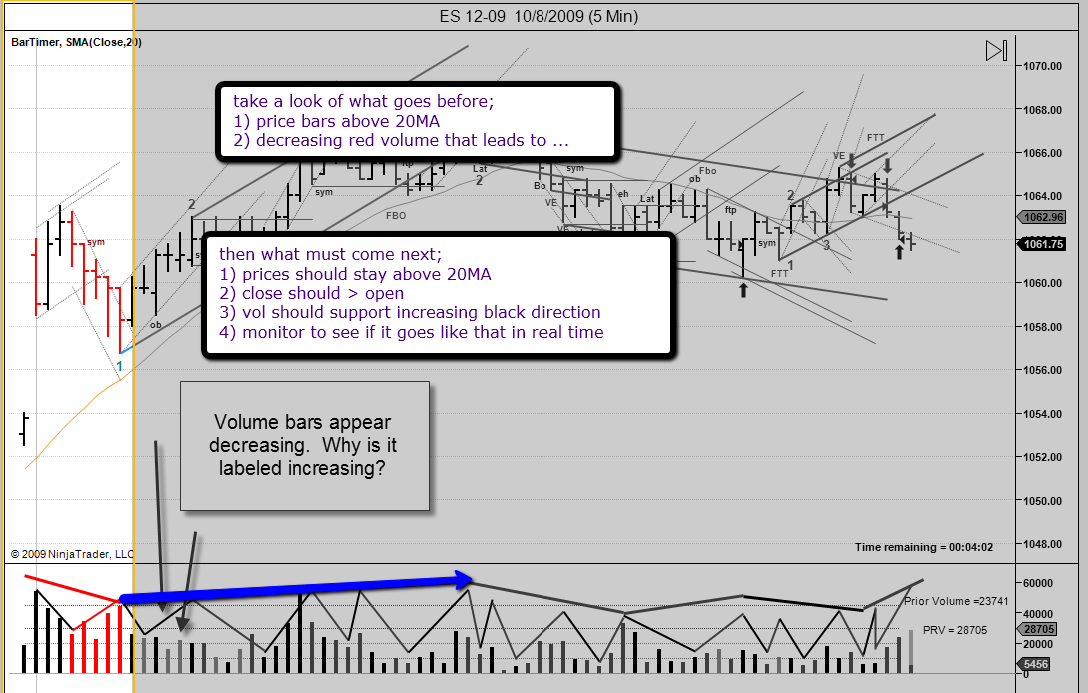
...So Why in Mr Black's chart does he use what he sees in the Price Pane to describe the volume? Am I missing something in this picture? The volume does not appear to reflect decreasing black, and increasing black.
See attached Chart
by the power of hindsight, here is my take

-
I've had a lot of success with this method. While I'm grateful to spyder for his insights and guidance, most of my success came through self-discovery,...this is only way imho.
Additionally, for many months now I've been mentoring a group of close friends, many of whom have left corporate employment and are now trading profitably full-time. So hang in there - IT CAN BE DONE!finally we have another trainer. :shocked:
-
Few observations... not trying to compete but just stating the obvious.1. What is the "specific" pattern? Steve, you mention "specific algo pattern". But you don't even describe a general pattern to any degree -- let alone a specific set of rules for identifying the pattern algorithmic-ally.
..
he already high-light it, price was maxed out at 2 sd.
-
channel trading videos in case you missed it (hope not)
[ame=http://www.youtube.com/watch?v=x_EJUcRjQZ8&feature=channel&list=UL]channel / trendline trading forex Nov 1st 2011 - YouTube[/ame]
-
Todays progress - this fractal channels and FTTs give a total other view to the chart than these LL-HL-HH-LH logic sequences. Really interesting.-swisstrader
ETluker also stopped posting after coding an auto channel. What happen to them? Did they get a mid-night phone call telling them to stop posting or else?
-
Have started to code the method in a full auto system - any thoughts, ...-swisstrader
sure, I wish you luck!................
-
...If allowed, I may consider offering any member of Traders Laboratory complete and unlimited access to my daily trading room with the understanding that no one will ever approach them at any time to try to sell them anything. ...
wait...Roger...wait lets talk about this! If you are just starting out this is not a bad offer.
-
I have attached a chart which shows Spyders toolset for TN and the other chart shows regular volume based on up/down colour coding based off the close. See the huge discrepancy. One is decreasing black the other is deceasing red.Would like to hear people's thoughts.
Thanks
based on this TN vol coloring is more advance than NT vol coloring.
-
Do you have his twitter address? I can't find it.you are confirmed.,,,,,
-
That is crazy.If this is true, it seems to make sense.
Back when Huddy mentioned he was getting his Seriese licenses and said he was setting up hedge fund and to email him for info....I did think it was odd and strange and out of the ordinary for live room owners....
If this is true, how is it confirmed?
just twitte him Google
-
Fractal JumpingI sometimes jump to a finer fractal unintentionally. Would like to hear from others and how they corrected it.
This tends to occur more often around fanning out of pt3. Looking back it is easy to see it but in real time this is not the case.
Thanks
get into habit of juggling more than 1 fractal and monitor to see which fractal it is following other than that I don't know what to tell you.
-
Two quick questions;2. What is a SFC?
Thanks
signal for change........................
-
Very much so.If I remember right, the TN toolset recalculates the pace lines based on the last 20 days, but I never learned the algorithm. I am pretty sure that the original pace lines were calculated off a statistical breakdown of bar volatility by volume and separated into categories, but I doubt that Trade Navigator is doing that on the fly. Still, it can't be as simple as moving averages with a modifier, unless the modifier is very complex, otherwise they would maintain proportional spacing.
If anyone can provide some insight into how pace levels are determined, that would be fantastic.
you can google anything for example google 'pace site:http://www.traderslaboratory.com' to find any mentions about pace on this site likewise for other site. Found a pace doc from other site
-
...I have guesstimated current pace lines, from Vienna's most recent chart:
46000
37000
29000
18150
8250
1200
...
numbers seem high compare with what coded in pv vol4.
Add(new Line(Color.Gold , 25000, "ExtraordinaryPace"));
Add(new Line(Color.DarkGreen, 12500, "FastPace"));
Add(new Line(Color.DarkGreen, 10000, "MediumPace"));
Add(new Line(Color.Blue , 6000, "SlowPace"));
Add(new Line(Color.Blue , 4500, "DryUp"));
Add(new Line(Color.Red , 2500, "VeryDryUp"));
-
Today's chart...
hth,
Vienna
interesting, it bounces at AB = CD
2_28_2012.thumb.jpg.6727d099bc9cff2379b9f1bfdac73eaf.jpg)
-
This morning was confusing in terms of what I thought I had...
Also my nogap on the 15 minute is again not working even aftr re-laod it..hmmm
not sure if you get latest one.
2_28_2012.jpg.eb949a9601a8e88cc1503ded971bbaa2.jpg)
The Price / Volume Relationship
in Technical Analysis
Posted
ninjatrader seminare 11/4/14 16:15 EST how volume will always leads price https://ninjatrader.omnovia.com/register/85841414776941