
Welcome to the new Traders Laboratory! Please bear with us as we finish the migration over the next few days. If you find any issues, want to leave feedback, get in touch with us, or offer suggestions please post to the Support forum here.


pbylina
-
Content Count
104 -
Joined
-
Last visited
Posts posted by pbylina
-
-
How To Use $TICKDownload 'How To Use $TICK' from MEGAUPLOAD
Download and unpack the zip file. Then double click on the fnv05032006hs.html file.
Can you repost this, the link doesnt work.

-
The "$TICK" is a data element that comes with Esignal charting...I would imagine that just about every professional level charting program has some version of the NYSE tick...Check with your data provider...this has nothing to do with the CME (NYSE stands for New York Stock Exchange)This is what MD said,
"There is no symbol for the NYSE Cumulative Tick because ZenFire does not provide data for Indices and Statistics. ZenFire is Futures Data Only."
-
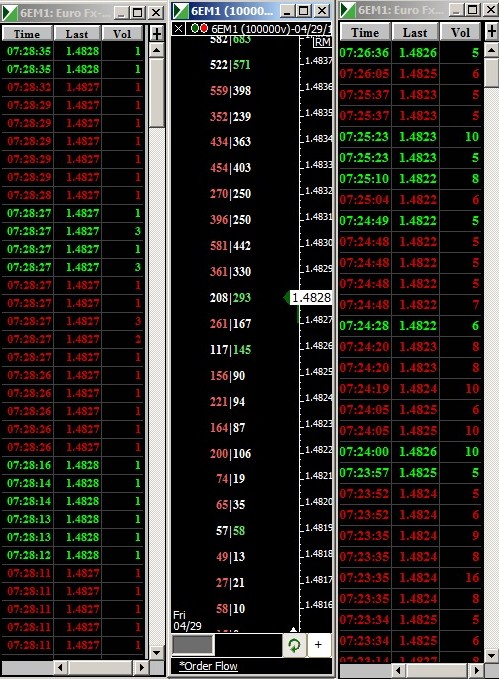
Thanks so much Steve for telling me about Time and Sales trading. Im having great results so far (even though I dont have $TICK yet). Heres my setup. On the left is T&S from 1 lot up. In the middle is the Bids | Asks at price(footprint). On the right is 10 lot and higher. Anyone care to share there setup?
-
Camstudio is good and its free..)
-
How do I get the NYSE "$TICK" ? I have a subscription with CME. Do I need a subscription with NYSE?
-
Okay well I don't have a l ot of time because I am trading the Globex this evening, First it is the "NYSE" TICK and it represents the number of stocks ticking up minus the number of stocks ticking down on the New York Stock Exchange. based on the readings, a trader can quickly see the intraday direction of the broad market as represented by stocks on the New York Stock Exchange. In addition, skilled traders use the tick as a way to get favorable entry on trades (and for so many other things)...Volume is what I use to confirm my entries off of the NYSE Tick....once I am in a trade I use the $VOLD and $ADD (Esignal volume data) to show me whether institutional traders are "with me" or "against me"...I also use these data points to show me when to exit.
I was trained to read the tape using these data elements years ago, and now I train other traders to do the same thing....and that technique is still as effective now as it was then...I know several ways to trade but if I had to choose...clearly this method gives me the best odds of consistent success.
Ok Since Im currently interested in Currencies, then tell me if I got the right idea:
The 6E(Euro) goes up if it is stronger then Dollar. So I would actually be looking for the $NYSE Tick to be moving opposite to the 6E? My reasoning behind this is more stocks are trading down which is bad for US, therefore good for Euro.
-
...I could see when buyers really stepped in and drove price higher. Then on the pull back (an entry point) buyers came in at the same level and pushed prices back up....I really like this statement.
-
Im trying to set up the T&S in NT. There are options for setting the background color based on: traded at ask, above ask, at bid and below bid.
My question is, are the trades that traded above the ask or below the bid considered more aggressive?(newbie question.)
-
Steve,
If you are interested in trading futures, in my opinion the best method is to "read the tape" which requires that you learn to monitor a "time & sales strip" as well as the NTSE tick and volume. The tick and volume are used to to support your trade decisions as you "read" the time & sales strip.Yea, Im interested in futures. What is "NTSE tick and volume"? Why is the Level 2/Dom not important(just asking)?
Finally, if you have MarketDelta you can (eventually) learn to read either their "footprint" charts or their multi-line "break" charts...and again it takes time to learn and you will need to find someone knowledgeable to show you how it works.I will be using MarketDelta. What are "break charts"? Would you consider the 'footprints' better than "Time and Sales"?
Here's what I can tell you about this...first, it is difficult but certainly not impossible, and you will need to spend considerable time getting accustomed to seeing the data displayed, learning a system that works, and then practicing until you acquire some proficiency...Second, even when you have "learned" to use these tools you still have to have a framework on which to base your trading decisions. In other words, tape reading is a tool that you use to try to obtain favorable entry, but by itself it isn't a viable system (just my opinion).Ok, around key levels of Volume Profile, Pivots, etc.
I know these methods and after long years of trial and error I would suggest your best odds of success lie with learning to read the time & sales strip (also called "reading the tape")Ok I will try.
Heres a cool interview of a guy who uses Order Flow:
[ame=http://www.youtube.com/watch?v=lK58oT5GTGE&p=25937227F42F996A&wl_token=NQVnBvxVxO7jGpynnOje7czkE_p8MTMwMzkyOTU4MUAxMzAzODQzMTgx&wl_id=lK58oT5GTGE]YouTube - Boris Schlossberg Millionaire Traders[/ame]
-
I learnt how to read the footprint from http://www.ioamt.com. Some other helpful sites are Discovery Trading Group & L2ST - www.inthetradingzone.com - L2ST - www.inthetradingzone.com.They all use a footprint chart.
Market profile sites:
http://www.cmegroup.com/education/interactive/marketprofile/handbook.pdf
The footprint is most productive at key price levels. I use bar charts and point & figure charts, but the footprint is my final entry tool. Keep in mind that reading order flow is an art form that takes time to master. I do know someone who used a small time frame chart to learn the patters, but why bother with that when you have good teachers out there.
Also, take everything you read on the trading forums with a grain of salt, including this post.
dVL
Thanks. Whats a point & figure chart?(I think I heard a lot of people use it with order flow..)
Yes, I assume it would take a lot of practice/time to be really good. Like learning a musical instrument(which is an art also).
Any opinions about Constant Volume Bars?
-
How do people learn to read bid|ask footprints/orderflow? Do they only look at footprints at key levels or can you trade with just footprints without looking at candlesticks/barcharts by just 'going with the flow'? Is the best way to learn by just staring at it for hours each day?
Any advice appreciated. Thanks.
-Paul
-
My Open E Cry has an accurate Footprint chart, only problem is that their Market Delta chart is like 5 years old.Hope this Sierra Chart helps.
Thanks DaVinciLite. Unforntunatly I dont have historical Bid/ask data. Mine starts from when I turn on the program...
If I got IQFeed would I have the historical bid/ask data?
-
Hate to mention this, but how much do you pay for your data.Add that to the 90% of Retailers who never learned the Trading Industry and therefore fizzle out before they really start, and you can see that we all must have decent raw data if we are to outwit the odds.
Zenfire is free. Maybe thats why.
-
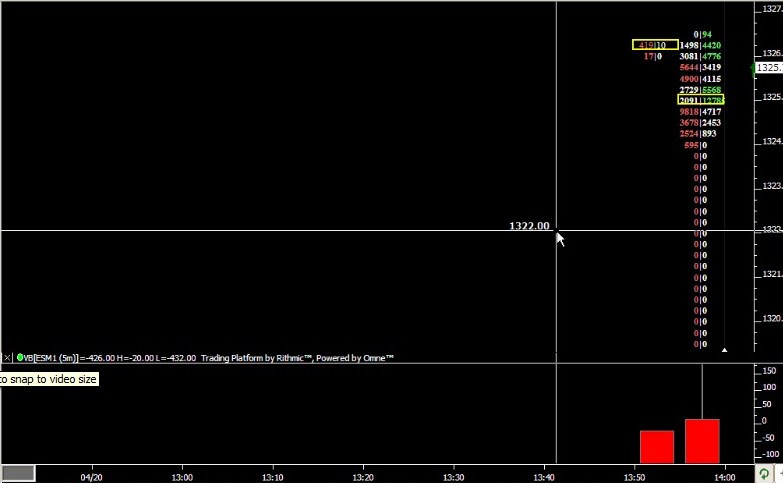
Here is a 5 min footprintI cant compare it cause I dont have any previous footprints...Is this normal? Also if you look at the bid/ask there is about 20, 0|0 bid/ask? no one traded there or is this also a zenfire problem?
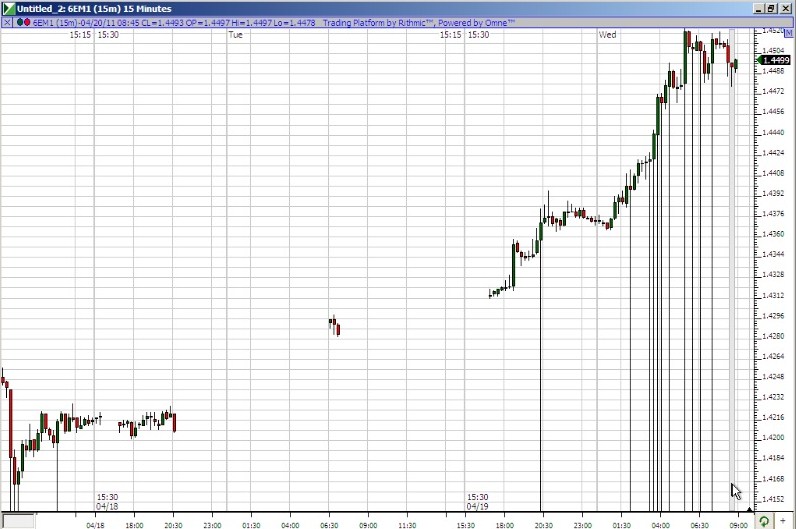
In the second picture there is a gap in the middle of the chart...I dont think its normal? and the candle wicks are going all the way down to bottom of chart. wtf...
-
I have heard through the grape vine that most of the broker feeds do not have accurate bid/ask data real time, including Zenfire. I included a screen shot of my Sierra Chart with Iqfeed on a point and figure 6 tick swing. Keep in mind that Sierra Chart number bars are NOT 100% accurate, but it is close enough for me.Discovery Trading Group has screen shots of Iqfeed with market delta on a point and figure chart.
If you want accurate bid/ask data you are going to have to pay up for it: Iqfeed, Esignal, CQG…
Thanks. I was hoping you wouldnt say that. O well. Iqfeed it is.
-
Hey guys. I currently have MD with zenfire and want to know if the footprint bid asks are accurate. Can someone post a 5min footprint of theirs for 6E or ES? It would be nice to compare another zenfire and a iqfeed feed. Thanks.
-
I'm not a cash market trader, but I'm wondering if your statement above involves fractional pips, the fifth decimal place that some brokers quote prices in. As many have said up-thread, this is another one of the "tricks" bucket shops use (fractional pips) to offset the illusion of no commissions. It's all in the marketing
No regular pips. 4th decimal in Euro is a pip. And 5th is 0.x/pip. Now that I think of it, I think the closing out early before SL is hit is mostly a Mt4 thing...
-
All of the following is my opinion from my experience. I've used these studies to trade the 6E for many years, and I believe you're setting yourself up for a lot of frustrations for a variety of reasons. It seems like a good idea but as Blowfish stated, "They (spot and futures) are highly correlated" but not exactly. His (Blowfish's) posts hold many of the concerns that will (again, imo) lead to frustration, and there is more!I also chart a vwap on the cash market using tick data, prices respond well to these levels, however your statement, "I want to risk 10 to make 30 or more.." is about the wiggle room needed for the correlation, mainly the 10 point risk side. Another issue is your data feed, IB (Interactive Brokers) for instance processes their data in "snap shots" or "packets" .... Say a bar closes and gives you a sell signal, while the next bar is building and more "packets" are processed as they arrive (to your computer) that previous signal can "disappear" entirely or change significantly. I've found all the volume studies wiggle/change/move when using IB data, this isn't a major issue for most traders but it was for me when trying to trade with the precision offered by the vwap bands and maintaining tight stops (10 pts). Also as BF (Blowfish) stated, "Not only that they are setting the price that you bet on (as there is no centralized exchange and lax reporting requirements there is a degree of flexibility in the price they set)" this "degree of flexibility" will raise havoc with your (a) 10 point stop. Furthermore, when watching price action or "reading the tape" at significant price levels it's often hard to differentiate between the "tail and the dog." Another fact is these studies e.g. vwap are cpu intensive and can bring a run-of-the-mill processor to it's knees (depending on market volatility and the number of charts).
The studies you describe are fluid and next to (if not) impossible to code (on most retail platforms), this leaves traders with a lot of discretionary decisions to make during the most volatile (profitable) times in the market, knowing your market can be very helpful. These studies on stagnant EOD charts is absolutely nothing like what you'll experience during the heat of battle. To end on a positive note, I'll make two suggestions. Chart the futures with your studies and trade the mini futures contract. Or, if you must follow the path you described, expand your stops at least x2 as you begin to collect R/R data. Stops are imo market/movement specific and must be adjusted according to conditions throughout the day. Good luck
Thanks. I think im gonna try using the futures charts with spot only because I have the $250 left on the account and its not that much. If I turn it into $2000, I'll open a futures account. If I end up losing it, then I'll open a futures account. Either way I'll go to futures.
-
I think about $5 round trip per contract is average which is real cheap I think. I actually pay $4.80 but that is close enough. One tick is $12.50 profit/loss so you can make it back with just 1 pip/tick.Wow $5 is like only 0.4 pip/tick! When trading spot I had to add an extra 5 pips to my stop loss. Why? Because when price got within 5 pips of the actual stop it freakin closes you out. B.S. Is it like that in Futures? Is it possible to have a 5 tick SL?
-
Ok. I understand now. Was still a little forex brainwashed. So instead of paying a spread you pay a commision? How much on average is it?
-
Ahh right, yes of course should have thought of that. What sort of size swings are you going for? With the 'bookie' type accounts bigger is better as it minimises the shenanigans with spreads and prices.Swing size? I dont know, I want to risk 10 to make 30 or more...'Bookie'? Whats that.
-
I want to use Volume Market Profile, Vwap, Footprint charts and delta Indicator...Basically they all have something in common: Volume....lol. In Spot Fx I never had this kind of stuff. Well see how it goes... Its only a $250 FX account...
-
Do you think I could trade Euro/Usd Spot Fx by using Euro 6E Future chart/data feed? They move in sync and have proportional swings right?
-
Is this right...Euro Future is $12.50/contract? If I only traded 1 contract with a 10 tick stop loss the risk is = 1 x $12.50 x 10 = $125?
So 2 contracts would be: 2 x $12.50 x 10=$ 250 risk?
Order Flow Advice
in Market Profile
Posted
It makes sense. I was following T&S Wednesday after 5:00pm. Not much usually goes on then, compared to morning trading. But I liked it because like you said, "you can keep track easier of who is doing what". I managed to "predict" some nice moves seconds before they happened.(not to brag or anything...):missy:
I will definetly now check out Ags, softs and meats. Thanks for the advice!