
Welcome to the new Traders Laboratory! Please bear with us as we finish the migration over the next few days. If you find any issues, want to leave feedback, get in touch with us, or offer suggestions please post to the Support forum here.


peterjerome
-
Content Count
89 -
Joined
-
Last visited
Posts posted by peterjerome
-
-
What are your thoughts? If you use the closing of a bar as a part of your trading, or if you feel that a bar's closing price is important, can you explain and convince me (or others)?
josh, i can explain what i do...i'm not interested in convincing anyone of my being right.
i use 10min bars to enter and exit. nothing complicated.
when i am looking to exit i'll wait until bar close...often times price is already below my exit, but recovers on close keeping me in a trade that turns profitable.
i gotta believe if i'm waiting on bar close, there may be significant number of traders doing the same thing, no?
peter
-
...At a push I might even go as far as to argue that an experienced trader is able to trade without an edge
zupcon,
no edge...like a coin flip...50/50?
need high win-probability, greater than 3-1...
good reward / risk analysis solves that issue...
PnF charts are excellent for R/R analysis...
i guess i agree with you zupcon....(well said)
however...i'll still look for those little 'nuances' that give me a leg up.
peter.
-
Hi, I use point and figure chartsbarostni,
tell a little about how you use PnF.
how do you use PnF in your daily routine?
e.g. searching for breakout candidates, determine supply/demand, market direction.(bullish or bearish trends. do you use the bullish percent PnF charts (free) on stockcharts.com to determine sector rotation?
peter.
-
I highly recommend du Plessis' "The Definitive Guide to Point and Figure". There is a chapter that discuss about backtesting on Point and Figure. It breaksdown P&F patterns to the basic building blocks.agree sneo.
Jeremy takes supply/demand to the next level. he is a pioneer in use of moving averages & bollinger bands on PnF charts,,,a 'must have' for the serious PnF trader.
peter.
-
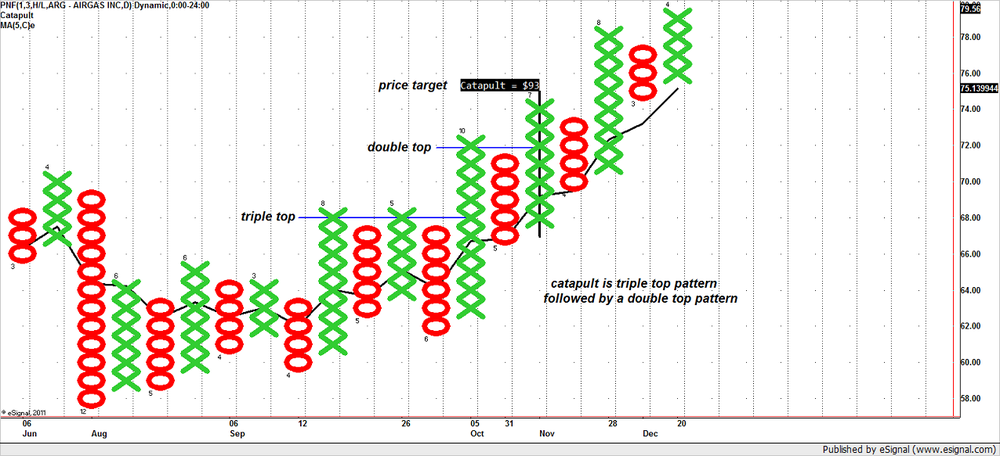
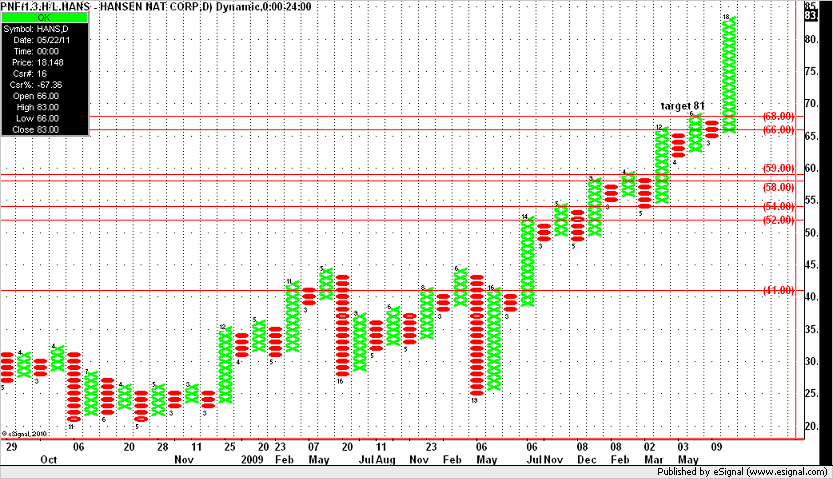
Here's EFS code for PnF charts that will locate the 'Catapult' ,a high probability pattern.
also calculates target price. see attached chart for example of pattern.
read dorseys' book, mentioned earlier, for info on many patterns.
peter
/*Pedro's PnF catapult pattern. triple top break followed by double top break*/
function preMain() {
setStudyTitle("Catapult");
setPriceStudy(true);
}
var iCntr = 0;
var vText = "Catapult = $";
var vSound = "bullet";
var vTarget = 0;
var nState = null;
function main() {
nState = getBarState();
if(nState == BARSTATE_NEWBAR) {
iCntr += 1;
// Catapult Pattern
if(close() > open()
&& high() > high(-1)
&& high(-2) >= high(-4)
&& high(-4) == high(-6)) {
vTarget = (high(-2) - low(-2)+1) *3 + low(-2);
drawTextRelative(0, high() +1, vText + vTarget, Color.white, Color.black, Text.BOTTOM | Text.RIGHT, "Consolas", 12,"Catapult"+iCntr);
drawLineRelative(0, low() -1, -0, high()+1, PS_SOLID, 4, Color.black, "Catapult"+iCntr);
//if(iCntr <= 10) Alert.playSound(vSound);
Alert.playSound(vSound);
iCntr += 1;
} } }
-
...I just thought of another info source on Pnf charts - check out the Dorsey Wright site,...All serious traders...consider adding Mr. Dorsey's book to your collection.
"Point & Figure Charting- the Essential Application for Forecasting and Tracking Market Prices".
it's all about Supply & Demand...this book will never leave your desktop.
peter.
-
Is there anyone out there that works with Point and Figure charts? I have gone through the posts and have not found a soul.Tams,
I've posted 80 times, mainly on PnF...surprised you haven't come across any of those in your search. try advanced search for user = "peterjerome". you may find something interesting.
I use a simple 2 step (not necessarily easy) methodology.
1- PnF chart combined with EFS programming used to identify 'breakout' candidates.
(I am NOT a programmer but cut & paste what I need).
2- Standard chart used for entry & exit
using Interactive Data(eSignal) for many years. very reliable data. Not interested in changing platforms. 40+ charts too many for me. I use 2 charts for setup, entry / exit.
I understand the benefit of a trading partner, i.e. (1 + 1 = 3), however I gave up searching for the holy grail (too much M. P. ) many years back and began using PnF plus Standard bar charts to successfully make my living.
I'll follow your posts.
good luck,
Peter.
-
Thanks for the comment... it seems that you are calling IS what I call 'internal relative strength'... how exactly do you measure it?DoD,
IS is calculated by dividing the close by S&P500. an increasing IS indicates some factor outside of market influence..e.g. company internals, industry, above avg buying...
if you understand easy code...this should help.
good trading,
Peter.
var aFPArray = new Array();
function preMain() {
setPriceStudy(true);
setStudyTitle("R.S. vs S&P 500");
setCursorLabelName("SPX");
setDefaultBarFgColor(Color.black);
aFPArray[0] = new FunctionParameter( "Divisor", FunctionParameter.NUMBER);
with( aFPArray[0] ) {
setLowerLimit( 100 );
setUpperLimit( 2000 );
setDefault( 1000 );
}
}
function main(Divisor) {
if (Divisor == null) Divisor = 1000;
var vClose = getValue("Close", 0, 1);
var vSPX = getValue("Close", 0, 1, "$SPX");
if(vSPX > 0) {
return (vClose / vSPX * Divisor);
} else {
return;
}
}
-
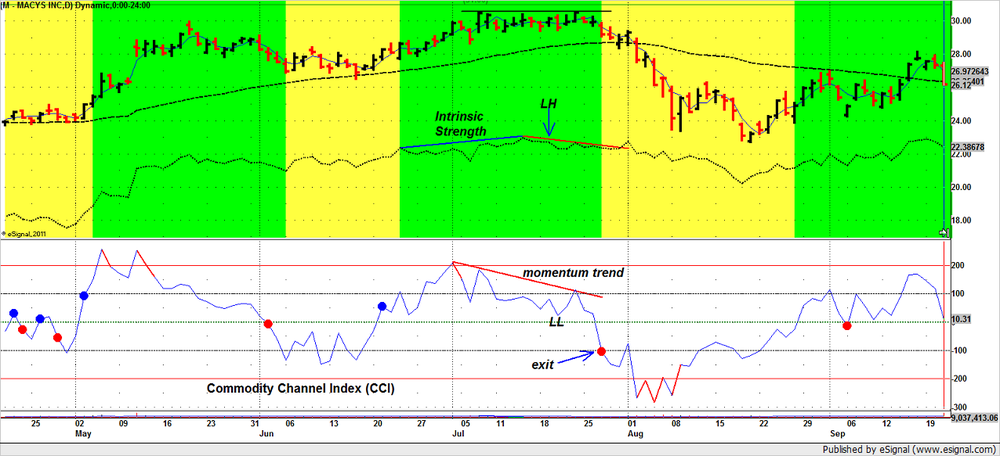
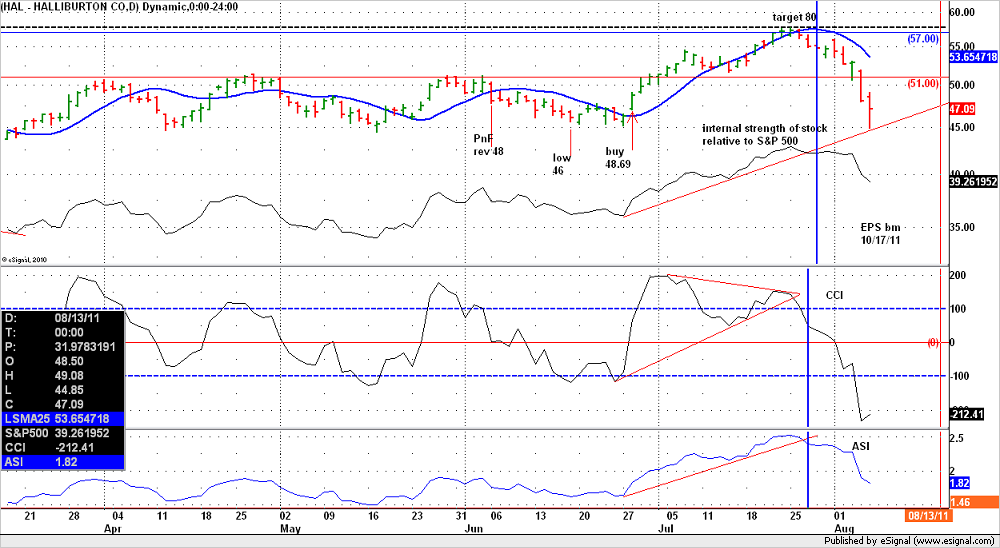
Divergence is a powerful strategy when used in correct context. I've used divergence successfully for years to exit position trades. I prefer 'intrinsic' strength (IS) over 'relative' strength. stock could move up strongly showing relative strength and still have no intrinsic strength. i.e. market could be sole source of this 'relative' strength. Intrinsic Strength is EFS file comparing price to S&P 500. when IS trends up, stock shows internal strength coming from factors outside of market influence. this is a key nuance.
reference attached chart:
initially look for IS to make lower high( LH). when this occurs, look for momentum (CCI) to make lower high while price makes higher high.(basic divergence). NOTE: it's important that momentum come from above overbought level. (+200)
locate point where momentum makes lowest low (LL) between momentum highs. this LL should be below +100 level. when momentum drops below this LL point, exit is warranted. usually occurs when momentum drops below the zero line (ZL), identified with RED dot.
Interestingly, HACO (Heikin-Ashi Candlestick Oscillator) signals exit on same day. HACO is the green / yellow overlay on price. for info on HACO, click here.
Heikin-Ashi Candlestick Oscillator | ThinkScripter
good trading,
Peter.
-
In trading, there will always be a profit and a loss per transaction.question on stock in uptrend:
11/29/11 buy "M" @ 43.38
11/20/11 sell "M" @ 46.10
as long as stock trends up is there a loss here?
peter
-
I've long maintained that one of my weaknesses as a trader is not maximizing trades when they go in my favor. I tend to take profits quickly.Enigmatics,
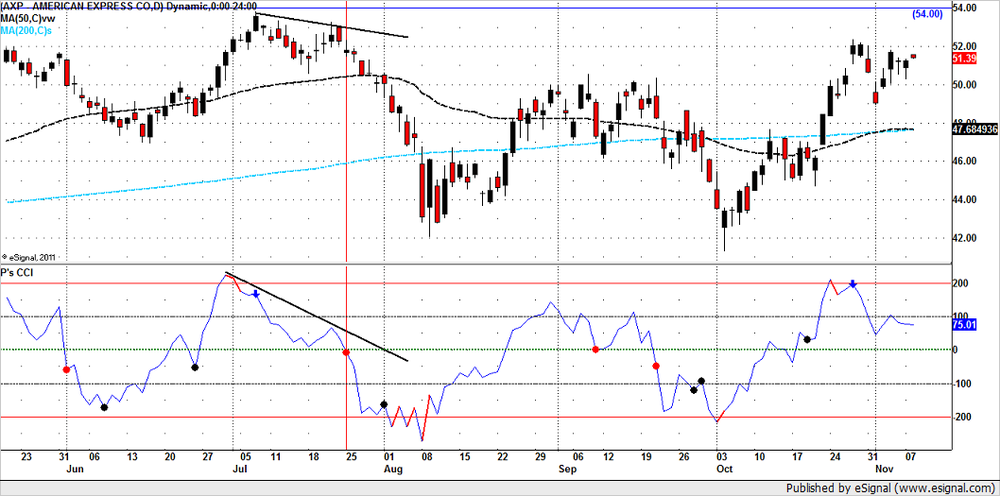
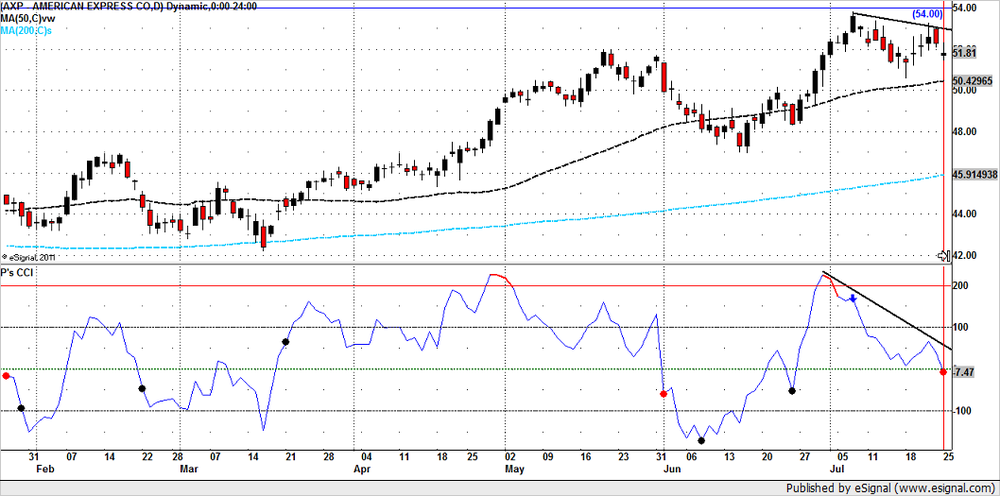
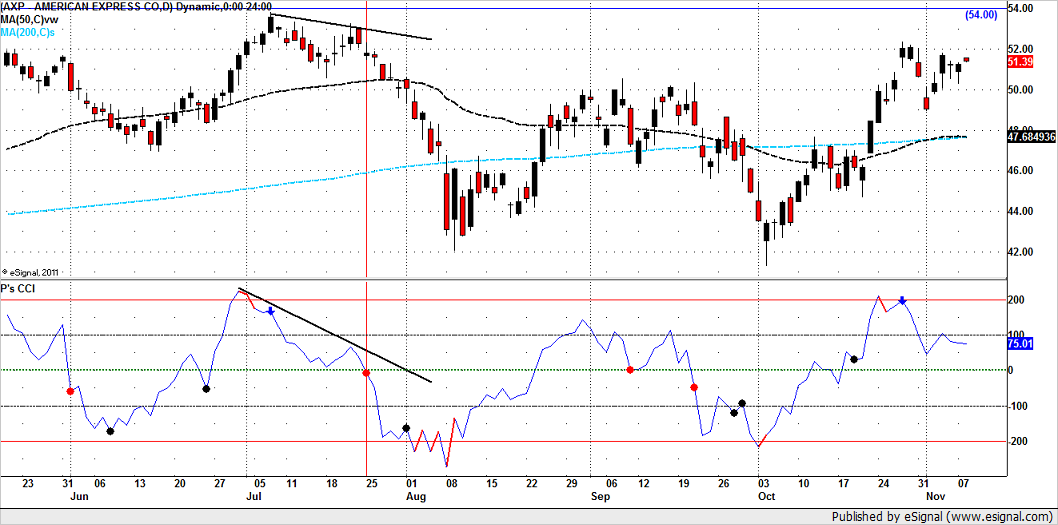
i'm a position trader (intermediate term swing). i stay in primary trend as long as it's favorable. i look for divergence between momentum and price. divergence is easy to spot when you look at chart 'history'. the past is not helpful in trading. it's a bit more challenging looking at the hard right edge.
here are two charts: the first chart shows actual divergence as it occured july. momentum indicator is CCI. it's important for momentum to come from overbought (above +200 for CCI). black trendlines shows divergence between price and CCI. the key point is the low between the momentum peaks. this is the trigger point. when momentum again peaks and then drops below this trigger, exit is suggested. this methodology gets me out when the current trend is ending.
nuances: CCI above +200 is colored red. blue arrowhead shows a potential top. red dot shows actual exit. black dot shows red candle closing below the 50 vwma.
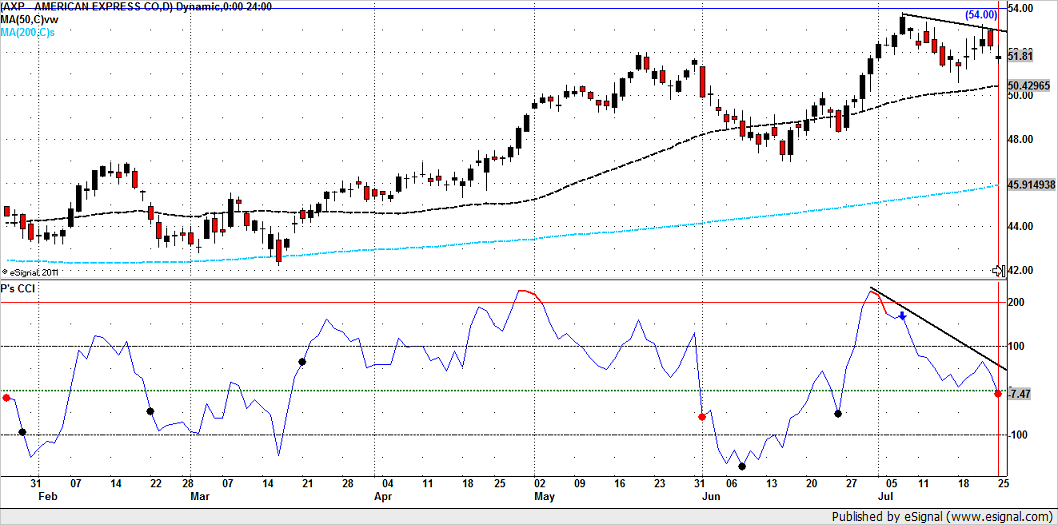
the second chart shows this same scenario wnen view from the hard right edge. i built all nuances into the chart. they give me an excellent heads up on what will soon be history and thus become useless for trading.
good trading to you,
peter.
-
I've been trading for 2 1/2 years. I have a lot of trading experiance. But I still have not been consistently profitable. What has my experiance gotten me? I know what needs to be done and I know what I need to find. .
Cruiser,
here is what turned my trading around years ago...it came from a very experienced and successful trader. he said "if you are not making money in the market, you are doing something wrong. figure out what it is you are doing wrong and STOP doing it".
sometimes the simple answer contains the key...Occam's Razor
good luck,
peter.
-
WOW...answers all over the place.
how about a measurement focusing on income generation strong enough to support a full and active lifestyle year over year and shows net worth "up & to the right"?
peter.
-
I look for momentum on a chart.I look for:
a) Broad Trend patterns
b) Rising/ falling candlesticks
How do you use momentum in your plan?
All the best,
Mr. M, have you evaluated this method?
Larry Williams' Ultimate Oscillator'.
see here on stockcharts' chartschool:
-
...I thought it'd be good to share with you some of my experiences with various charting and trading platforms.ESignal
Not used this in a long time. At the time it had a lot going for it. Lots of features, lots of symbols. Feed included. Reliability had been an issue for me in the past so I just have avoided it. Not that cheap but I think they have different options
eSignal update...eSig user for 14 yrs. eSig's data feed has excellent reliability... one of the most reliable available. cost averages < $100 mo. the cost is a business expense.
question: if the trading profits cannot cover the cost of the platform, would switching to a cheaper platform solve the problem?
peter.
-
Agree...a simple strategy based on trendline breaks can reliably identify both entry & exit opportunities. i prefer using TLBs on indicators vs. price.
daily chart for HAL shows TLB exit 07/27/11. (vertical blue line).
.confirmation next day

-
I'm wondering if any of you use daily profit goals or downsides when you trade. For example, are you done after you lose $500, or take in $1000?Also, what do you consider profitable?
sdoma,
after my initial breakeven stop, i will sell 1/3 of my position at 30%, another 1/3 at 50% and the final 1/3 i let run. i will sell this final 1/3 when the profits run up and pull back 50% of the 'final' move up.
from the very beginning of the trade, i will never give back more than 50% of my equity(their money). i haven't taken a loss in some time. it's a great feeling.
i realize there are a couple of hedge fund managers here making 'billions'. perhaps they will weigh in and share their methods.
peter.
-
I was thinking I would explore the breakout type entries. To me, they are usually the most recognizable and easy to trade set-ups, (using the word "easy" loosely, nothing is really "easy").i trade (position) equities using breakout system based on PnF charts showing double top setup. initial price targets are easily calculated.
time frame is intermediate. if position is stopped, reenter on the following double top.
actual entry is confirmed on traditional bar chart.
been using this system successfully for several years.
attached chart shows typical setups(opportunities)
break of red lines (double top) are entry points.
peter.
-
For those serious about trading for a living, the following list of traits uncovers traits found in every highly successful trader. Realize that 1% of the people who play this game take 99% of the profits. That means 99% of people who call themselves “traders” are forking over all their money to the 1% of serious and consistently profitable traders.tim, there are many voices here but most have nothing to say. you are an exception.
your #2 was the final obstacle i had to overcome to successfully earning my living trading.
thank you for your post.
peter
-
Hey, what about time? I mean, when do you toss the coin?i believe the purpose was a random event....random is as random does!
peter
-
...highly doubt your strategy is scalable to the level of a large hedge fund. Do you even understand what an inconsequential amount of money $130k is?sdoma,
what you say makes sense. i can't argue with your logic. compared to your hedge fund money, the $130K i make annually from trading really is pretty inconsequential. i get that.
but it's all relative. compare the $130K to the income of 95% of traders who lose everything, $130K takes on a different perspective.
i guess that puts me in the top 5%, no?
peter.
-
MM,
in case you left anything out, i believe you have up to 60 minutes to edit (or delete) your post.....in case you left anything out.
peter.
-
Conversely I'd argue that you can learn a great deal by taking random entries. I strongly advise that people try it.zupcon,
so true..i searched years for the holy grail and ultimately learned simple is better.
you do NOTneed the holy grail to be a successful position trader
peter
-
Consider that generating 15% returns on your capital year-on-year without excessive risk would make you a big player if you bother to attract the capital. If you generate 30% you would be up there with the Stevie Cohens of the world.sdoma,
on jan 6, i posted a 10 stock breakout folio using the Will Rogers strategy. using a simple stop buy with no management (not recommended).... 6 stocks triggered buy (currently long). 5 winners, 1 loser. current gain (3.5 months) is $4,358 or 17.5%.. 60% annual. reasonable money mgmt most likely would improve the performance.
personal current foloi (using similar strategy) is up 8 straight months $130K or 39.4%. 59% annual.that's NET income after all expenses. what category would you use here, warren buffett?
fwiw, i make my living soley through trading.
peter
.


Point & Figure Webinar with Jeremy Du Plessis
in Trading Videos
Posted
here's something i use from Jeremy's 'Definite Guide'.
PnF can be used effectively for medium AND short term trading. (assumes reader is already familiar with PnF charts)
Example:
chart is daily 1x1 (h/l) for COST. (note:reversal AND box size are both 1)
shows Reward / Risk analysis.
Red TLs show bullish and bearish support.
entry occurs 01/31/12 when price moves above Bullish Support TL
note: you could also use more conservative entry and wait for PnF pattern 'catapult'.
Target Price = 93
entry = 82
stop exit = 80 (price drops below TL AND PnF pattern is Fulcrum Reversal.)
note you could reduce risk even further with exit at TL break (81).
Risk = 2 (entry - exit) 82-80 = 2
Reward = 11 (Target - Entry) 93-82 = 11
R/R = 5.5
note you could reduce risk even further with exit at TL break(81).
R/R of 11..you only have to be right 2 out of 11 entries to be profitable.
good trading,
peter