
Welcome to the new Traders Laboratory! Please bear with us as we finish the migration over the next few days. If you find any issues, want to leave feedback, get in touch with us, or offer suggestions please post to the Support forum here.

Stock.Jock
-
Content Count
73 -
Joined
-
Last visited
Posts posted by Stock.Jock
-
-
TeamViewer has a free meeting software for non-business use. If there's going to be a chat room, then it would be helpful if all participants have already studied the Wyckoff method. Currently, there are Wyckoff Meetups if anyone is interested. wyckoffassociates@gmail.com
-
I was searching for education about Wyckoff trading and I came across this. There's a website about meetings on specific topics and there's one on Wyckoff that is held in online webinars. Read it for yourself.
LA Stock Investors Wyckoff Educational Meetup (Irvine, CA) - Meetup
-
What I've noticed in a lot of trading forums is that there are people who claim to be experts in a trading method, but come short of actually knowing the method, whatever it may be - Elliot Wave or anything else. Usually, they take shortcuts and defend their shortcuts like they know better than the original author. I may not know Elliot Wave analysis, but I can tell from this discussion that this is true here too. If there is no consensus here on Elliot Wave analysis, then someone here doesn't know how to do it.
Well, no offence, but try harder.......confusing or not, rules are rules and the only way to succeed is to do your own labeling and counting and to make sure scenarios are validatedTW
-
I tried to study the Elliot Wave theory; however, it got so confusing with all the waves, subwaves, microwaves, quantum waves, on and on. There's thousands of combinations of these waves and it seems never ending. Is their a quality educational course with instructors who have backgrounds in education? Experienced traders don't necessarily make the best trader educators. Is there an academic university that teaches this as part of their finance department?
-
No, I don't. But there's a lot of good information in the P&F thread if you do.Yes. I know about them. A number of Wyckoff discussions omit the use of PnF charts and I'm interested in why that is so. I've talked with Gary Fullett and Gary Dayton and they don't use PnF either.
I thought that PnF charts help to predict where, when and how much the market will move. I don't understand why Wyckoff traders don't use them.
Also, some Wyckoff traders speak of the SMI training as the Wyckoff Bible, but there is so much of the method taught by SMI is left out of forum discussions. For example, the 5 steps and the 9 buying and the 9 selling tests. Do you have any idea why these things are not discussed by professional Wyckoff traders in forum discussions?
-
DbPhoenix,
Do you use PnF charts for your trading in using the Wyckoff method?
-
Thanks Stock.Jock!I take a look in your file, it is general count guide in Wyckoff method. My problem is how to use P&F to count target price following Wyckoff method ( one box reversal)
The horizontal and vertical count methods are the same for any type of PnF chart. Even though Wyckoff has a different method of plotting the reversals, the count methods are the same. Here's an excellent video on PnF charting which includes how the count methods are performed.
[ame=http://www.youtube.com/watch?v=JTVejaFTFJk]Point And Figure Charting Basics - YouTube[/ame]
-
Hi YT,
I wish I could help you, but those things are not clear to me either. My only understanding of changing box size or reversal size is to make the PnF patterns fit reasonably on a chart. I seem to remember something like that after going through the study materials at the PnF University.
After fitting the pattern to the chart, then the horizontal and/or vertical counts can be made using the box size and reversal size in the calculations. If there is anything else that I missed, maybe Gary Fullett can help us out.
Was it you who told me about NJ7 last year? Anyway, Bull's Eye Broker has a beta version 5 available and it supposed to connect to a few real time data sources for trading with both PnF and price charts. Another platform for PnF charts is Amibroker.
You have a good question about PnF charts. So far as I can find out is that they are for guesstimating a projected retracement for planning to take a profit. This is Wyckoff's method. I've seen other methods for this guesstimating using chart patterns like the flags, pennants, wedges, etc. Although these patterns are described to show up on price charts, there is some literature that says these patterns also show up on PnF charts. I don't think Wyckoff traded directly from PnF charts only, but there seems to be some traders who see breakouts patterns on PnF charts just as most traders do on price charts.
-
A little off topic but what application do you use for your PnF charting?YertleTurtle,
You can also use NinjaTrader 7. It's free for simulated trading and it has PnF charts. It's not free for real trading.
-
I would compare the P&F chart to the bar chart, but only as a comparison, not an absolute. Keep in mind, Wyckoff did not use volume or time in his charting. This is something I do to try and capture a possible edge. I don't look at them exactly the same, but I do compare them.Yes. I do see some similarities for volume for both charts. Isn't volume the "cause" and the price movement the "effect"? This seems to like it would be the same for a column of "X's" or "O's" in a PnF chart too.
-
Gary,I personally added the volume to my charts to show if there is a conviction to the move.Do you use volume on PnF charts the same way as on Vertical (bar) charts? For instance on a bar chart when there is a wide spead bar with a high volume, would it be analyzed the same as a tall column of "X's" or "O's" with a high volume.
I don't mean to imply isolating the bar or column, but I want to keep my explaination simple. I know that I should consider the background and future confirmation.
-
-
Attached are several PnF indicator codes for Amibroker in AFL code in a zip file. These also can be used as examples on how to program your code in whatever programming language you plan to use. It would be good to have PnF chart code for the Wyckoff method in AFL code also.
-
I'm not familiar with the C# programming language, but attached is a file with all the chart types for NinjaTrader 7 and PnF charts is included. If you or someone you know can isolate the PnF code, you have somewhere to start in developing your code. NinjaTrader uses NinjaScript which is C#. See attached file. Personally, I'd like to see someone develop the code for the Wyckoff PnF charts for NinjaTrader. The Bar type code is located in My Documents / NinjaTrader 7 / bin / custom / type / @BarTypes.cs
-
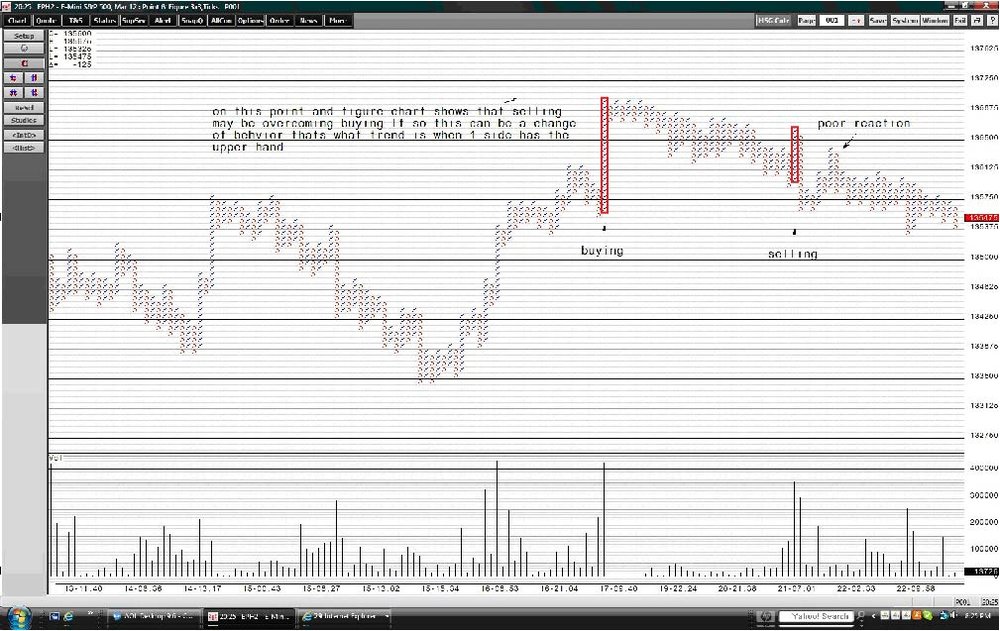
What is smart money doing when the bar has a wide spread and very high volume? Then what is smart money doing when the bar has a wide spread and very low volume?It's the quality of buying and selling that's important. We characterize those bars by wider range and increased volume, which are special kinds of buying and selling bars. We are always judging the character of demand and supply bars by price and volume and by the speed at which they occur.
-
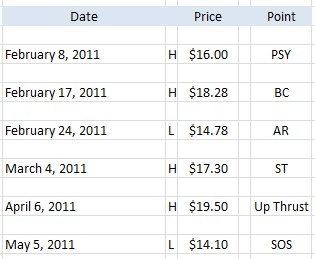
Gary,
Sometimes I get confused on the terms Buying and Selling, because it depends on who we're talking about. I've marked some columns of X's on your E-mini S&P chart to ask you about who is buying or selling on the two columns of X's that I've marked. I need clearification on whether columns of X's are buying or column's of O's are selling. Please help me on this.
See attachment.
-
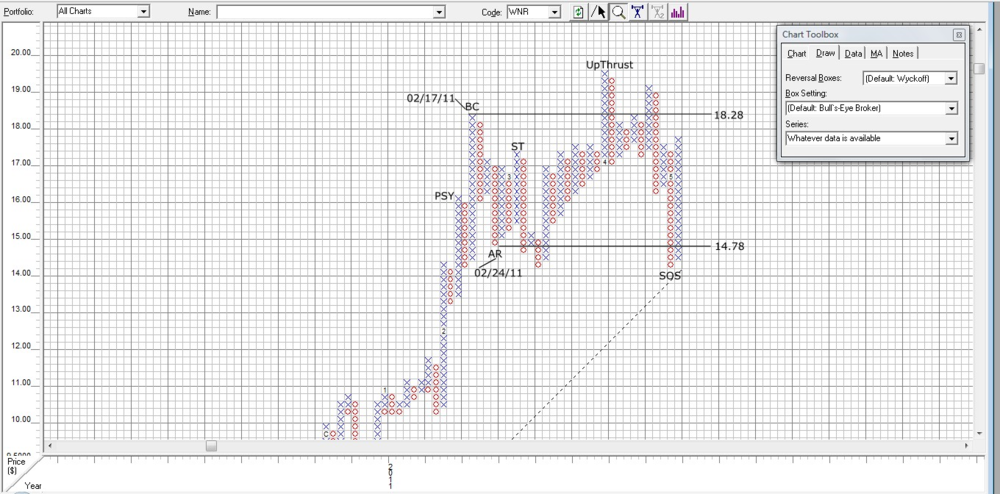
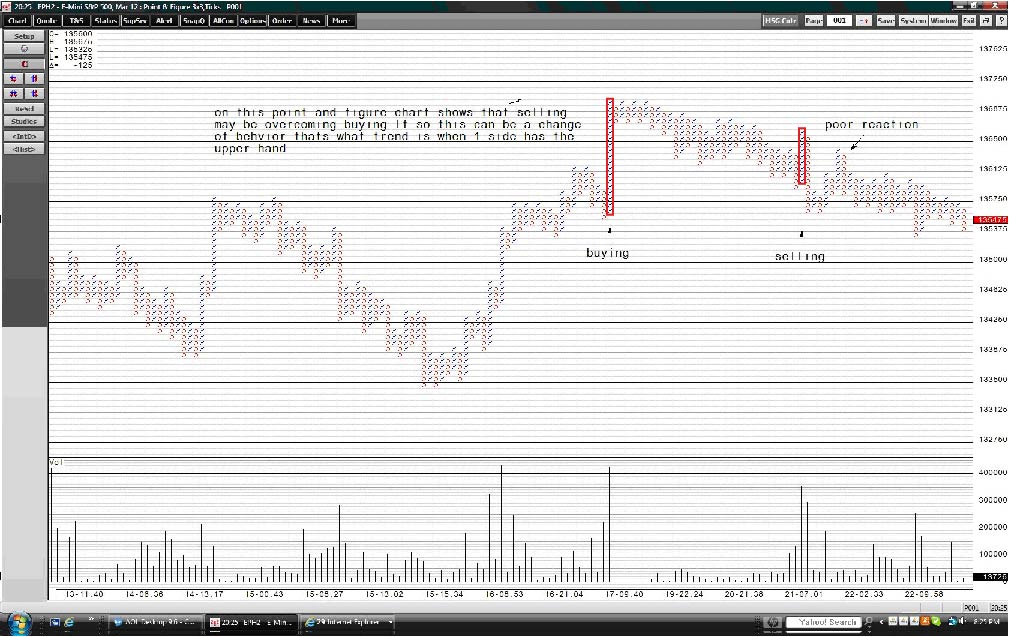
Gary,
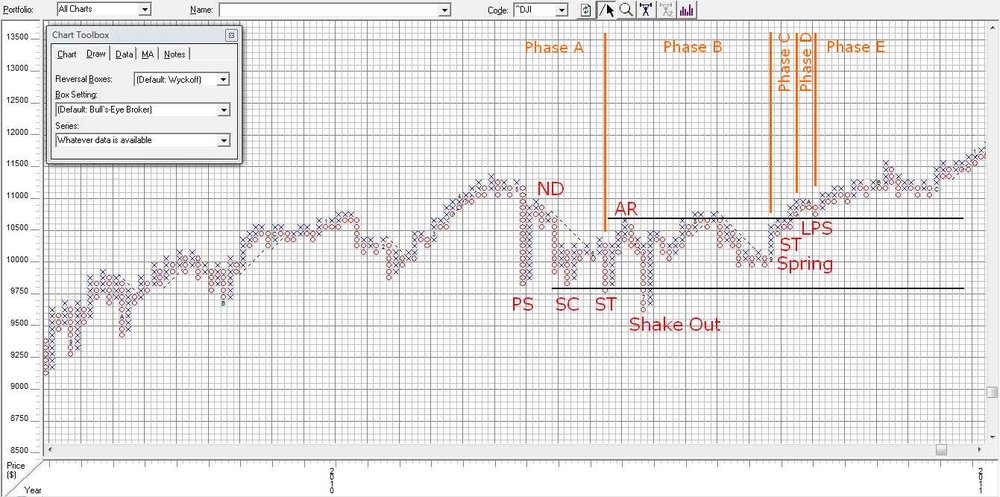
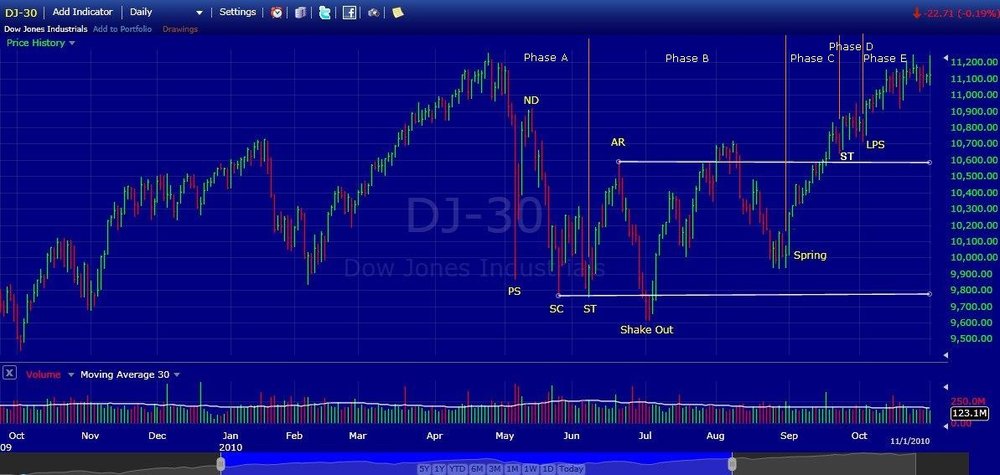
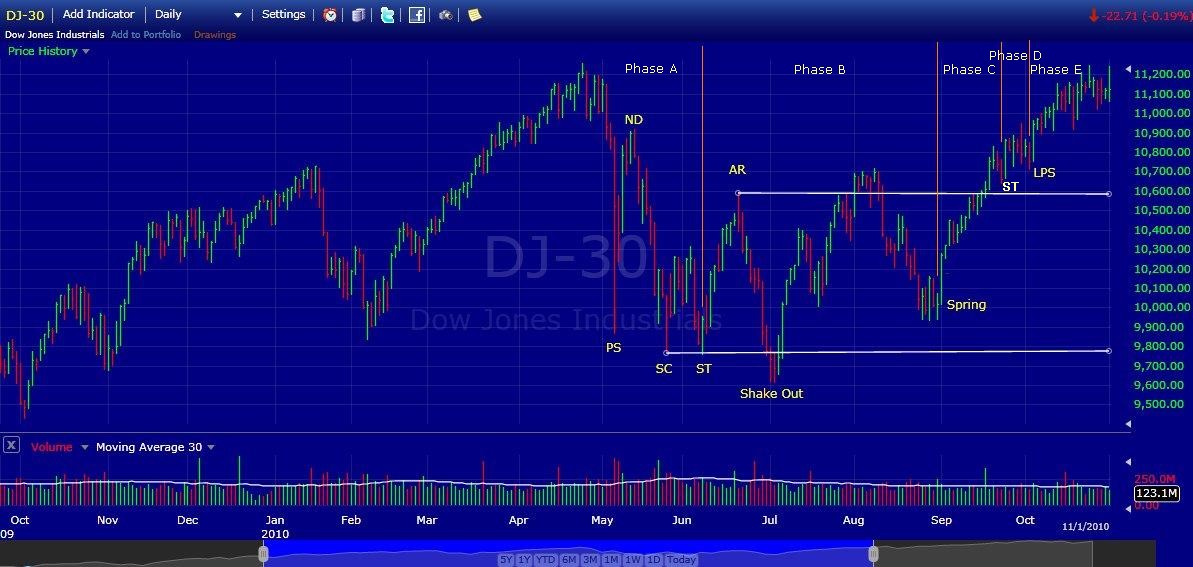
I've attempted to identify the Wyckoff phases on both a PnF chart and a Vertical (Price) chart. I'd appreciate any comments that you might have. See attachments.
-
There appears to be similar chart patterns for an equity in both the Price chart and the PnF chart. See attachments.
-
Thanks Gary. Its good to have a way to guesstimate how far a move will go, but do they give any more information than price charts as an indication of whether the prices will go up or down? So when measuring how far a move will go, will the chart tell which direction the move will go?Point and figure charts are only used in Wyckoff as a guesstimate of how far up or down a movement can go. -
Wyckoff P&F doesn't have volume or time, but I use volume to show activity of strength or weakness.Gary,
Do the Wyckoff P&F charts show the ebb and flow of supply and demand and give reliable signals on which direction the market will go in the near future?
Also, are P&F charts done with the Wyckoff calculations more reliable than other methods of calculating them?
-
Did you know that Bull's-Eye Broker will release their new software during fall? It will have Real-Time charting, and they have Wyckoff charts. I have signed up for beta testing, and was told I could start testing in end of September.I'd be interested in beta testing too. How do I sign up? What brokers will they allow data to come from? I have TDA. NinjaTrader allows for real time charting, but it doesn't include the Wyckoff PnF like Bull's-Eye Broker does.
-
YertleTurtle,
Nice set of charts you posted. I'm interested in the PnF charts that you make on NinjaTrader. I downloaded and installed it and I linked it to TD Ameritrade for my data stream. I see in the chart properties that the box size and reversal can be changed, but I'd like to get it to plot the Wyckoff PnF chart. Do you know if this chart code can be edited? Is there an editor in the program for it?
-
-
Interesting discussion. I had a stock that was slowly uptrending for several years and I never placed a stop on it until I learned about stops. Soon after I placed a stop on it, I got stopped out. The price that I got stopped out on never showed up on the price chart nor on the "Time And Sales" report. Some market maker traded on my stop and it was never recorded. See my post on What good are trailing stops?


Need Help with ThinkOrSwim's ThinkScript
in Coding Forum
Posted
I'm attempting to learn and apply the fold command in TOS, but my code is not plotting correctly. Could someone take a look at it and get it to work? I know how to code DO LOOPS in basic language and I'm having trouble doing it in TS. One problem that I have with this is controlling the increments in the iteration. I don't get any syntax errors, but this code does not plot correctly and I cannot figure out why. It should plot horizontal lines at different levels.
*****************************************************
def HAV = HighestAll(High);
def LAV = LowestAll(Low);
input Direction = {default GridUp, GridDown};
input n = 4;
#
# ============================================================
# SWITCH BETWEEN DIRECTIONS
# ============================================================
#
def Mode;
switch (Direction)
{
case GridUp:
Mode = 1;
case GridDown:
Mode = 0;
}
def StartPoint = if Mode == 1 then LAV else HAV;
plot GannLine = fold i = 1 to n
with j = 45
do if Mode == 1 then Sqrt(StartPoint) + ((i * j)/180)
else Sqrt(StartPoint) - ((i * j)/180);