
Welcome to the new Traders Laboratory! Please bear with us as we finish the migration over the next few days. If you find any issues, want to leave feedback, get in touch with us, or offer suggestions please post to the Support forum here.


gamblerKi
-
Content Count
25 -
Joined
-
Last visited
Posts posted by gamblerKi
-
-
Hi Vienna,
I read your old posts. You were confused by bbt, tape, traverse and channel. It seemed you had no idea how to annotate a chart at that time.
I am still struggling how to annotate the charts. How did you 'get it' and finally annotate a chart correctly? What drills or work did you do?
Thanks!
gamblerKi
-
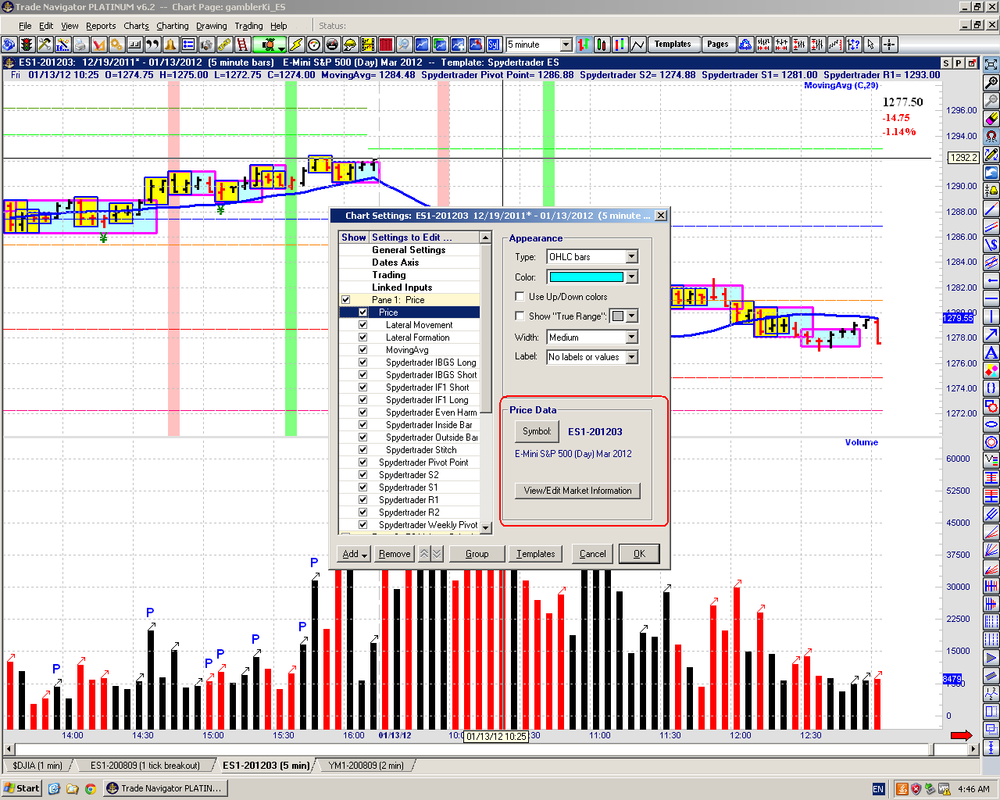
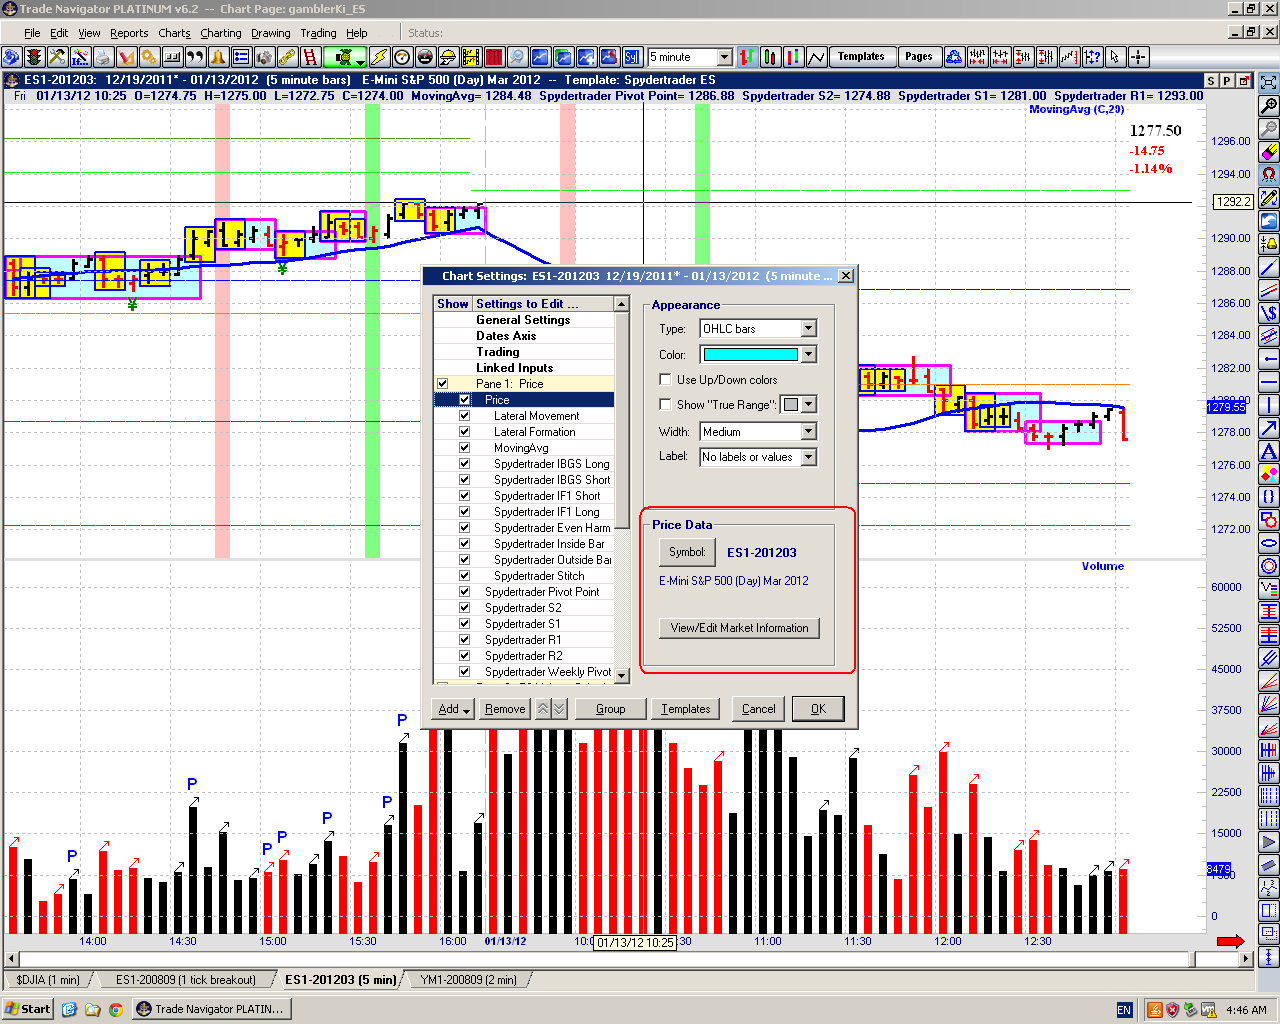
I installed the Trade Navigator trial version and performed the Upgrade. I could not degap the chart. The interface is a bit different from Spyder's description:
Does anybody know how to degap the chart in the Trade Navigator?
Thanks.
-
On Jacks clean page #4, you can have pt2 inside the channel, check out the yellow highlighted area."2.To the right of RTL or in yellow and"
I think the yellow area refers to location of pt 3.
-
It's wrong. "Clean Page 4" describe ideal situation.Hi Stepan,
If I understand correctly, you mean:
1) In ideal case, the point 2 of a container is OUTSIDE the prior container's RTL.
2) In some cases, the point 2 of a container CAN BE inside the prior container's RTL.
If the above 2 statements are correct, these do apply to all fractals. Am I right?
Where can I find the relevant information?
Thanks.
Regards,
Ki
-
Here a video I created a few days ago with 2 live trades, one small loser, found myself on the wrong side and a quick correction. I added some comments what I was thinking at that moment. Also some examples of "What wasn't that" which was the reason to hold. If anyone finds it useful, let me know and I post some more with comments. It was produced twice the normal speed.regards,
Ivo
ivo, the video is awesome!
Thanks!
Regards,
Ki
-
Yesterday, EOD.Had to stop around 1:30, so anything after that is hindsight

HTH, Vienna
Hi Vienna,
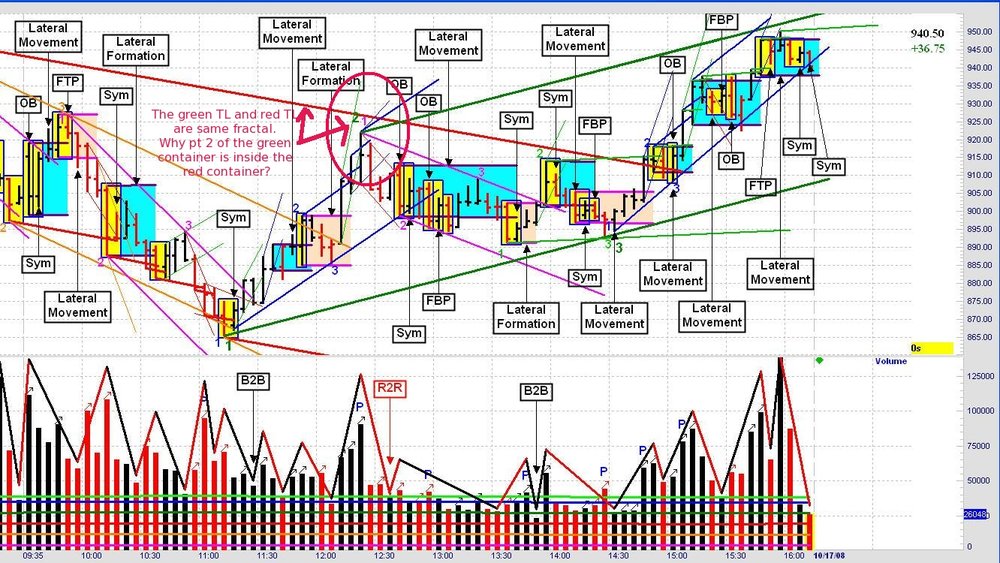
In your 6 Oct 2001 ES chart posted in #3106 (http://www.traderslaboratory.com/forums/technical-analysis/6320-price-volume-relationship-78.html#post129421), why was the green point 2 of the green up traverse(bar 52 - 61) inside the previous red down traverse? (The pink circle in the attached chart.)
I found several source of information mentions: "The point 2 must be outside the RTL of the previous container in the same fractal." Is there something I missed?
Here is one of the information:
Thanks.
Regards,
Ki
-
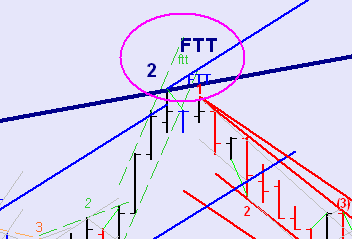
I have attached the SPI futures from today. I would like to get expert opinions.Thanks
Hi xioxxio,
The dark blue FTT cannot be the point 2 of the same container.
Regards,
Ki
-
Hi all,
I can only identify traverse FTT bars after the traverse RTL is broken, i.e. several bars later than the FTT bar.
Do you guys have any lagging in identifying the FTT bar? Are you able to spot a FTT bar during its formation?
TIA.
Regards,
Ki
-
Hi Vienna,
Chart A is 4 Oct 2011 EOD. It is a clean chart without any annotations or degapping. The grid in the price pane represents 2-point ES.
Chart B is the snippet of your chart on 5 Oct 2011 (morning session).
The thing inside the pink rectangle looks like a tape to me because I couldn't find the non-dominant tape. But on your annotated chart, the thing inside the pink rectangle was a traverse. (Please refer to the attached chart)
What made you think the thing inside the pink rectangle was a traverse?
Thanks.
Regards,
Ki
-
Hi ,In ET old posts, Spyder said the end effects of FTT are: 1. BO 2. FBO 3. FTT
According to guuci(TL post #2732 & #2734), there aren't any FBO.
In ET old posts, Jack said FBO existed and described in details what happen during FBO.
My question is: A SCT trader find FBO after FTT because:
a. he/she is not skillful or 'jumps fractal'?
b. FBO really exists in the market?
TIA.
To amend my previous post for gucci TL posts:
guuci TL post #2732: http://www.traderslaboratory.com/forums/technical-analysis/6320-price-volume-relationship-69.html#post114503
guuci TL post #2734: http://www.traderslaboratory.com/forums/technical-analysis/6320-price-volume-relationship-69.html#post114508
To further elaborate my previous post:
In Forums - Getting down and dirty is where the rubber meets the road ...
gucci asked about 5 traverses in a channel. Isn't the 4th traverse "FBO" the channel and the channel do "expansion" to include 2 more traverses?
Forums - Getting down and dirty is where the rubber meets the road ...
Jack explained "Expansion" in this page. Is expansion caused by FBO of the 4th leg in a container?
Jack also talked about "Bookmark" for traverse FTT. Is this handling of traverse FBO?
I am just confusing, if a *very* skillful SCT trader like Jack , Spyder or gucci, will they mis-identify the 3rd leg in a container as FTT? Will they ever see violation of their "Bookmarks
?
-
Hi ,
In ET old posts, Spyder said the end effects of FTT are: 1. BO 2. FBO 3. FTT
According to guuci(TL post #2732 & #2734), there aren't any FBO.
In ET old posts, Jack said FBO existed and described in details what happen during FBO.
My question is: A SCT trader find FBO after FTT because:
a. he/she is not skillful or 'jumps fractal'?
b. FBO really exists in the market?
TIA.
-
Vol (I-V) and what are the levels eg 1.2 1.5= Pace levels (horizontal lines on Vol pane), 1.2= 1200 contracts
Hi Vienna,
Congratulations!
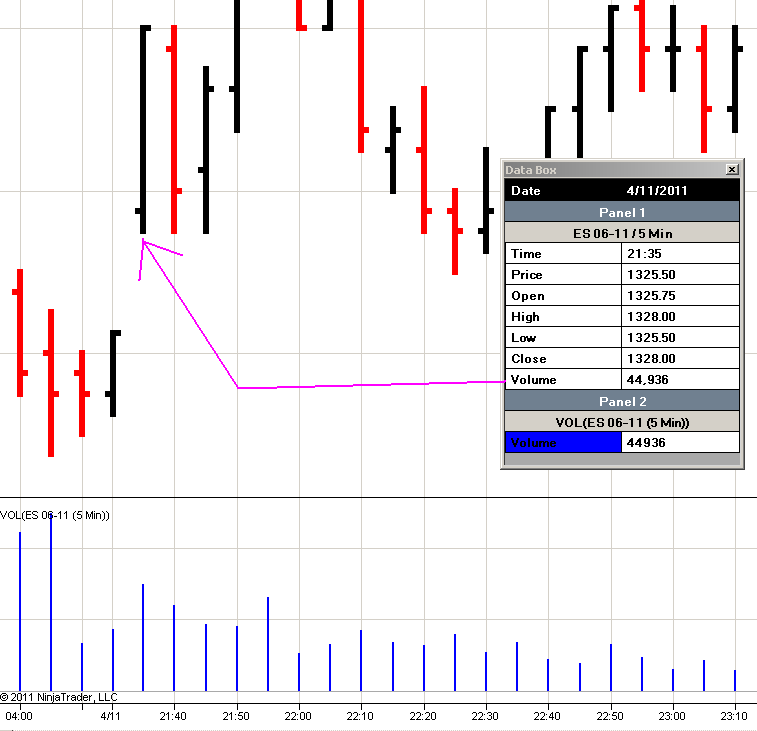
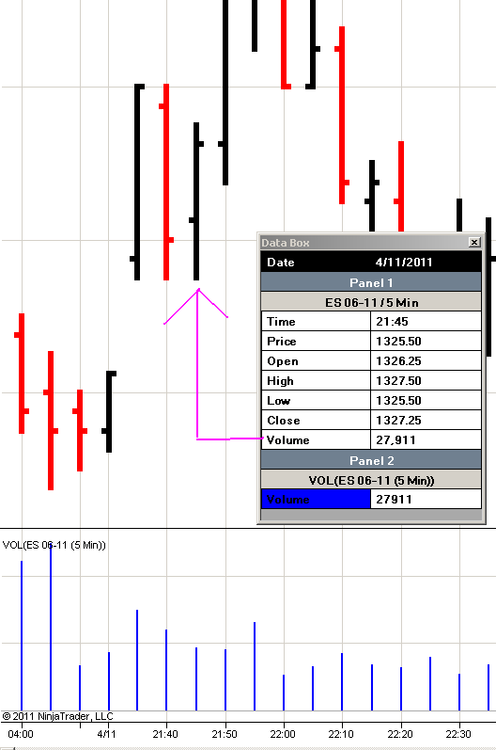
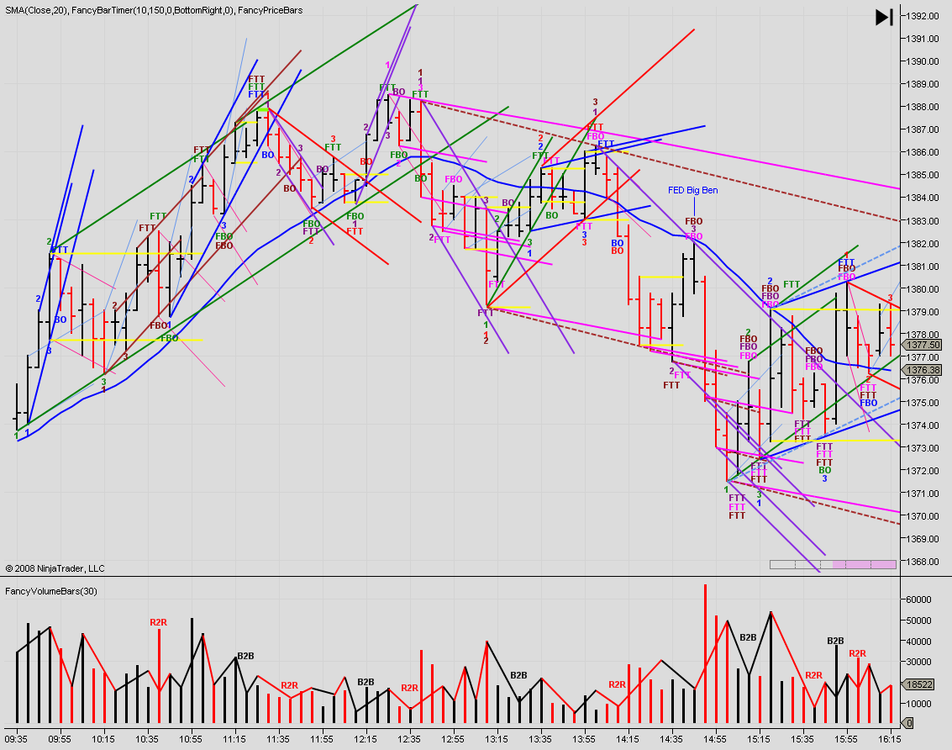
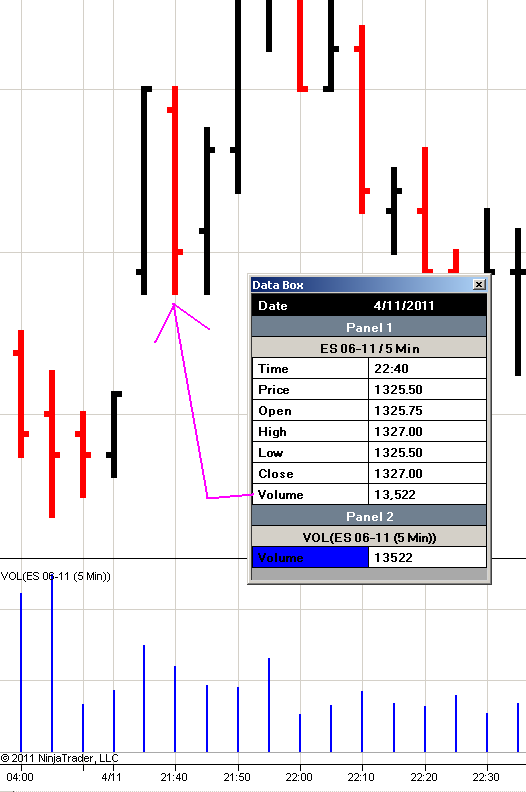
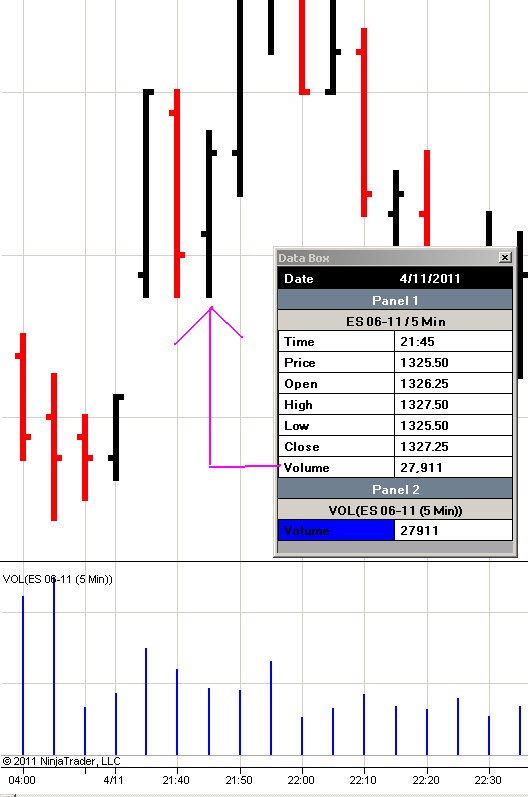
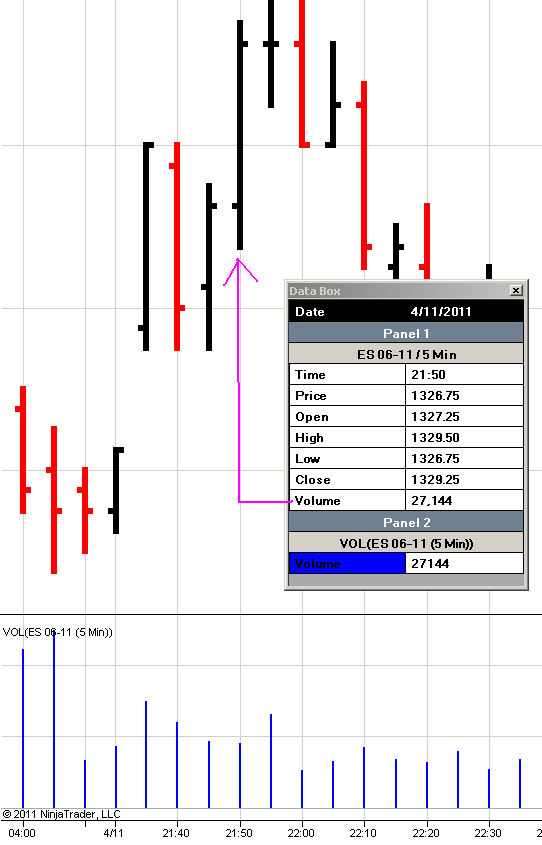
In the 2011_04_11_4 logs.pdf,
Bar 1 Vol-Level=2.6 (means 2600 contracts)
Bar 2 Vol-Level=2.82 (means 2820contracts)
Bar 3 Vol-Level=1.8 (means 1800contracts)
Bar 4 Vol-Level=1.8 (means 1800contracts)
In ninjatrader chart (please refer to the attachments for more information, in Asian timezone), the actual volume of Bar
1: 44936
2: 13522
3: 27911
4: 27144
What is Vol(I-V) in your log? TIA.


-
cnms2, thanks very much for your feedback!
Another question: does anyone know when was the recent channel point 1?
-
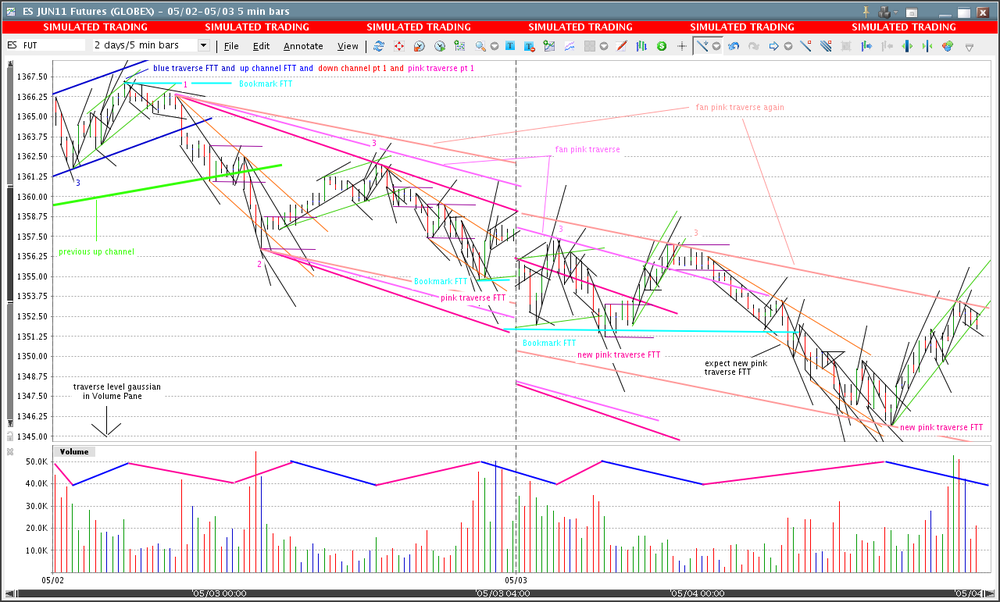
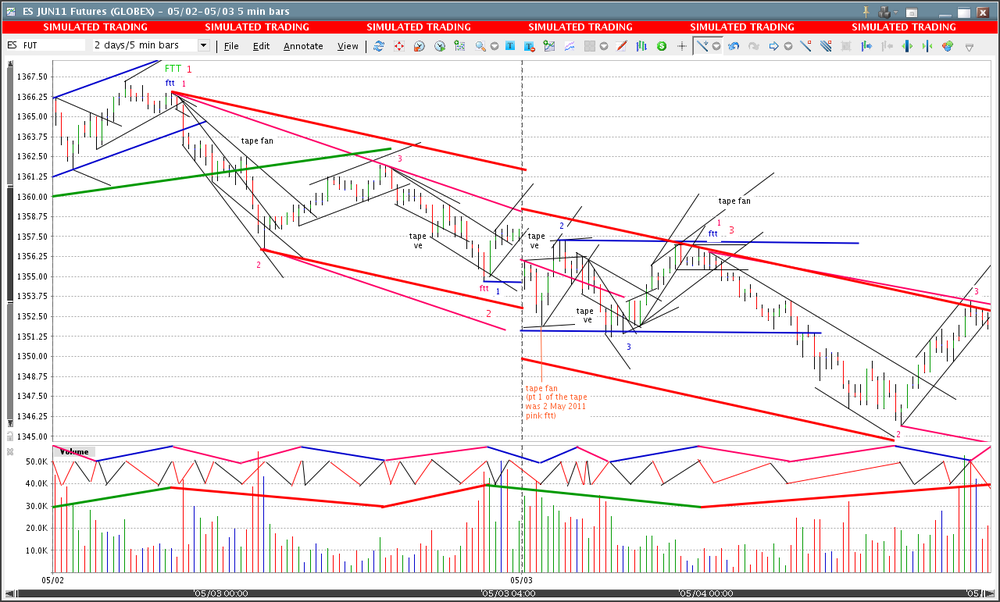
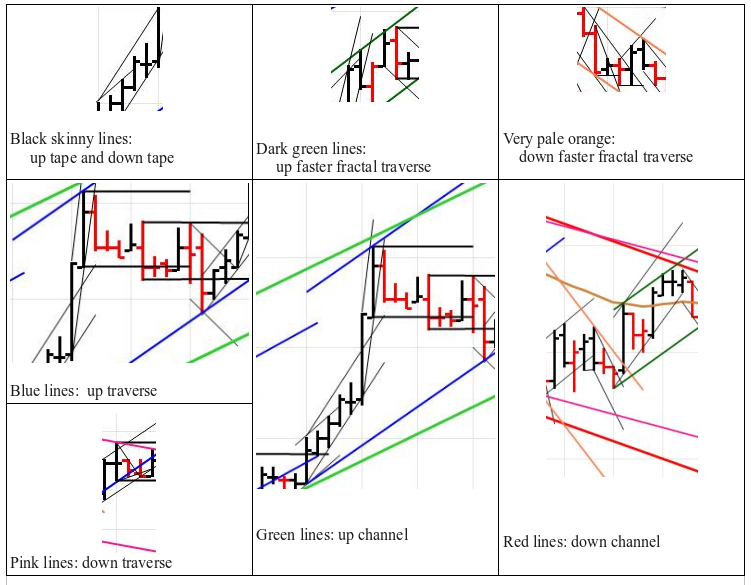
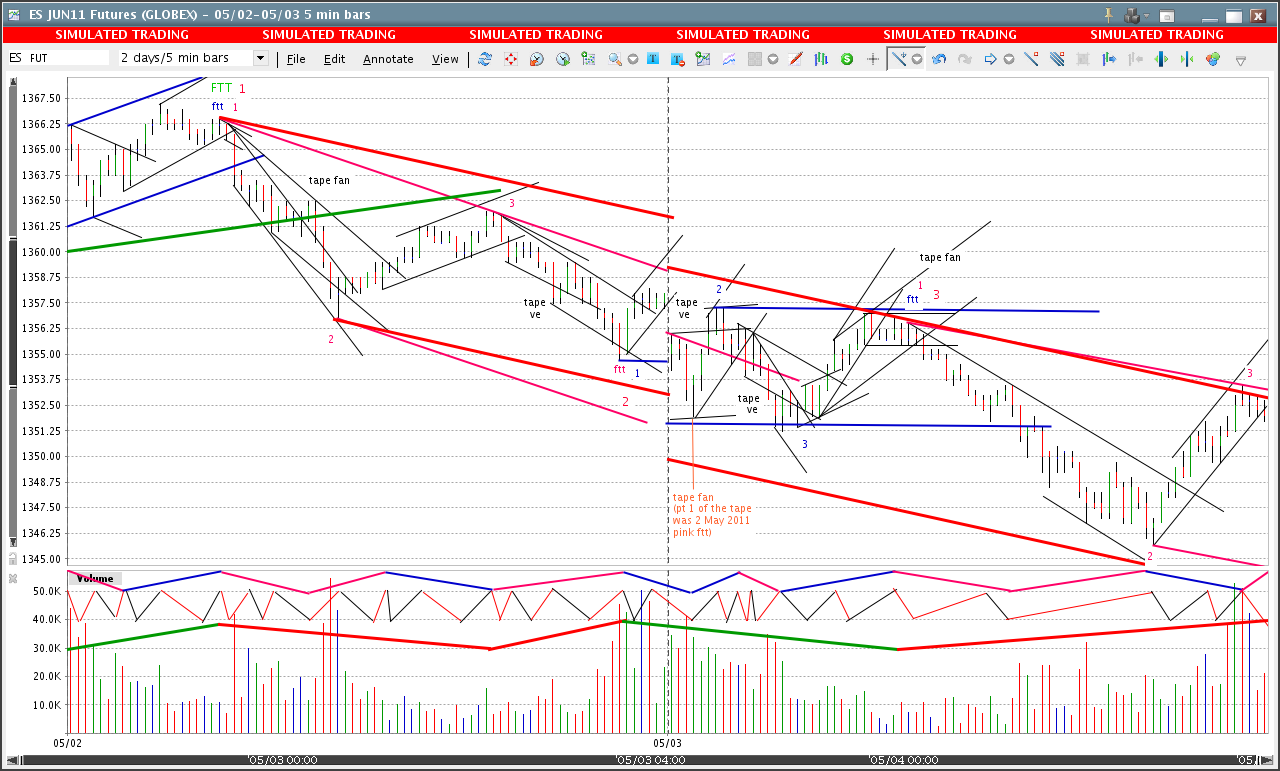
Attached is my annotation on 2 May 2011 and 3 May 2011.Black Skinny line: tape
Blue Medium line: up traverse
Pink Medium line: down traverse
Green Thick line: up channel
Red Thick line: down channel
Any comments on my chart? TIA
green skinny line: up faster fractal traverse stuff
orange skinny line: down faster fractal traverse stuff
updated version, based on Jack's feedback.
Any comments on my chart? TIA
-
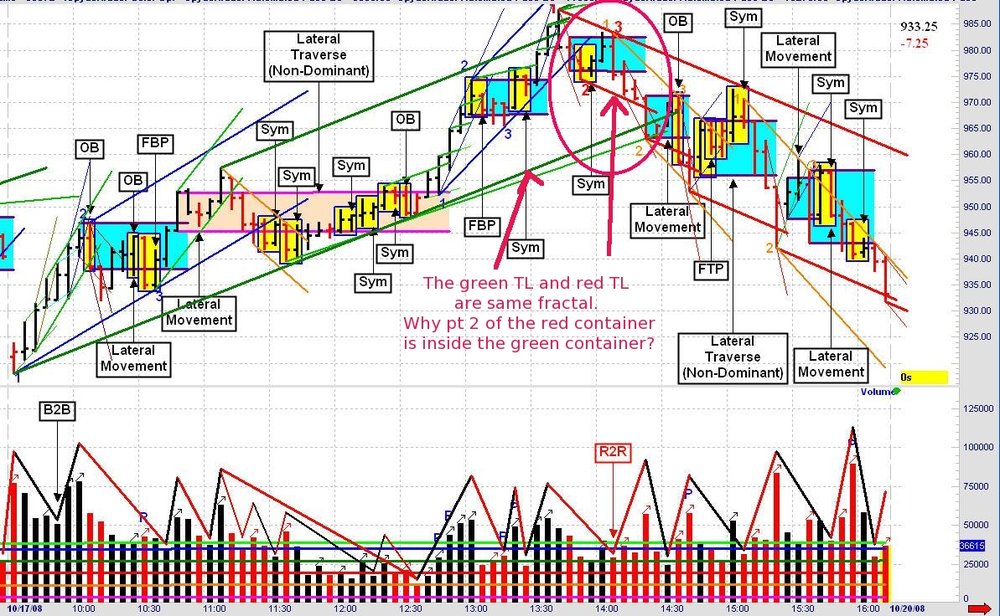
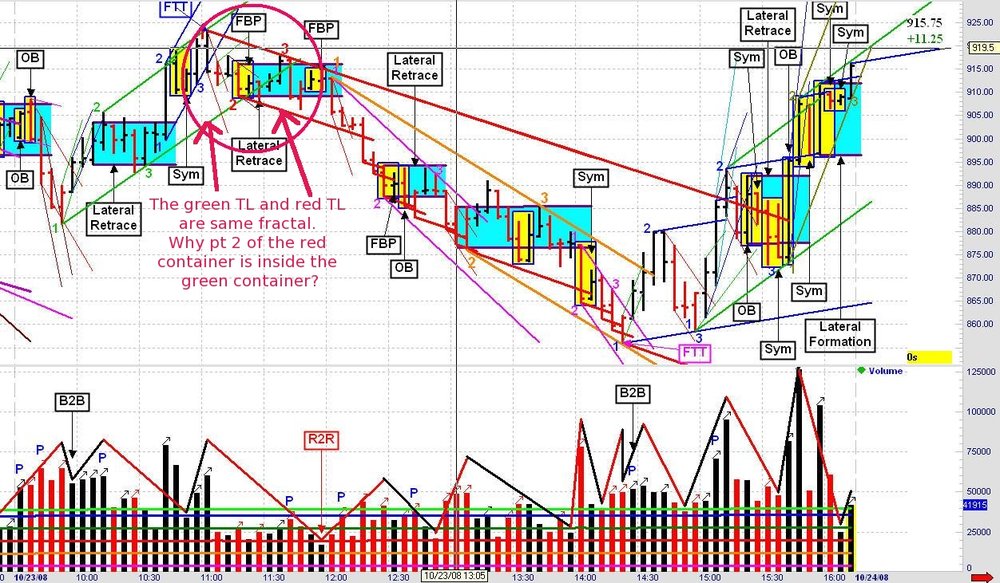
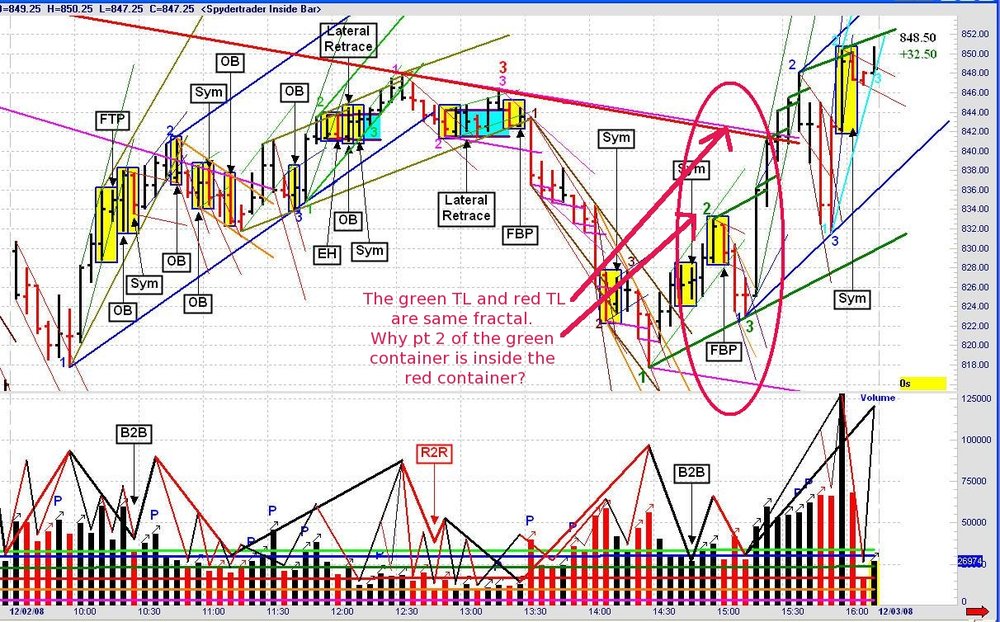
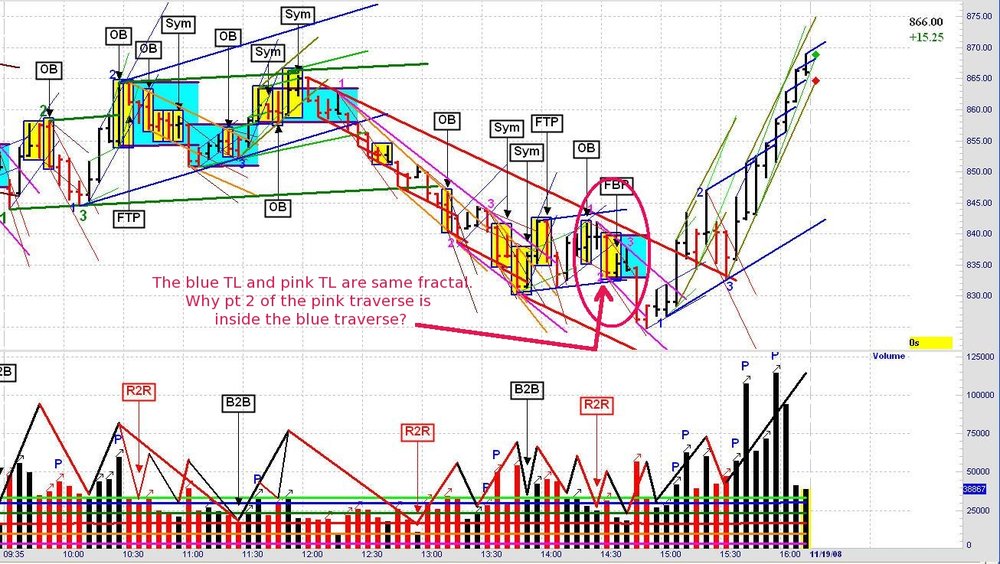
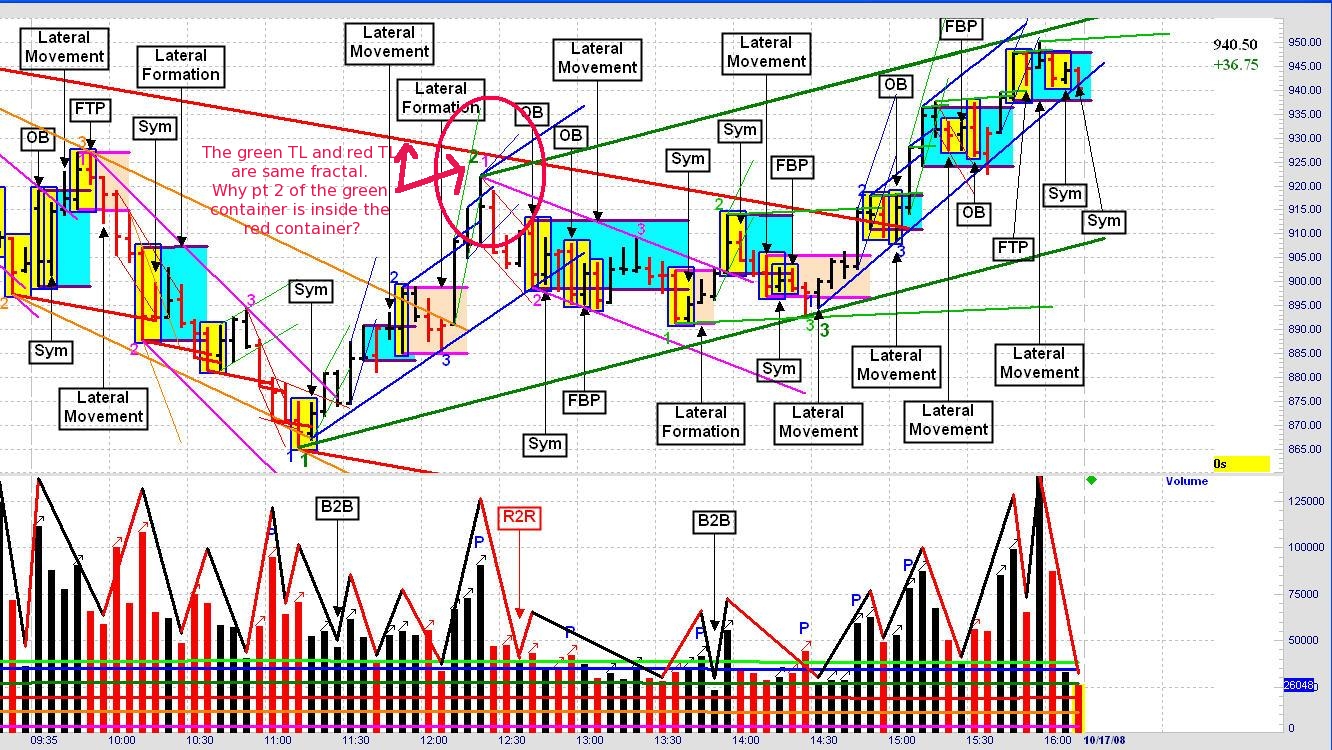
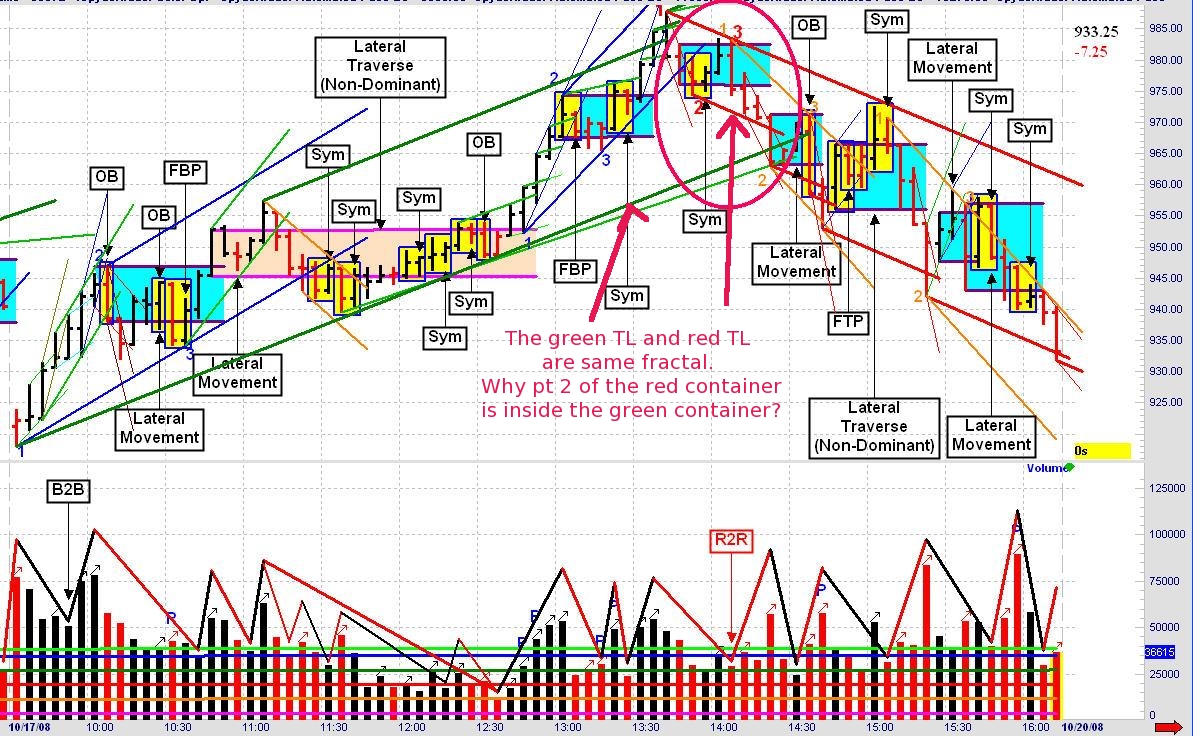
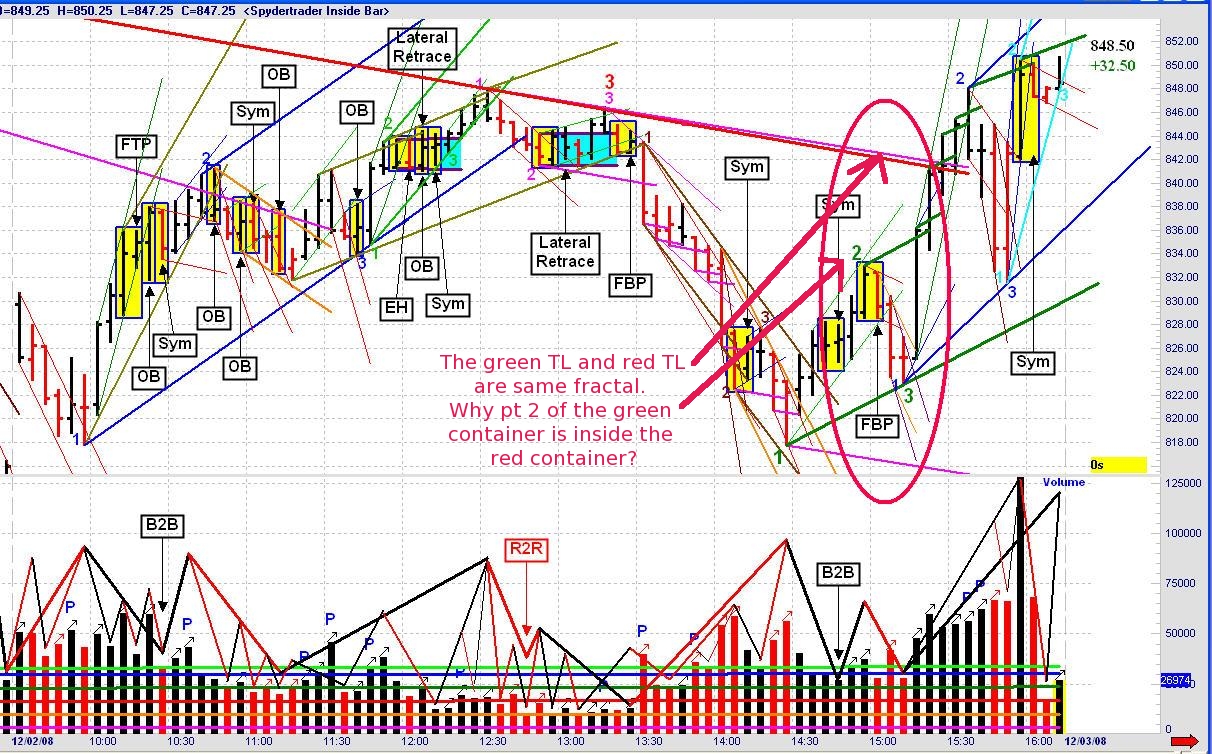
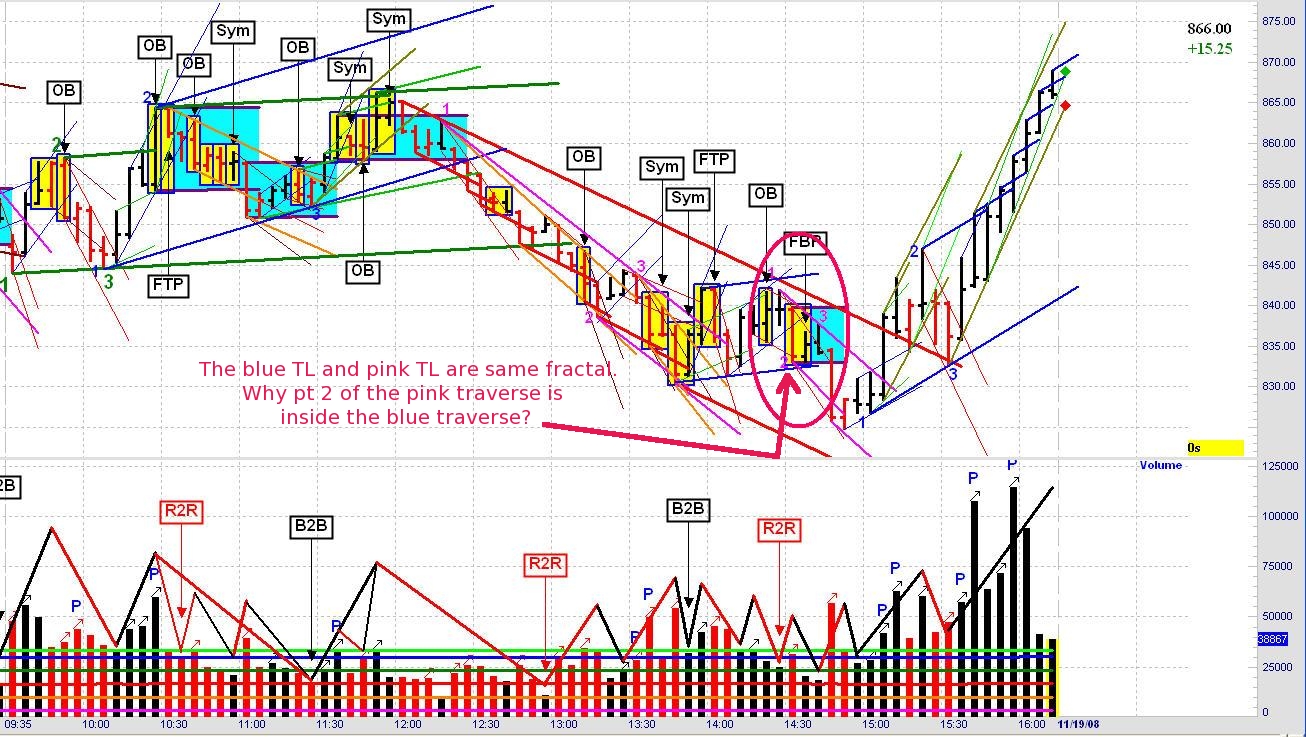
From my understanding, pt 2 of a new container must be outside the previous container.
Quote from gucci
"A point 2 must BE outside of the previous thing RTL. AND it MUST be preceded by X2X sequence of the volume. One of these conditions wasn’t fulfilled at the time in questionon on the trading fractal."
In the attached charts (spyder's old charts in IR thread), why are Point 2 of those circled containers inside the previous container?
-
Attached is my annotation on 2 May 2011 and 3 May 2011.
Black Skinny line: tape
Blue Medium line: up traverse
Pink Medium line: down traverse
Green Thick line: up channel
Red Thick line: down channel
Any comments on my chart? TIA
-
-
Hi cnms2,
Thanks very much for your feedback.
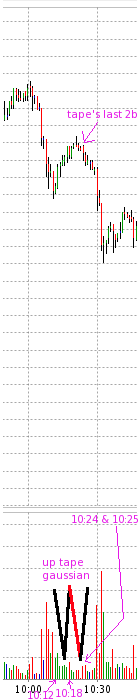
Attached is the snippet of DAX 1 min chart (2011/5/26). I drew that up tape gaussian (b2b2r2b). The up tape started around 10:12 and arrived point 2 at 10:18 because of the increasing red volume bar. The up tape finished around 10:25 because of the 2 increasing red volume bars at 10:24 and 10:25 (although 10:24 and 10:25 represent down bars).
Am I right?
-
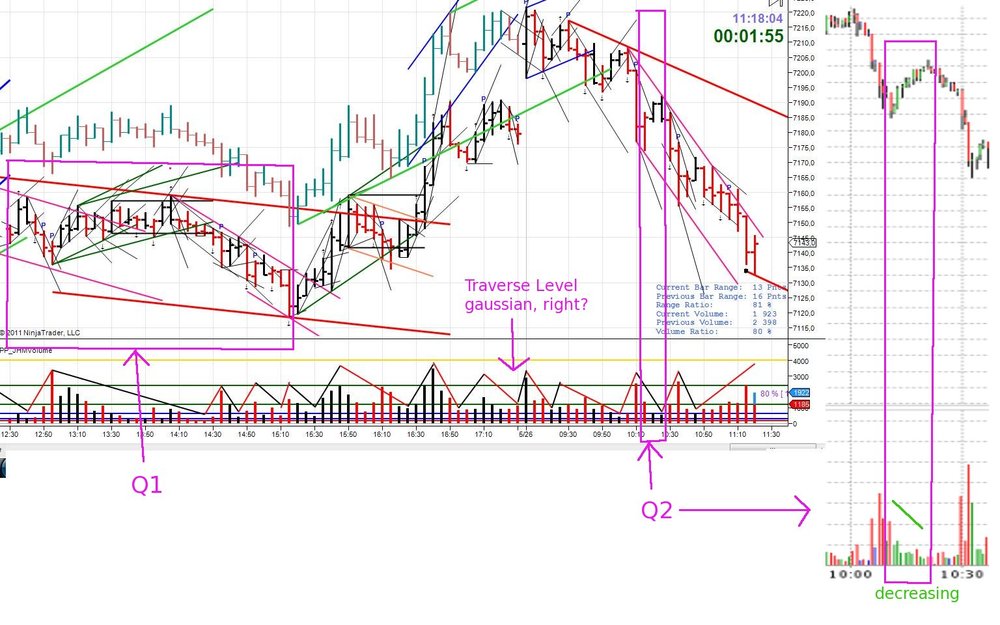
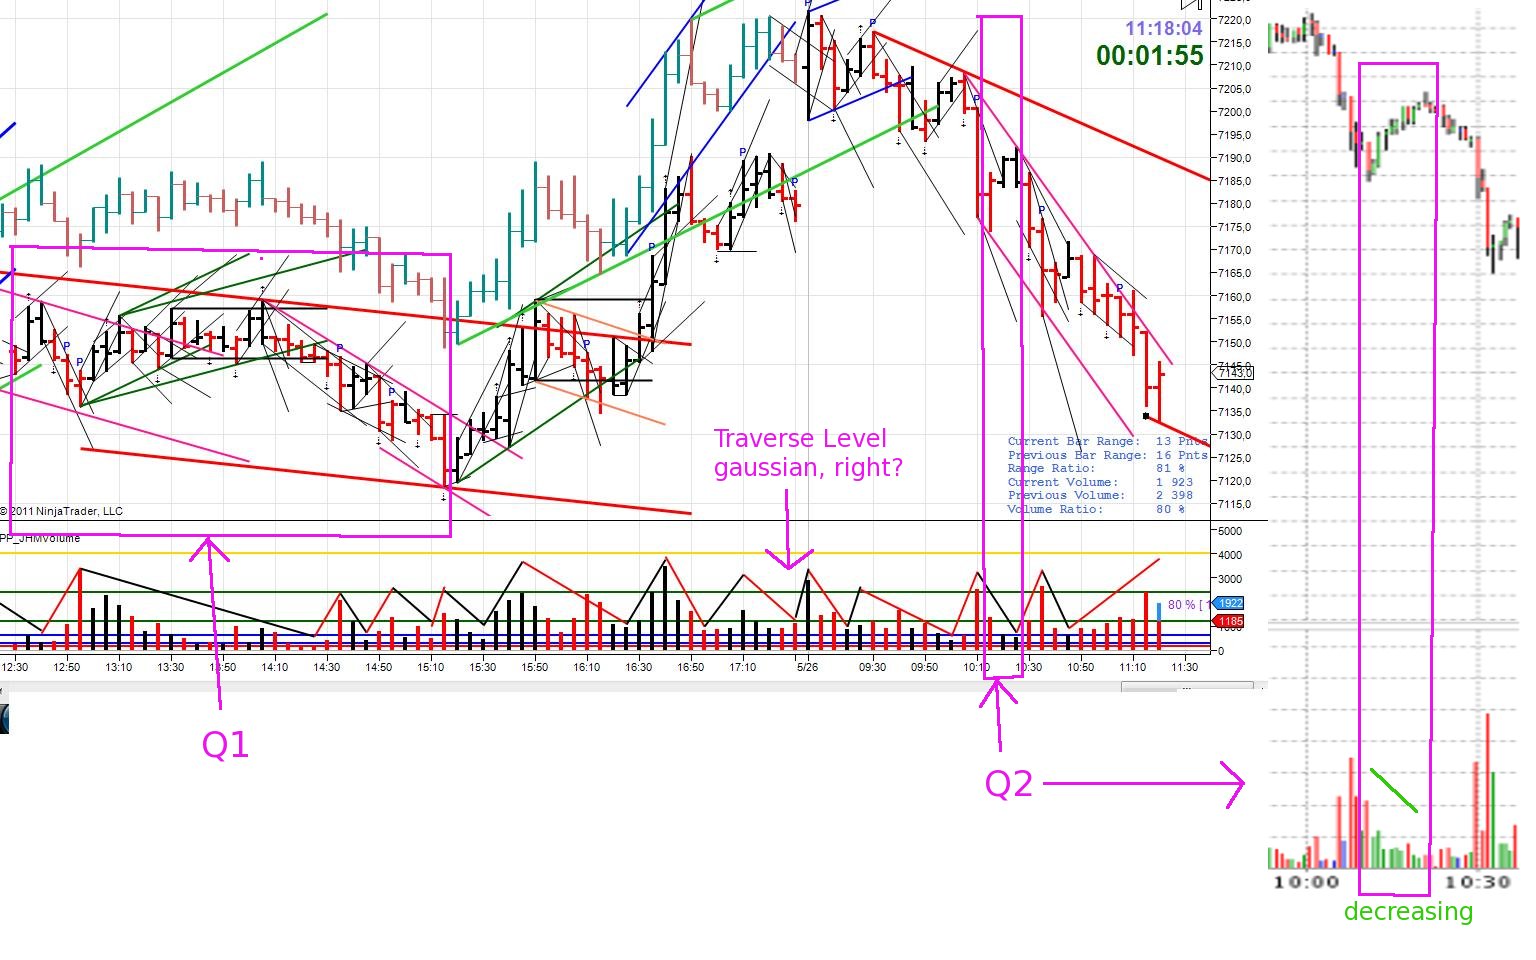
Hi gucci,
Referring to the chart (DAX 2011/5/25-26) from your latest post (#2961),
Q1. If I understand correctly, the gaussian in the volume pane refers to traverse level. According to your annotation convention (#2885), that red thick line represents a down channel. A down channel consists of at least 2 down traverses and 1 up traverse. Would you further elaborate what information the green up fft are trying to convey, please?
(Please refer to the attached chart)
Q2. According to the gaussian on bars 10:20 and 10:25 (2011/5/26), it indicates those 2 bars form an up tape. If I understand correctly, an up container has to break the previous down container on increasing volume in order to arrive point 2.
I can't see the up tape breaks the down tape on increasing volume in 5 min chart.
When I switch to 1 min chart, I also can't see the up tape breaks the down tape on increasing volume. The volume was decreasing. Why is it a up tape? Why not a down tape contiuation? Does it mean we need to follow the above rule for traverse level or higher levels? For tape level, we don't need to strictly follow that rule?
(Please refer to the attached chart)
Q3. The gaussian in the volume pane (from 2011/5/25 16:15 to 2011/5/26 09:30) is B2B2R2B2R2B2R2B2R2B. Is it something related to this ET post (Forums - Getting down and dirty is where the rubber meets the road ...
When do you know the sequence is expanded?
Q4. I am annotating last week DAX futures. An up channel started around 15:34 on 2011/5/23 and ended around 09:26 on 2011/5/26. Am I right?
Please correct me if I am wrong. TIA.
-
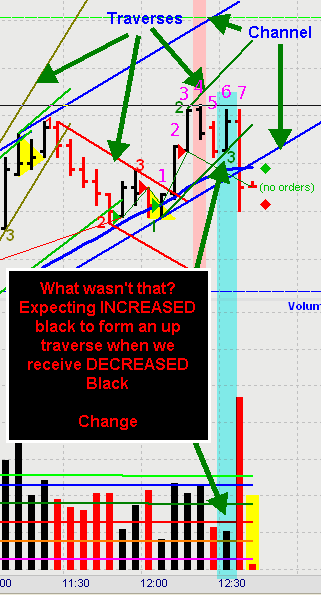
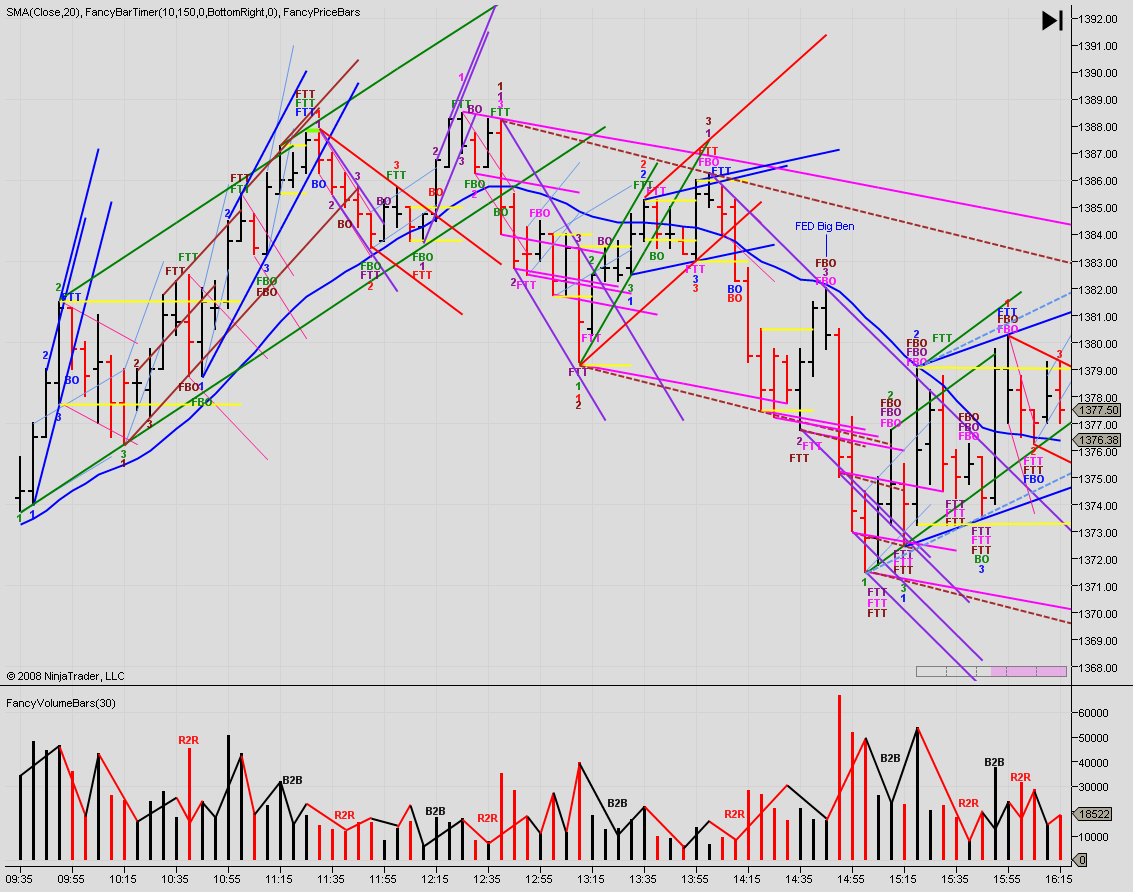
In the attached chart 1 (chart_1.png), bar 1 to bar 7 (the pink numbers) was the last dom traverse of the up channel. Gussian sequence of the last dom traverse was:
B2B(bar 1 to bar 4) 2R(bar 4 to bar 5) 2B (bar 5 to bar 7)
It was expected that last 2B (i.e. bar 5 to bar 7) should be increasing black volume, but what must come next (increasing black volume) did not materialize. Is it the idea of WWT?
My thoughts:
1. The sequence was complete, even what must come next (increasing black volume) did not materialize
2. When price fell below the low of bar 1, this confirmed the up traverse already finished. But can we know it earlier? I think bar 4(IBGS) and bar 5 indicated the last dom tape would be weak as volume of bar 4 was strong.
Would you correct me if I am wrong? TIA.
chart_2.png is the whole day (4 June 2008)
The original chart of chart_1.png is from Spyder and it can be found in:
-
Hi gucci,
For your posted DAX annotation charts, is the attached colour convention correct?
Please correct me if I am wrong. Thanks a lot!

-
Hi gucci,
For your posted DAX annotation charts, is the attached colour convention correct?
Please correct me if I am wrong. Thanks!
-
Sorry for any ambiguity.
What is the taxation treatment for foreigners speculating Australia SPI, Japan Nikkei 225 and Korea KOSPI 200 futures? Do they have to pay the capital gain tax or income tax in these countries"?
-
Do I have taxation treatment for trading Australian SPI , Japan Nikkei 225 and Korean KOSPI 200 futures if I am a foreigner?


The Price / Volume Relationship
in Technical Analysis
Posted
I am far from the trading stage. I seldomly watch the market at real-time.
I only annotate the static charts. I annotated ES, DAX and KS static charts but unable to annotate correctly.