
Welcome to the new Traders Laboratory! Please bear with us as we finish the migration over the next few days. If you find any issues, want to leave feedback, get in touch with us, or offer suggestions please post to the Support forum here.


Boux
-
Content Count
23 -
Joined
-
Last visited
Posts posted by Boux
-
-
What do you mean they "transferred" it to you?The shares were transfered from a holding company to my broker....no shares were actually sold.
You say you assume it's a gift? You mean you don't know?
Yes, it was a gift but does the IRS see it that way?
Did you pay any money for it? (A sale)
No
Did you do any services for it? (Remuneration)
No
Did you give up other property for it? (An exchange).
No
If it was a bona fide gift, there's no tax consequence to you at the time of the transfer, but there may be tax consequences to them if the gift exceeded the annual exclusion for tax-free gifts to you.
FMV does exceed the annual exclusion
If it was a gift, your basis is the LOWER OF their basis OR the FMV of the stock at the time of the gift. If it's a publicly traded stock, the FMV would be simple to determine. Your basis is used to calculate your gain or loss when you sell the stock. What this means is, if your parents had a realized (but unrecognized) loss in the stock at the time of the gift, that loss went unused.
I can document the purchase prices and there was a sizable unrealized loss but is my cost basis calculated on the purchase price or price at the time of transfer?
I missed your response---its the lower of the two-----thanks
-
Hi
I am at a loss on how to handle this situation. Hoping someone can point me in the right direction.
My parents transfered stock to me. Current price is significantly lower than purchase price and I am going to have to sell some of it...... is it income to me or a loss?
If income, what is my basis?
I'm assuming the transfer is counted as a gift...but how do I report it?
If there is a better forum for these questions I'll be happy to move along.
Thanks
-
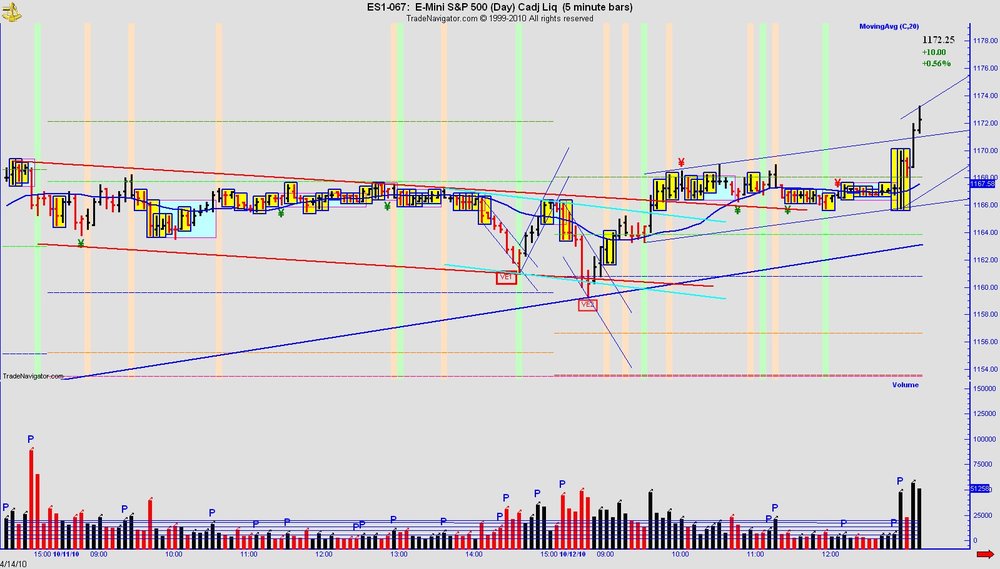
I am not saying this in any way to be critical!,,,,,but it points out a significant weakness of any forum context: words can be misunderstood and filtered.The blue note on my chart "nondoms do not complete" did not refer to laterals, but to the fact that-in "rolling" marlets (markets that keep pushing out the RTL, often on decreasing volume), nondom legs often do not complete. In fact, this is a way to recognize that you have entered a a "rolling" environment... why is it important to recognize this context? Because your shorts become countertrend trades, the market keeps breaking the RTL but then going up... you see the breakout, wait for the pt 3, and the trade fails....etc....
hth,
Vienna
My mistake-------suppose I was projecting my own opinion---I often see the BO of lat's in a direction I did not anticipate (completion) and thought you were seeing a similar thing.
I appreciate your contributions in all of this.
-
I have struggled to comprehend any consistent interpretation of laterals in general but do think they are significant pieces of the puzzle. I certainly agree with the note in the above chart that....non-dom. lat's may not "complete" as do most Dom ones.
Also of late I have been trying to sort out the effect of Pace Acceleration on lat formation. I see a definite cause and effect in those instances when I correctly identify PA.
Can anyone point me to discussions that might help regarding these accelerations??
-
don't understand what you mean.what about it?
Sorry---wasn't clear.
Do I need an indicator to color a price bar based on it's Close--ex. Green bar for a close higher than the previous, Red bar for a close that is lower
and Green volume bar for an Up close, Red bar for a Down close
or does Multicharts do this and I'm just missing what's right in front of me???
Thanks
-
Hi
Love your indicators---I'm trying to set-up Multicharts for Hershey trading. Can I color bars by close or do I need an indicator? what about volume?
You seem to be well versed in PricePhysics as well---which do do trade the most?
I've recently been looking at Bill's stuff again.
Thanks
Allen
-
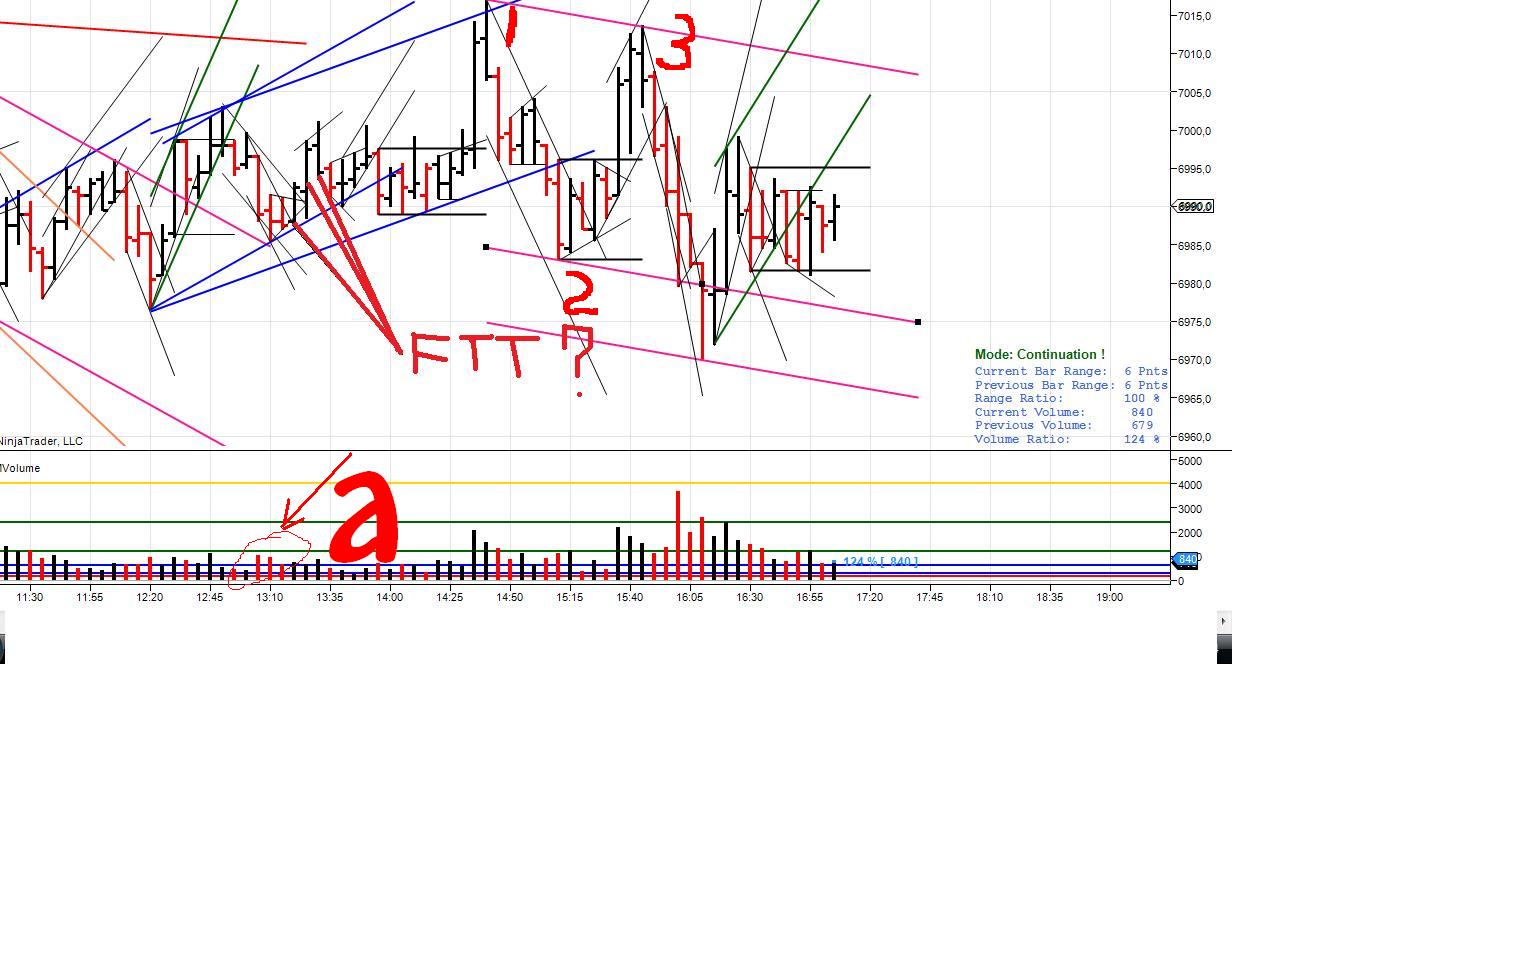
Thanks Gucci for the chart ---it highlights a few of my delimmas and I'm hoping to sort some of them out once and for all.
In my opinion
1) We can't have FTT at any of these bars because we have yet to have return to Dom---as defined by Vol. on a level of that at red "a" or previous black peak???? I'm just guessing for in realtime I would have seen the 2nd bar as a Jakari change and the 3rd as FTT for sure
2) On an unrelated topic----how can Pt. 1 be a FTT when it does in fact traverse and even extend on what seems to be an acceleration of Pace??!!!!
3) Assuming FTT at Pt.1, how can Pt. 3 be so far into the previous up traverse?? After the BO of the lateral at Pt.2 (which moved so far into the previous) I would have ceased to look for Pt.3 and assumed an error in annotation leading to a continuation of Dom. Up
Could anyone give some insight---
Vienna--I really appreciate your questions and can relate to your frustration.

-
Who could have known?
Who indeed??
I would have said it was complete @ 10:10 or 11:55 for sure.
Hints????
-
. The first one lets you anticipate a new point 3. The second one doesn’t. Jack explained that very thoroughly in his post, link to which was posted by cnms2 in this thread.Funny how the chart of Spydertrader with two VEs didn't evoke much interest.(the chart Spyder posted in this thread)
I'm still struggling with what to "anticipate" with regard to VEs. I finally came to grips with the chart that Spy refered to---I was sloppy with accel the container and the 2nd VE clearly failed in that container. But in your example the bars following the accel's. seemed to do exactly the same thing except the 2nd was higher volatility and nearly the same volume-----so a 2x4 in my general direction would be much appreciated
-
You might start by asking yourself why some of your Point Three's aren't connected to a Right Trend Line.Don't Point Three's create the RTL by using Point One?
- Spydertrader
I get the feeling that I am still missing something?
-
If one has set as a goal to locate an FTT (Failure to Traverse), how can the market fail to do that which it has already completed? Has not Price traversed its container by creating a VE?- Spydertrader
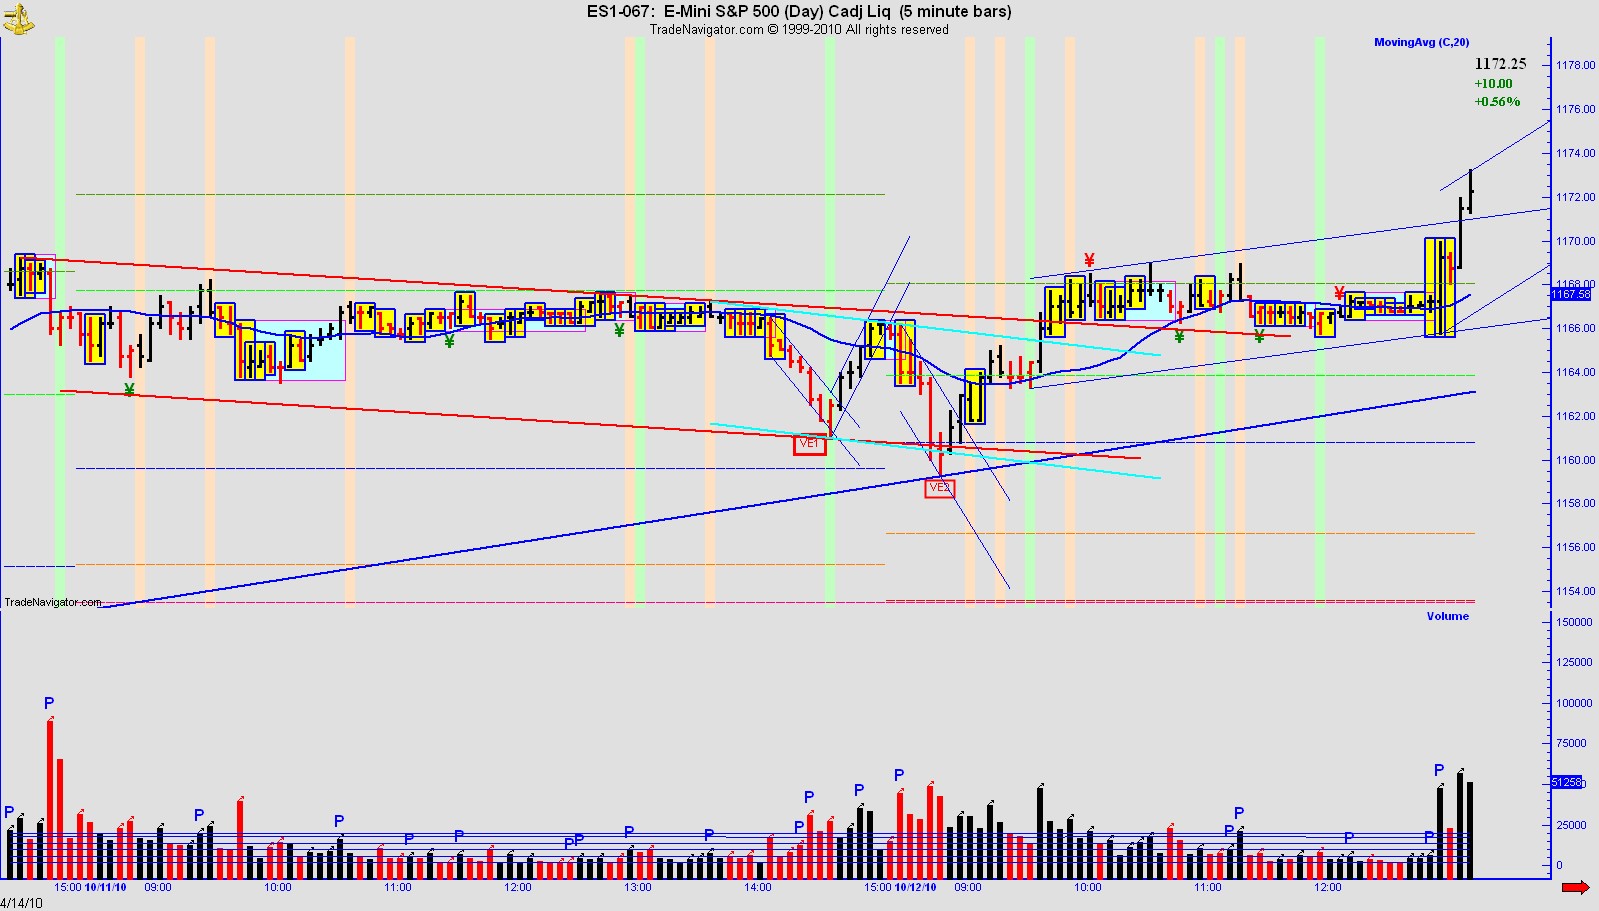
Quite logical---and I'm studying Jack's posts about accelerating RTL, closes in the zone, no FTT on VE(yet he implies that they do happen) etc. and still have confusion after I see what happens in the attached---isn't VE2 a valid VE on higher vol. than VE1?
And yes, I know context is King and it is up to me to see what is right in front of me---so here I am, just trying to see.
Thanks---I trully appreciate your time
-
1. Yes.2. A period of doubt and confusion trying to decide if a new thing started or if the old thing is still going.
3. A period of doubt and confusion.

:crap:
Hey! I resemble those comments!!
-
Didn't you see a VE just prior to the area you referenced?What must come next after the market creates a VE?
What did the market then provide?
- Spydertrader
1) Yes
2) In all honesty I have yet to figure that out ( I presume by the question that there will be some form of continuation?)
3) Seemed to be another B2R
-
Monday, 11 Oct 2010.I am anticipating resumption of short trends on several fractals very soon.
MK
Very nice MADA!!
But I have to ask--What told you this?----I saw a very "clear" B2B yesterday afternoon and have been lost this morning as a result.
Thanks
-
A few people were having trouble viewing the videos. It's a codec issue in Windows Media Player.For Windows Media Player download the K-lite Codec Full or Mega pack:
k-lite codec downloads - Free software downloads and software reviews - CNET Download.com
Or to skip the Microsoft issues altogether, download VLC Media Player:
VLC Media Player - Free software downloads and software reviews - CNET Download.com
Loaded both and still get "address not found"
Suggestions??
-
I'm reviewing some postings from past journals on ET.
Seems emphasis and perspectives have evolved to some degree. (just my opinion)
The FTT is the key to
the entire methodology. -Spyder
Spyder would you say the FTT is still the key or would it be volume sequence or something else----or is it different for each individual?
Just curious as to the perspective that time and experience has created.
-
Thanks Spyder for pushing this through---looks great----such a cleaner chart now.
Appreciation!
-
Thanks Spyder---I'm learning some things from all of this-----and I also see why you haven't done more of it---much appreciation!
-
So----- Pace acceleration and bad vol. data
These make sense although I have trouble consistently interpreting PA.
PointOne--I saw the accel. trav. and the VE's but a little late. So you can't have a valid PV on a VE?? But a VE with decreasing vol. is a change signal or simply warning sign?
Thanks all !!!
-
Peaking volume and then JW
-
Any insight into why 15:40 and 45 (in yellow) are not change????
-
Tuesday, August 11, 2009.Hi Romanus,
I'm working on drawing guassians and found something on your chart that continues to trip me up---beginnig at 15:50 there are 3 consecutive IRV bars that cross a RTL---yet you draw the guassian as DRV.
What is there to support this view other than the perceived point within the current cycle (B2R2B)
Obviously, this a.m. proved this view correct---I just wish it made sense to me.
Thanks


The Price / Volume Relationship
in Technical Analysis
Posted
I want to work through these channels---was wondering if anyone had some un-annotated charts for the 13th, 14th and 15th----my data doesn't go back that far.