
Welcome to the new Traders Laboratory! Please bear with us as we finish the migration over the next few days. If you find any issues, want to leave feedback, get in touch with us, or offer suggestions please post to the Support forum here.


NYCMB
-
Content Count
76 -
Joined
-
Last visited
Posts posted by NYCMB
-
-
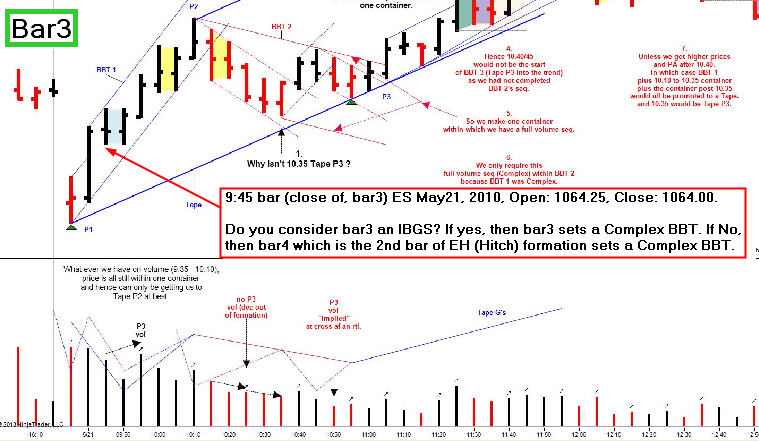
The attached chart is of May 21st 2010.See Spyders post # 1835.
I've added some notes.
It might hopefully help to explain, in this example, how volume relates to price
for BBT 2 in so far as BBT 1 being Complex.
And so help with knowing when and if we have a Tape rather than a Traverse etc..
hth
Hi Filter Tip,
I have question regarding the definition of IBGS.
9:45 bar (close of, bar 3, May21, 2010, Open: 1064.25, Close: 1064.00. Do you consider bar3 an IBGS? If Yes, then bar3 sets a Complex BBT. If No, then bar 4 which is the second bar of EH (Hitch) formation sets a CompleX BBT.
Could you comment? TIA
-
Can anyone post this chart without annotations? (preferably from Trade Navigator)H.
Hi Heisenberg,
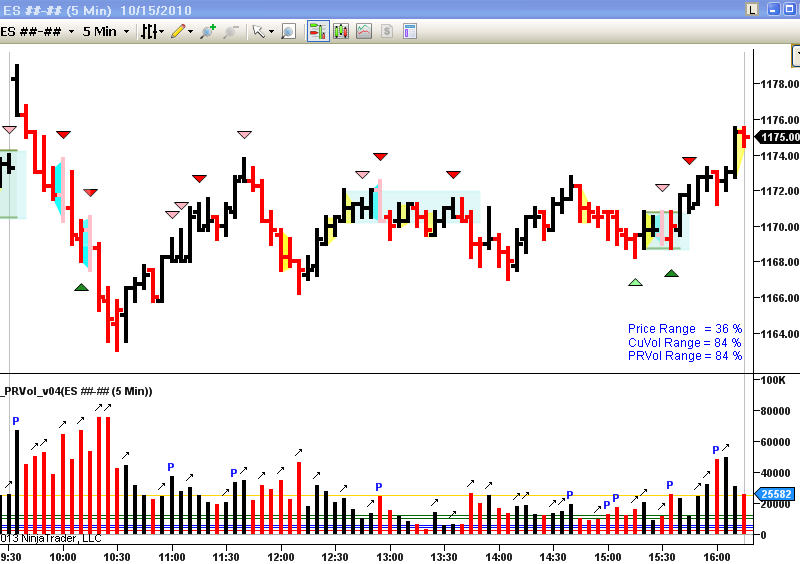
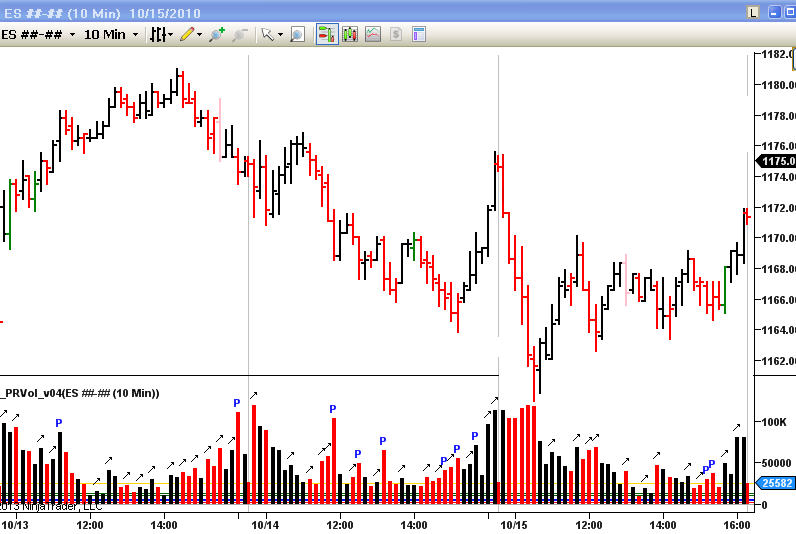
Two charts for you, they are from NinjaTrader. The 3-day chart is 10-minute and degapped.
-
There are definitions for Laterals.
Dominant Laterals and Non- dominant Laterals.
Laterals we are permitted to annotate through and
those we are not permitted to annotate through.
hth
Hi Filter Tip,
My questions are regarding to the quotes above.
S...Filter Tip: There are definitions for Laterals.
Dominant Laterals and Non- dominant Laterals.
Q...NYCMB: What are definitions for Laterals?
What is Dominant Laterals and Non- dominant Laterals respectively based on your conclusion of research? Could you provide rules and chart examples for both?
S...Filter Tip: Laterals we are permitted to annotate through and
those we are not permitted to annotate through.
Q...NYCMB: Could you provide rules and chart examples for both? TIA
-
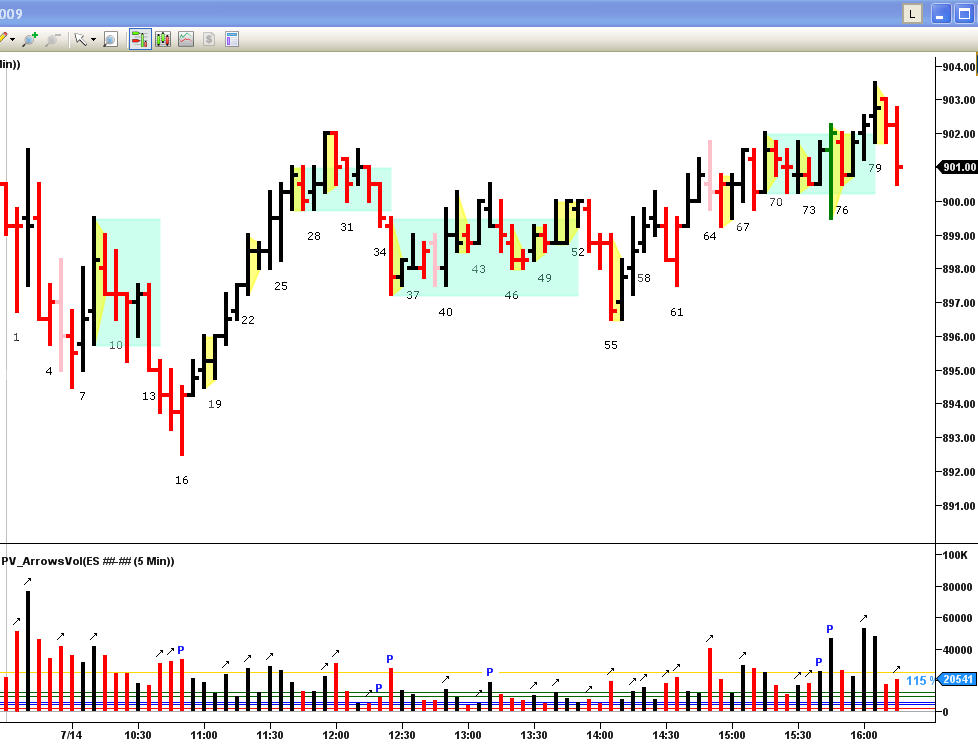
The attached two degapped charts are for Spydertrader 07/14, 2009 drill which has been under discussion recently.

-
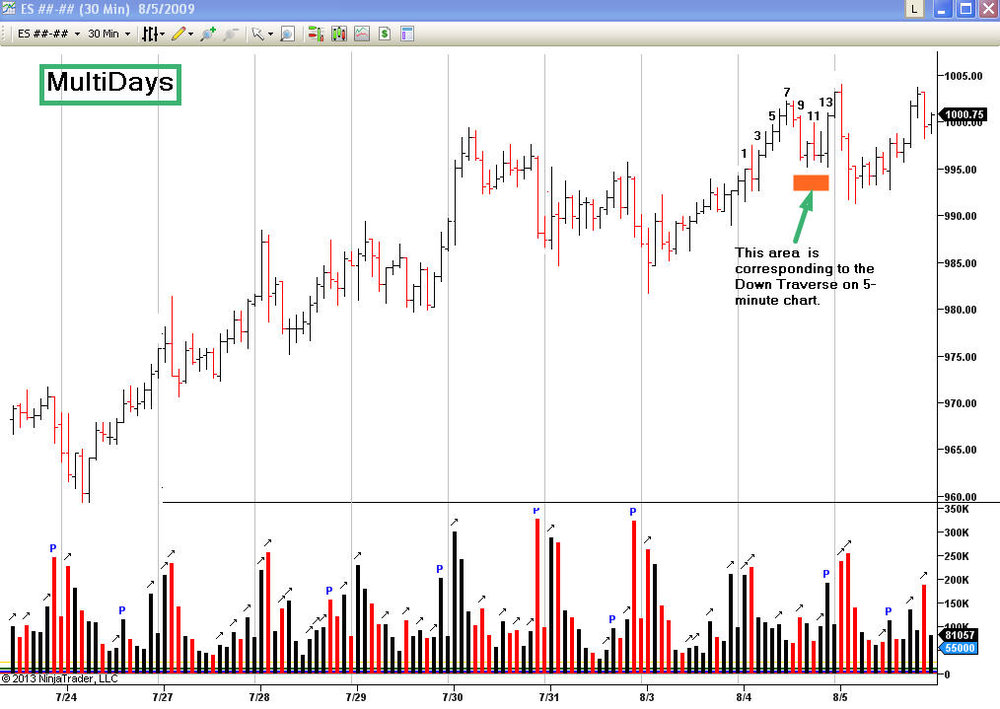
Don't forget the RTH pace.Hi cnms2,
RTH pace, Dominant volume slope and Dominant volume slope make my pea brain spinning. Attached is a multi days of 30-minute chart and PV relationship is very tricky. Could you kindly annotate the chart with RTH pace rule being applied and some brief explanation? TIA?
-
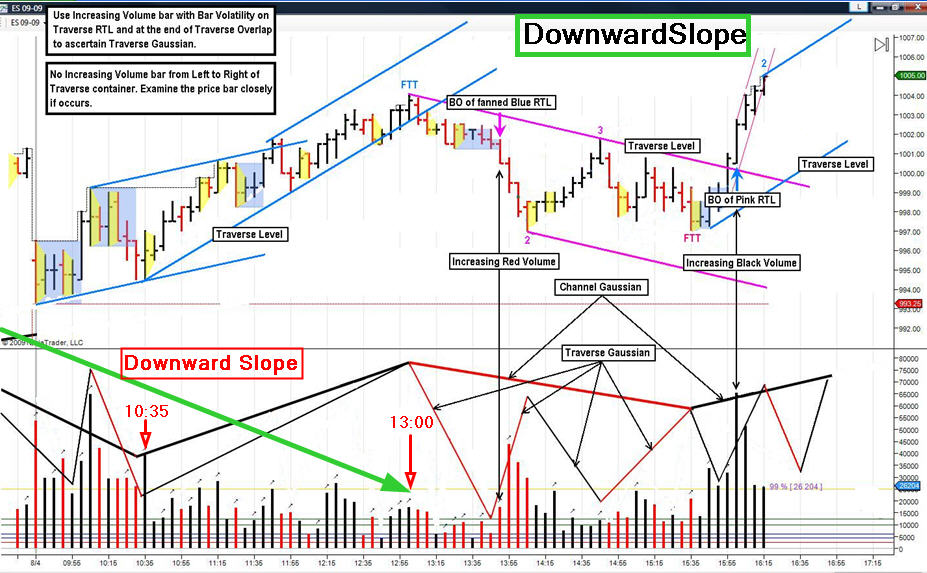
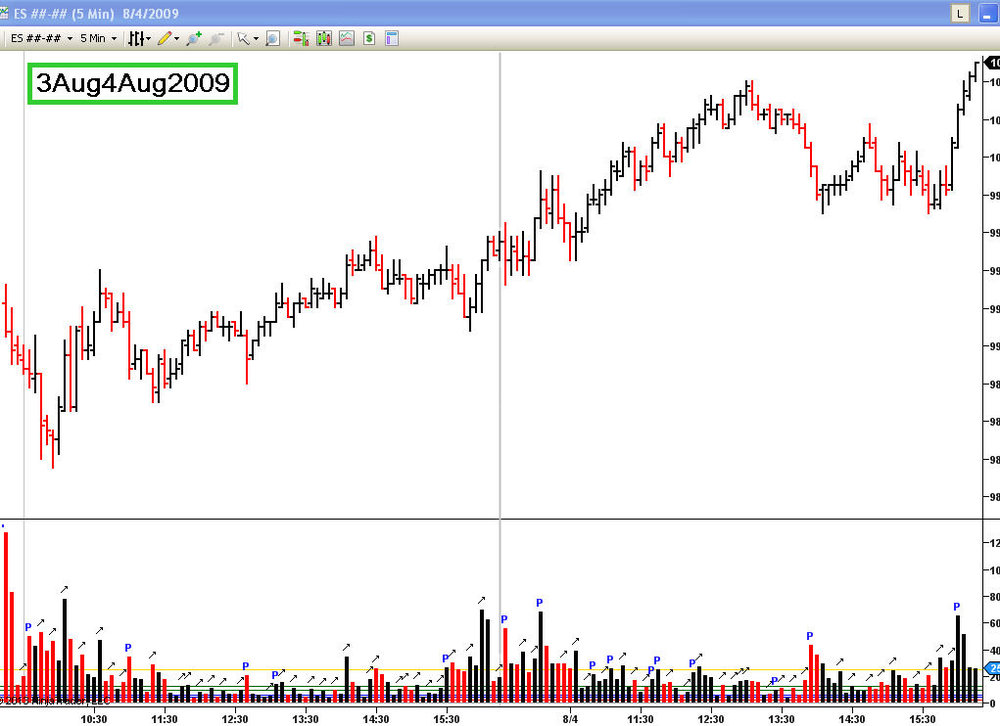
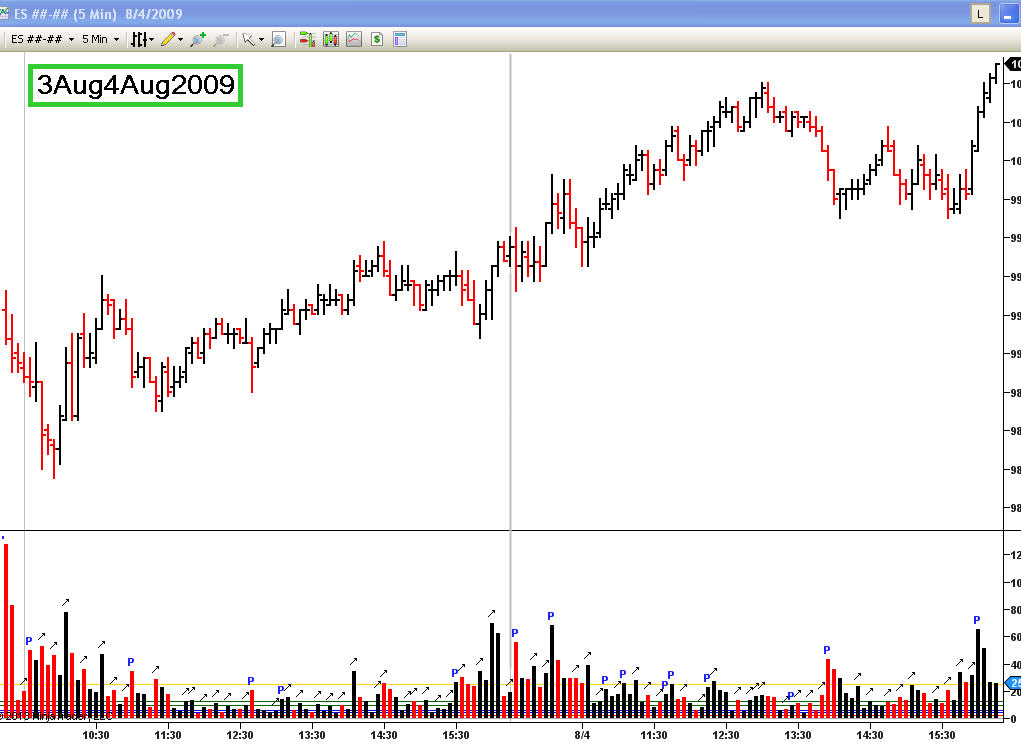
What you see is what you get. Look at ehorn next-day's chart I posted too.Hi SK0,
As shown on your annotated chart, there is a down slope of volume from the market open till 13:00. How do you know that you have a dominant traverse? Please see the attached 3Aug4Aug2009 for two full days of chart. TIA
-
I am not an achieved and wholly JHM student as I don't depend on geometry very much except for the obvious cases. So I would have a hard time to "comment" from your perspective.I have written a brief note on how I see the last 15 bars on 12/26/2012. If it confuses you, just drag the file into the trash bin.
Good trading.
Hi SK0,
Is my chart coorrect regarding to Dominance and Non-dominance based on slope?

-
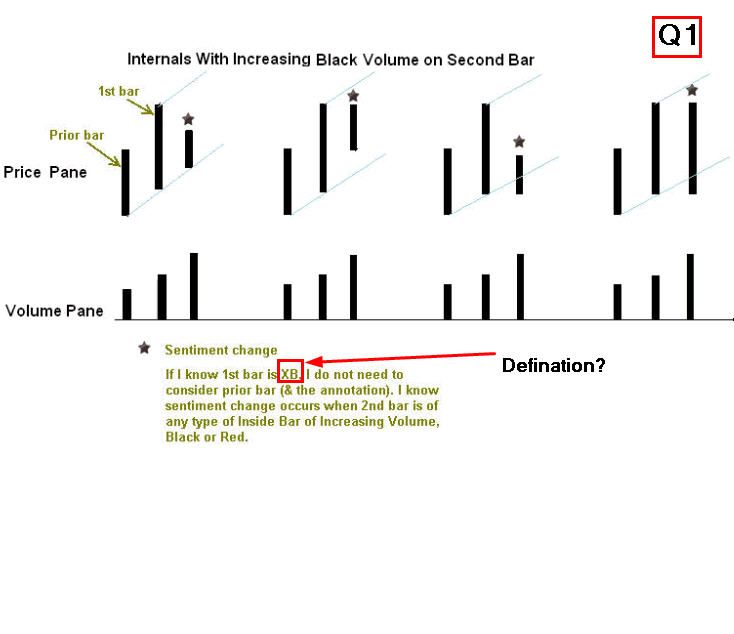
The attached picture shows my opinion.Hi SK0,
How do you define your XB? Please see the attachment. TIA
-
Sure thing.- Spydertrader
Does anyone know the logic why Spydertrader painted those bars in Red or Black?
TIA

-
Thanks cnms2 ... I'm sorry too:bang head:I am a secondary Maths teacher. I have always found that Maths came easy to me, and I am amazed sometimes at how some of my students struggle with things that to me are so easy.
But its seems that with regard to trading, I am ironically in a similar situation, after years of reading threads and staring at charts :doh:
I read a quote from Spyder about the maths of trends, quote "The second derivatives of Price and Volume define a trend". The second derivative of a function changes sign well in advance of the function value (which only changes direction when the first derivative changes sign) and I don't know how the second derivative of volume let alone both together would work... but thats not my main question.
I am posting an old chart of Spyder's from ET, with the tapes and traverses annotated (by Spyder). I have annotated the Gaussians. I would like to know if my Gaussians are correct and if not what I should do differently. Secondly, Spyder's point 3 of the blue traverse occurs on an IBGS, WITHOUT INCREASING VOLUME. My understanding is that for a point 3 to be a point 3 there must be increasing volume, I would appreciate any comments about this i.e. am I being too rigid, what about the bar before with increasing volume and decrease volatility, ibgs means "guassian shift whether on increasing volume or not etc. I started reading some of Spyder's posts at the beginning of the thread. He says "unless and until the Volume Cycle Sequences reach completion, the current Price Trend cannot end". I understand volume sequence (up trend) to mean b2b2r2b with the last 2b being increasing volume after point 3". I cannot reconcile my understanding to the attached chart:confused:. If somebody could enlighten me I would be most grateful. TIA.
Hi 203NG,
Is the chart for ES 18June2008? TIA
-
Hi gucci,Thank you for sharing your insights of the market. I'm not able to find reasonable answers for myself after trying. Could you kindly give correct answers for the questions listed on the attached chart? TIA
Hi TL moderator,
Could you delete this post (# 2955)? I made a mistake by mismatching chart with post. TIA
-
You confused IBGS with a spike bar.(FF FTT is a spike bar which is actually the point 2 of the blue trading fractal traverse)
10:10 AND 10:15 bars are VERY important, why?
10:40 bar speaks volumes, find out why.
Compare and contrast 10:40 bar with 10:50 bar.
Note how the declining black gaussian is annotated starting with 11:00 bar.
On a side note keep in mind that the ftt bars usually show more volatility or "spikyness" than the point 2 bars.
More later...
Hi gucci,
Thank you for sharing your insights of the market. the following are my guessing works:
A. 10:10 bar ---closes outside Lateral Movement on increasing volume
B. 10:15 bar ---Signal of change. Reasons:
1) IBGS on decreasing volume
2) ftt of down tape starting on 10:05
3) ftt of 2-bar down tape starting on 10:10
C. 10:40 bar --- Red bar on increasing volume; but, its close is about one tick below the open which is at the top of the bar. Thus, 10:40 bar does not show down trend will continue.
D. 10:50 bar --- I can not see clearly the top of this bar. It seems the bar is either a Stitch -Short or OB-Short on increasing red volume and closes at the bottom of the bar. As usual, I have great difficulty to correctly anticipate WMCN regarding the direction of either a Stitch or OB.
Still, I'm not able to find reasonable answers for myself after trying. Could you kindly give correct answers for the questions listed on the attached chart which was slightly revised based on http://www.traderslaboratory.com/forums/attachments/34/24592d1305539570-price-volume-relationship-moreoverlap.jpg ? TIA
-
This is a VERY informative chart to study the interlocking of various fractals. Remember, noise does NOT exist.When studying the chart keep in mind:
"The pattern has a defined ending after point 3 and the three iterative refinements are part of dealing with the end effects. Any trip across the parallelogram on dominant volume after point 3 prolongs the parallelogram if and only if the volume dominates and price responds to "traverse". A signal is generated when volume no longer "pushes" price to a better place in the traverse. This occurance is an ftt." (Quote from Jack)
You confused IBGS with a spike bar.(FF FTT is a spike bar which is actually the point 2 of the blue trading fractal traverse)
10:10 AND 10:15 bars are VERY important, why?
10:40 bar speaks volumes, find out why.
Compare and contrast 10:40 bar with 10:50 bar.
Note how the declining black gaussian is annotated starting with 11:00 bar.
On a side note keep in mind that the ftt bars usually show more volatility or "spikyness" than the point 2 bars.
More later...
Hi gucci,
Thank you for sharing your insights of the market. I'm not able to find reasonable answers for myself after trying. Could you kindly give correct answers for the questions listed on the attached chart? TIA
-
Enjoy the drill. PAY, PAY, PAAAAAAAAAAAAAAY attention to the tapes and volume ...I'am in a good mood...

Hi gucci,
The attached chart was taken from your annotated FDAX March9, 2011. I got two questions after a closer look of the image---
A. What's the significance of the slant line which connecting bar 38 low to bar 42 high? Do you use it as a visual aid to determine something?
B. Bar 43 is a difficulty for me to read and anticipate WMCN because---
a. Bar 43 has increasing red volume and its close is below the low of bar 42.
b. Bar 43 broke the RTL of bar 40 to 42
c. Close of bar 43 sits on blue trend line and above forest green trend line.
Could you help to solve the stated questions A and B ? TIA
-
Enjoy the drill. PAY, PAY, PAAAAAAAAAAAAAAY attention to the tapes and volume ...I'am in a good mood...
Hi gucci,
Bar 10 is OB on increasing volume, bar 7 is IBGS. Do you treat bar 7 as Red bar? TIA
-
Your last black ftt should be FTT. And your last FTT should be ftt.HTH.
Hi gucci,
Thank you for your post pointing out bar 75 is FTT. Could you elaborate why bar 75 is FTT; and, bar 70 is ftt? Do you compare volumes of bar 70 with bar 75? TIA
-
Hi corey,Could you post a chart sample of Symmetric which you talked about in Paltalk chat room? TIA
Hi corey,
I meant Symmetry. TIA
-
thanks all for stopping by paltalk room. Monday is always the most active day, for the rest of the week I will do chat and chart as time permits.Hi corey,
Could you post a chart sample of Symmetric which you talked about in Paltalk chat room? TIA
-
already, room is open so you can check it out.I include a pic on paltalk features so you know what to expect.
here is what on menu
3 stages of a setup.
tone, lock and fire
1) if i see seq1+seq2+seq3 and x2x2y2x then I have the right tone
2) next after tone if I see seq1 and x2x then the setup is locked
3) next after lock if I see seq2 and 2y then I have the green light to fire
hence tone, lock and fire.
that is all I will focus on, good luck to all.
Hi corey,
Smart idea! You make the system good for the fifth grade.
Could you advise on the blocking issue? Please see the attachment. TIA
-
guys, I am on Paltalk daily, go to paltalk.com download and install paltalk. Important note: after installation add *.paltalk.com to IE restricted site so that paltalk can not popup on your pc. I dont use any other software as they all cost more resource than paltalk. Then go look for 'price action trading' room. This way we can do chat and charts in real time as end of day chart is boring to me. use the same name as paltalk name so I can recognize you.ps. paltalk let you create a room on the fly so if more people show up i will create a separated room just for mada people np.
Hi corey,
Thank you for Paltalk price action trading room. I hope I can figure out how to contact other 3 members on 31January2011.

-
Hi dear All,
Here is one more Christmas gift from SKO---
========================================================================
This is a graph that I made as a reference when I found myself confused in the nestling.
========================================================================
Big thanks to SK0-.
-
Hi Dear All,
I like to share with all of you an unique Christmas gift which I receive dfrom TL member SK0---
=================================================================================================================================
When it comes for a Tape to breakout RTL with increasing volume to form Pt 2 of a new Traverse, things can get complicated if one tape could not do the job. That is where a non-dom Tape followed by another dom Tape are needed to do the job of breaking out RTL with increasing volume to represent the first price movement of new Traverse which Spyder called it Fast Fractal Traverse. So, you can expect third price movement would be in Fast Fractal Traverse pattern too. As demonstrated in Gucci's charts, we could anticipate fanning after a FTT if we know the first price movement is a FF Traverse, not Tape.
==================================================================================================================================
-
This is a response to some specific questions asked by one of the users.Hi gucci,
Congratulations on your success trading JHM.
Are the chart notes in red rectangle for bar 15 or 20? TIA
-
Hi gucci,
Thank you for sharing your valuable volume comparison skills.
I have two questions for you---
1. You said: you could mentally (or actually) go to a higher (slower) resolution level and compare the highlighted areas---For the 5 minutes ES chart, what's the higher (lower) resolution level you suggest to use according to your observation? Do you mean to switch to10 min,15min, 30min or 60min in this specific
example?
2. You said: Furthermore you can compare the transition of the black volume starting after 11:30 - 11:40 area ---The chart under discussion is rs5's which is CST. Does your 11:30 - 11:40 area correspond to Bar 24 to Bar 26? TIA

The Price / Volume Relationship
in Technical Analysis
Posted
Hi innersky,
Thank you for your planning to code indicators for lateral formation. The updated rule for ending a lateral is here---
----------------------------------------------------------------------------------------------------------------------------http://www.traderslaboratory.com/forums/technical-analysis/6320-price-volume-relationship-501.html#post179301
Conditions that End a Lateral:
1. 2 bar closes outside that in of themselves do not create a formation.
2. OB (regardless of the bars close, on increasing volume over the previous bar) that pierces upper and /or lower boundary on increasing volume.
3. Up IBGS on increasing volume (over the previous bar) that pierces the lower boundary.
4. Down IBGs (on increasing volume over the previous bar) that pierces the upper boundary.
5. A close outside the laterel that would be a 3rd close outside but being a bar
subsequent to point 1 above.
(ie: 2 bar closes outside that do form a formation in of themsleves and hence would not end the lateral
but then a subsequent (3rd) close outside, after the formation, would end the lateral).
------------------------------------------------------------------------------------------------------------------------------
Please notice that there is Stitch with IBGS condition. I would like to provide necessary images of ending laterals if you need them for understanding the rules. May I ask you to update BarPaint2 (marks for IBGS) besides PV-BarFormations indie? TIA