Welcome to the new Traders Laboratory! Please bear with us as we finish the migration over the next few days. If you find any issues, want to leave feedback, get in touch with us, or offer suggestions please post to the Support forum here.
-
Content Count
525 -
Joined
-
Last visited
Posts posted by notouch
-
-
Interesting article. I think there has been a lot of political intervention to get the central banks to intervene. Only a few months ago the Bank of England was saying it's not their job to bail out banks that had made bad bets but now that's exactly what they're doing. It's just creating more problems for the future.
-
The close will be more telling than the open.
-
I voted excellent because of the indicators, strategies and charts you post. My only criticism would be your habit of rambling on and on before finally getting to the point. Succinctness is a virtue.
-
I've read the book. You couldn't build a trading system around it as too much relies on trader discretion. You'd be better off buying the book from Amazon and reading it.
-
There's a mug born every day...
-
You're only a gambling addict if you're losing.
You won't be laughing when I'm on top of that leader board.
 :stick out tongue::evil tongue:
 -
Any plans to add anything to the sports betting pool? It would be good to bet on English Premiership or European Champions League games.
-
Thanks, it's there. Your liquidity boost came at the same time the Fed announced its own liquidity boost.

-
I'm serious about having lost all my money :doh: I had a bad losing streak this morning. How was the money allocated? Was it $1 per 2 posts in the forum? I started this morning with about $250. I was sure there would be a way of borrowing more money so was a bit reckless.
-
I lost all my money. Can someone lend me some?
-
If you're talking about equities then yes holding a day trade overnight is a bad idea because of gaps. For 24 hour futures markets you can leave your stops in place to protect your profits.
-
I frequently hold overnight positions. I agree with Dalton when he says you're putting yourself at an immediate disadvantage if you must exit the trade at the end of each day. There are some circumstances where it is so highly probable that a continuation will occur in the overnight session that you're just throwing away money if you don't leave the position open. I would regard today as one such day where if you have a short position open and you decide to close it for no other reason than that it happens to be 1615 then you're just throwing away profits.
-
The problem with targeting the 1.5 level is that if EUR/USD = 1.5 then USD/EUR = .666! It's not surprising price backed away from that level. Who knows if it will ever get there. You're entering the trend very late.
-
ey notouch, the figures are correct, the application/calculation might not be.I'd be happy to be wrong.
Forex trading is through IdealPro not Ideal. Commissions are a fifth what you're quoting.
-
Hey, nice to see you back at the forum!Thanks. I've been focussing on forex trading with some nice set-ups on the 5 minute charts and a few fundamental trades here and there (long EUR/JPY since yesterday in anticipation of the Fed cut) so haven't posted here in a while. I came back to check if there's been much discussion on the rainbow indicator because I find that useful for getting into established trends. I post over at forexfactory more regularly.
-
IB hasn't got cheaper comissions than MB FX as far as I can tell.They charge normal retail traders 1 basis point * trade value in comissions ( e.g. 100k USD * 0.0001 = 10USD ).
If you trade a lot you can get it down to a tenth of that, but that'd require a bunch of money. Besides their reviews are worse than the others, mostly because of their support.
IB are much cheaper than MB. I don't know where you're getting your figures from.
-
How original! Another "Favorite FX Broker" thread! :crap:
Interactive Brokers seem to offer the best spreads and cheapest commissions and they're a STP/ECN broker.
-
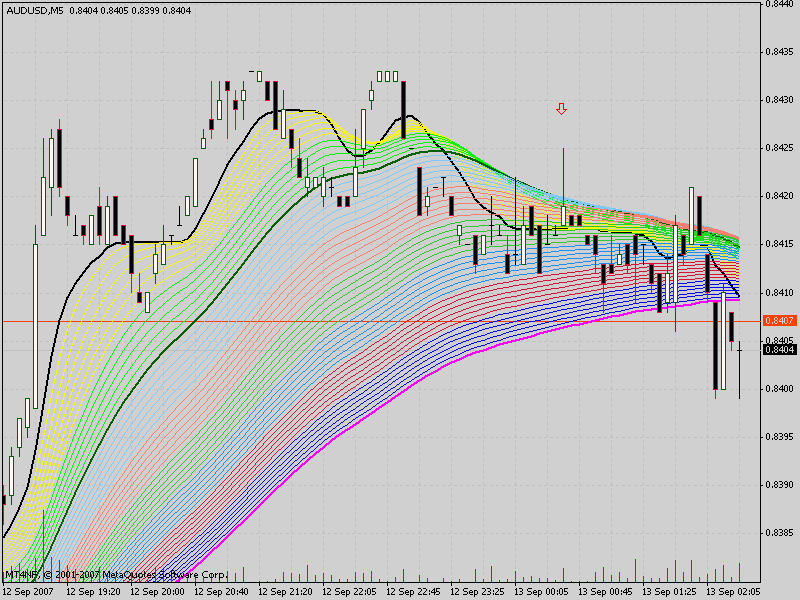
Would you call that countertrend? I thought that because the black line was below the green line, it was an example of one of your "Trend Trades" or is it only a "Trend Trade" when the black line is below the magenta line? Do you consider it significant when the black line crosses the green line on the 5 minute chart or is that for exit only?
-
Have you considered ditching the 1 minute chart and using 5 minute candles instead? You have me hooked now so I was looking at the price action on AUD/USD during the Sydney session. I noticed the black line crossed the green line, then there was an "icon" pullback which culminated in a shooting star candle. That would have been my entry for a short scalp. The shooting star I'm referring to has a down arrow above it.
-
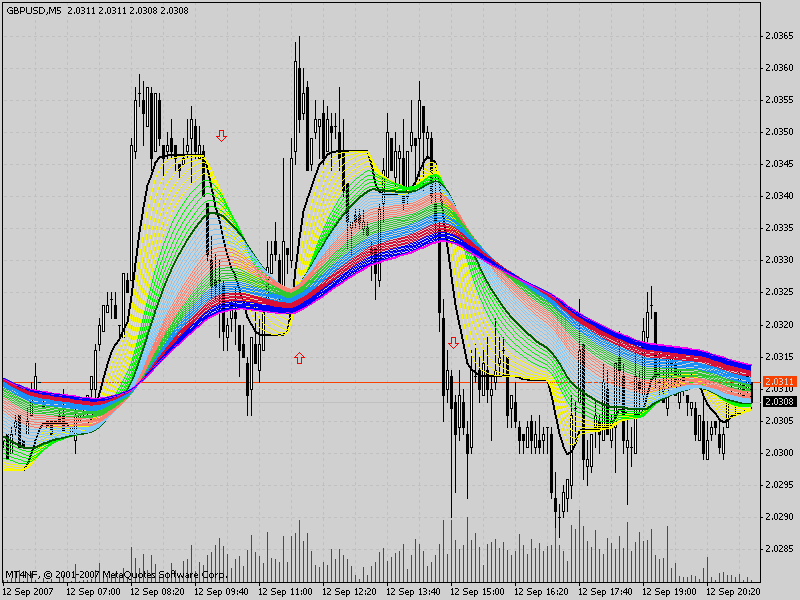
You mean the horizontal black line? This is definitely one of the strengths of the method because it should keep you out of choppy markets. The only problem is that you will often miss the start of a new trend. Also sometimes choppy markets give great trading opportunities (like today's GBP/USD). But as an indicator to distinguish between choppy and trending markets it's one of the best I've seen.
-
You could short NYBOT Dollar Index futures.
-
Thanks for that walter. It's starting to make sense now. It's a great thread but your explanations are a little long-winded if you don't mind me saying so it's taking me a while to work out what this method is all about. Here I'll try to explain it as succinctly as possible:
1) Identify the trend using a 5 minute chart. If the black line is above the magenta line = up trend. If the black line is below the magenta line = down trend. Black line should be sloping, not horizontal.
2) Expanding rainbow = strengthening trend. Contracting rainbow = weakening trend.
3) Black line pauses after it crosses magenta line. If there is subsequent continuation = good trade may follow.
4) Complete rainbow above magenta line = very strong up trend. Complete rainbow below magenta line = very strong down trend.
5) If all the above are met and it looks perfect = possible trend exhaustion.
6) Time entry using a 1 minute chart. Wait for pullback ("icon") then when black line crosses green line = enter trade. (Not sure what the relevance of the rainbow is here).
7) Scalper exit when bar gets inside the rainbow crossing the black line or trader exit when black line crosses green line.
Is that a fair summary?
-
Here's a chart of this technique applied to today's GBP/USD action. If you wait for the candle to close after the crossover, you would have got into these trades very late and probably would have taken a loss or breakeven at best on all of them. I used arrows for the "best case scenario" trades. These are 3 trades that I would actually have taken because the signals occurred at a time of day when forex is tradeable. I might even have been chopped out a couple of times in between trades 2 and 3. Have I misinterpreted this technique or does it not work very well on GBP/USD or was it just because today's action was very choppy?
-
Hi Walter,
One of my forex trading strategies is a basic EMA crossover strategy on the 5 minute charts so I'm interested to see if this new rainbow indicator is any better. Unfortunately that link is now dead. Care to upload the indicator to this site?


Holding overnight positions
in Futures
Posted
If you're going to actively trade during the Australian and Asian sessions why not trade Australian and Asian stock index futures?