
Welcome to the new Traders Laboratory! Please bear with us as we finish the migration over the next few days. If you find any issues, want to leave feedback, get in touch with us, or offer suggestions please post to the Support forum here.


Anonymous
-
Content Count
459 -
Joined
-
Last visited
-
Days Won
1
Posts posted by Anonymous
-
-
That is just what I heard. I do not trade it and could certainly be wrong.
P.S. I wasn't going to mention THE DRIVE to spare your feelings, but since you brought it up....It's on!!!!!

Don't be surprised the next time we are having an agrument if I don't just utter those two beautiful words. LOL
-
Perfect today. Note the HUGE action happening here in the circled bar right at VAH...you can also see a diverging delta, showing selling waning, and then BAM!!! You could also notice the increasing volume coming into that VAH. While this may lead some to think that we will go lower...VSA makes you wait for confirmation
Good thing...that abnormally large volume spike with closing price in the middle of the bar is showing you right there that professional activity has come into the market.
How cool.
Nice observations.
A wide spread down bar (close lower then previous bar) that has ultra high volume and closes in the middle of its range is a telltale sign of a transfer of ownership.
The fact that this is happening at the VAH is of no real surprise either. These areas tend to be where Professional Money will show itself. That is why Gavin talked about the importance of (1) volume (2) support/resistance.
For me, what is more important than how one arrives at the support/resistance area, is that one PAYS ATTENTION TO PRICE at these areas. That is, going long as price trades down to these levels makes little sense no matter how "proven" the support area may be. Paying closer attention to what price is doing at this time, however, does make sense.
Support/Resistance areas can not always hold. Otherwise there would be no such thing as a trend. Hence what we really want is to force the Professional Money to show itself in these "expected" areas. Their intentions-to go thru or to respect the area(s) can be seen on the chart.
-
BF: I'm a Broncos fan, but that doesn't mean I can't be a fan of yours
Would love to see some charts.
Also have a trading 101 question: What is the difference between a tick chart and a Volume Chart?
VSA tells us that volume=activity and thus tick based volume works where actaul contract volume is not offered. Do you believe the same?
The Russell doesn't release volume during the day, only tick volume, would you thus not trade that market or just use ticks?
-
Here's a nice example of a bullish white hammer pattern and an invalid hammer pattern (as per the pattern being discussed) .
Remember: a hammer is hammer line until and only if it completes thus transforming into a hammer pattern.
-
If you guys are going to get serious about candlestick trading, you need to read Steve Nison's books. Just start there. He has the best books on candlesticks hands down.Idea for MrPaul and others looking/trading with candles and volume - if you like the combo, simply use Volume Based Charts instead of time based charts. You will find:
- Time based charts will NOT allow you to participate in fast moving markets as the candles can become VERY skewed.
- Do you normally stare at your watch while trading? If not, time based charts have a fundamental flaw.
- Why take up screen space with a chart that has candles and volume separated, when it can be combined into one neatly presented chart?
Keep in mind guys, candlestick trading is my bread and butter. If you are new to this, make sure you study it first and get confident before placing real money on the line.
A few pointers:
- Decide if you are trading with the trend or against it. Candles can be used in both scenarios.
- If you trade against the trend, make sure you have a hard stop in place and honor that stop.
- On an intra-day basis, be 'flexible' with your candle patterns. In other words, do not sit and wait for the picture perfect hammer.
I'm sure that a simple volume based candlestick chart will not be 'enough' for some people reading this, so good luck with finding the right indicator(s) to use in conjuction with this. There's always going to be trades that the indicator(s) 'save' you from and others that prevent you from making money.
Once again, the key is consistency.
Just a couple of questions and observations:
1. BF, what do you think about Mark's approach? His knowledge of candle trading is far beyond what most sites have to offer? (Mark ((NA)) is a trader on another forum-I am sure you know of whom I speak)
2. Have you done any research into WRB's - Wide Range Bodies ?
* I like the idea of a chart picking up speed as activity picks up. But one needs to be able to compare volume in x period of vs volume in period x+1. Time is the fourth dimension. It is not a random concept.
Your body knows when to sleep and when to be hungry. Your body knows when to age and when to die. Time is elemental.
If you are looking at volume candles and you say the chart is speeding up, are you measuring distance X time ? So time plays a role in the perception of the chart being created. But with no way to make relative comparisons. Plus, the close of a period (1 min , 2 hour, or day) is the last agreed upon price for that TIME. Note a certain volume number. That is, the emini closes at 4:15 regardless of contracts traded. And since this the last price that buyers and sellers come together, certainly it is of some import.
- Time based charts will NOT allow you to participate in fast moving markets as the candles can become VERY skewed.
-
Soultrader,
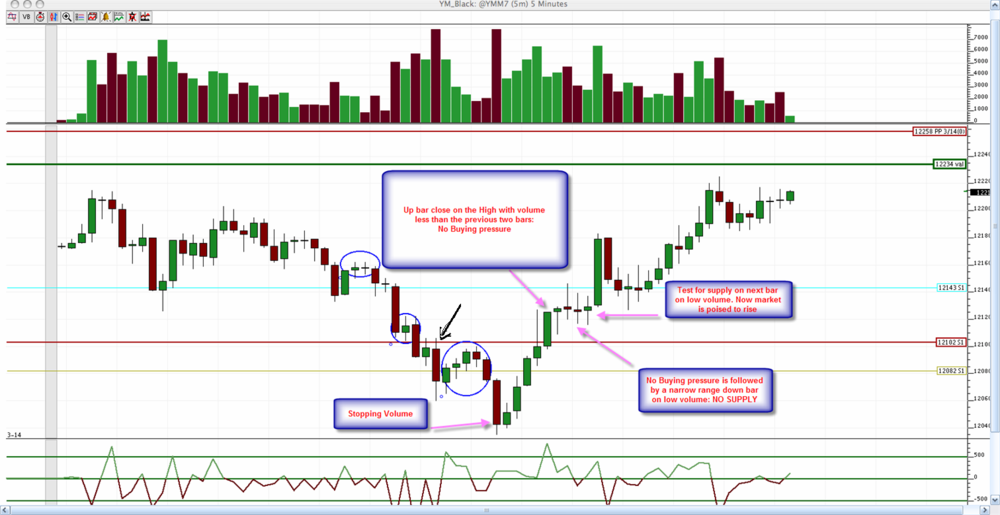
The No Buying pressure is a bar that closes up from the previous bar and closes on its high but has volume less than the previous two bars (and ideally volume less than average).
Although price is moving up, the Smart Money is not involved in the push. Remember, 85% of the volume histogram represents Professional Money. So no buying pressure is coming form the pros.
The next bar is down. But here too we see a lack of Smart Money activity. Thus when we say, No Supply, we mean no supply (selling) from the Professional Money.
What is happening is this: the market is moving up, but the Pros are not yet fully interested. Why? After such a move down they want to make sure there are no more sellers left in the way of an up move. As they wait to see what happens the market moves up but then stops. The next bar is down on even less volume. The Pros did not step in and start selling (no supply).
Just to be sure there are no sellers, the Smart Money now Tests the market on the next bar. They take it even lower and find no sellers (volume is low) and thus take price back up to close on or near the high.
Once we see the Stopping Volume we should begin to look for a No Supply or Test bar. When we see the No Demand, we do not automatically look to go short. So our bias isn't changed. We see strength in the form of the Stopping volume and are looking to go long. The No Demand helps set up the subsequent No Supply and test formation.
-
Pivot, thanks for contributing to this thread, I find this method extremely useful and fascinating. I've been trying to learn the relationship between the price and volume in groups but never seen a bar by bar analysis until now.One question about your analysis from the previous chart, I noticed that there was a stopping volume brown bar before the true bottom. Can you tell me why this was a false bottom or at least explain action between the previous pivot low to the bottom bar.
I wanted to ask you if using tick charts work in VSA or not. Thanks.
Good eye. As you know there is a thing called momentum. Sometimes price continues moving the way it was despite the force in the opposite direction.
After seeing a wide range bar with ultra high volume, you want to start looking for No Demand, No Supply , Tests, and Up Thrusts.
-
Hope you don't mind, TinGull but used your chat to show something. Just a couple of things to look for.
One note on stopping volume. Tom Williams, the father of VSA, would enter on the close of that bar. TG, however would not place a sign of strength until the next bar closes and is an up close. (2 bar pattern).
Getting in at the very bottom or top is not the most important thing. Here the best entry is after the test. Why? Because we have seen the strength come in on the stopping volume. Then we see a No Supply indication followed by a test for supply.
The Smart Money wants to make sure that there are no sellers out there to impede the mark up phase. That is why they test the market. Of course, the mark aggressive you are as a trader the earlier you would enter. But you should be looking for the bar after the volume spike (stopping volume) to confirm before entry.
-
Hello guys,I have a litte trouble understanding volume demand bars after a selloff. I have attached a chart from yesterdays action. The rectangle box shows couple sell volume spikes.
My questions is this: How do you watch for demand bars after that spike? In the first rectangle the volume spike is created by a doji. The next price bar closes above the high of the doji... this occurs on lower volume. How do you intrepret this? To me it seems like supply is cut off but price continues to drop.
The same thing occurs in the second rectangle box. Volume spike is created on a down bar but the next bar closes above the low of the previous bar.
Any advice would be appreciated. Thanks
Soul,
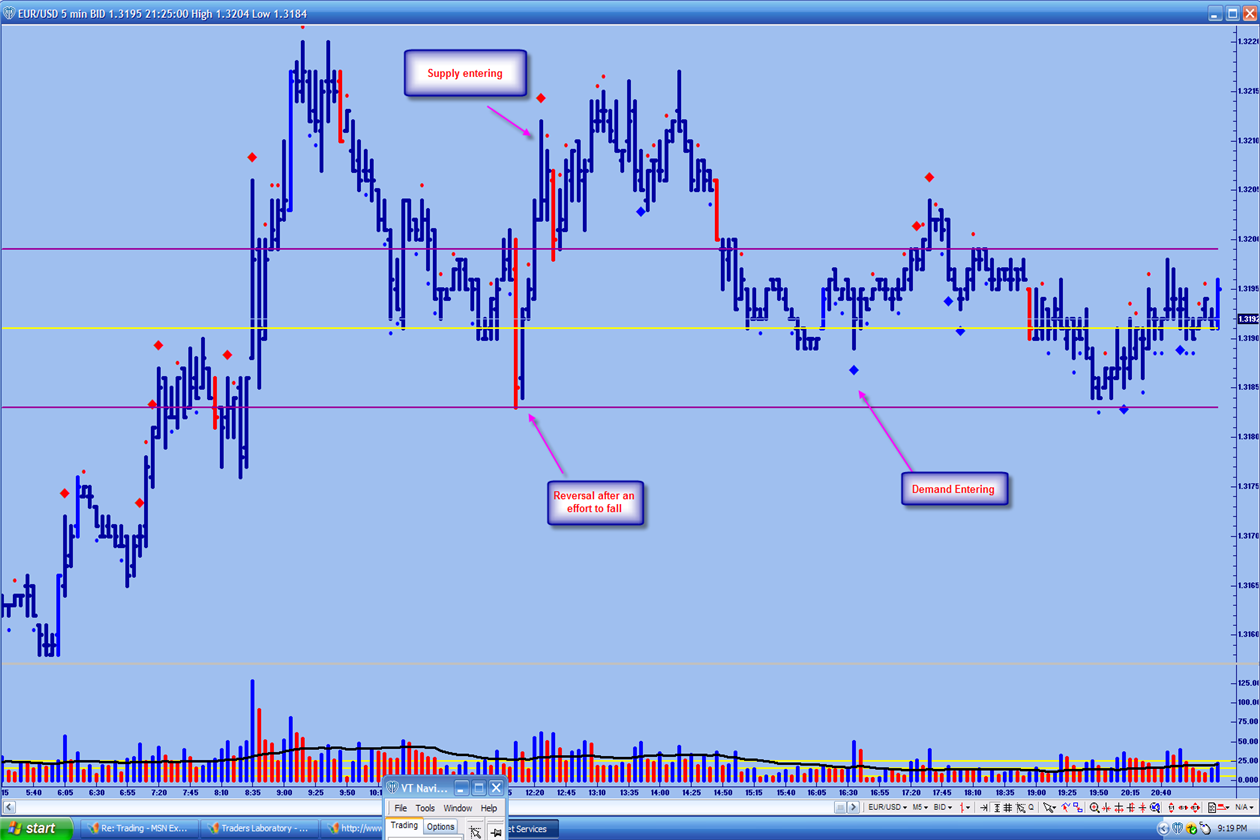
A couple things to think about. First at the time of the volume spike what was the trend? This is very important. If the trend was up then what we would be looking for is different than if the trend was down.
Next, are we around a known support/resistance area. These areas are usually respected by Smart Money. If we are and the trend is down, then we would expect to see demand enter the market, but not necessarily a change in trend.
After the large volume spike that closes on or near its high, we know that there must of been some Professional buying going on. Price does indeed move up. But as the trend is down we might expect to see a narrow range bar with volume less than the previous two that closes up from the previous bar, with the next bar down-No Demand.
Once you see the spike bar, You begin to look for either No Demand , No Supply, Tests , or Up Thrusts.
-
like it or not Tin... we end up on the same simple corner.... thats a simple hammer with volume surge at support (period).... wanna make it more complicated with vsa etc, etc,etc.... you can make it, but this is the old same good school being thought with some diferent sutil changes.... no new cience here... no new edge... lol...I have made the case before that things that are true tend to transcend methodologies. That is, for example, an ideal No Demand bar would close in the middle on a lower range and volume less than the previous two bars. From a candle perspective, which is not VSA, if this bar was a Doji then the market is showing indecision.
Another example would be what Bill Williams calls a squat. Basically a squat is a bar with a narrow range and higher volume. VSA teaches us to pay attention to a narrow range bar that has higher volume (especially) if it is ultra high and closes in the middle. Essentially, this is just a more specifically defined squat bar.
The point, yes many other valid methods will have various underlying concepts in common.
As far as being new, Wyckoff was doing this in the 1800's. Which proceeds the time candles were introduced in America.
did you notice yesterday how Gavin timed his trades ?.... great contradiction was there... he sayed "weaknes comes on up bars" great input indeed (maybe the only one I did capitalize from yesterday) BUT then his entry was on a swing low of volatility H (old classic past information technical tool, we indicator junkies use) mmmmmm you see... thats a contradiction.... now Tod DID take the trade with the up bar going on.... maybe he has more confidence on what he preaches.... but any way... still the same GOOD old concepts being preached with some variations... I repeat no new cience here... still good cience indeed... Nice trade there Ting.... cheers Walter.Yes. Todd is the true expert not Gavin. I hate watching the webinars with Gavin because he does basically use an indicator based system. The very thing we abhor!!!!!!! He needs to take the "h stops" off the chart and focus on price and volume. Gavin is also too dependant on the TG signs rather than what the bar itself has to say. He does believe in Volume Spread Analysis and thus makes an okay salesman, but is not he is be no means the ultimate chart reader.
-
Thanks very much.
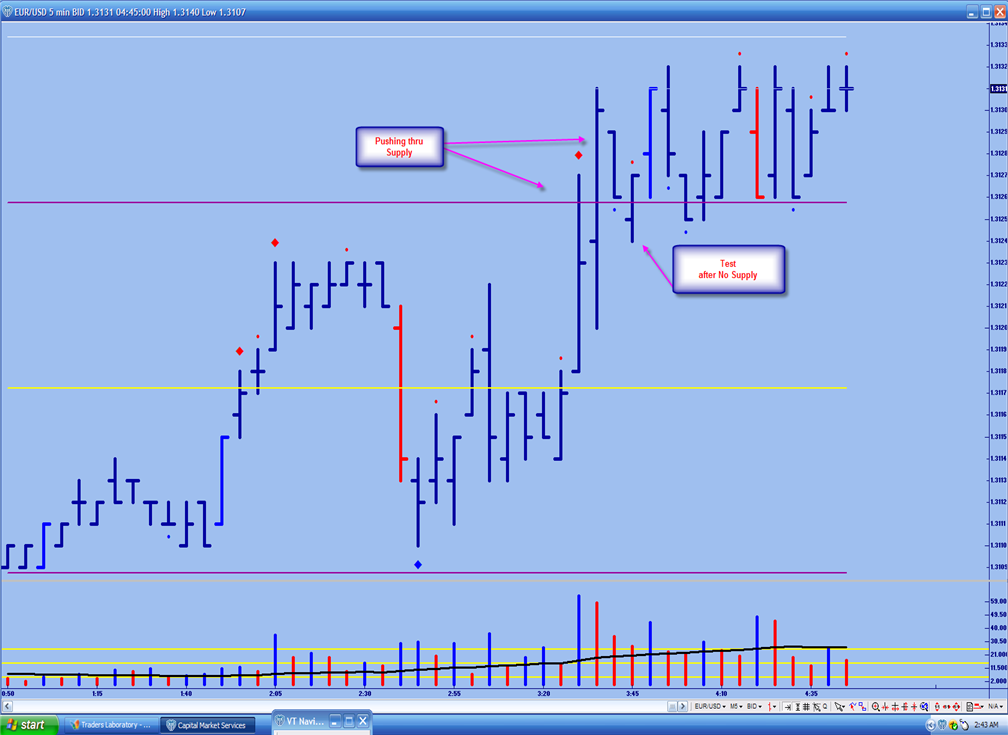
I place a small dot on all bars that have volume less than the previous two bars. I also place an diamond on bars with narrow ranges and increased volume.
Here is my chart of the same period. Note how the same levels are clearly indicated on the chart. In other words, those that want to program their own versions can do so. Just start to learn the method and go from there.

-
What do you think about Ensign? Thinking about giving it a try. How hard is it to program?
Sorry about the previous post. When I heard Gavin say a free book , I knew what was coming next. It is true that at first listen one thinks one is getting a free book just for attending. But to get the most out of the book, and in the fastest way, means buying the bootcamp. Hence one is looking at $600.00 plus s/h. The offer does cut that down a bit.
-
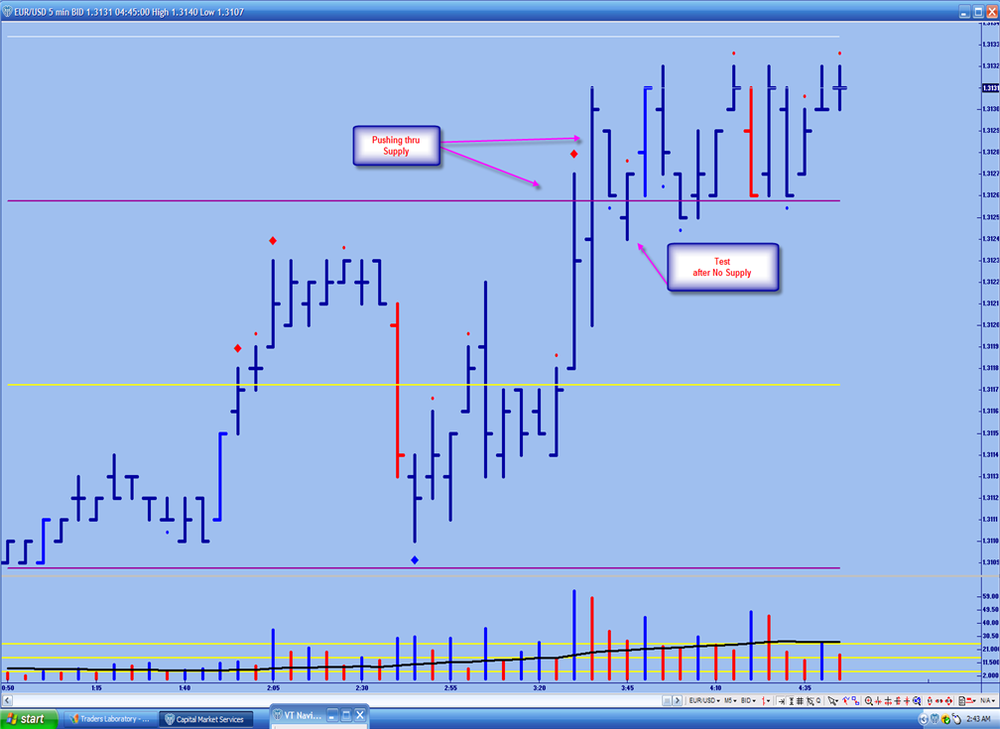
Wookey
Could you please put up a 5 min Euro spot chart from Today? I want to try something. Thanks
-
So I can get the book "free" if I pay $495 for the Bootcamp CD???Hmm...
The book alone is $100.00.
Am I to assume you have spent no money on Market Profile books and tools? Make no mistake, I would not buy the software myself and have told them as much. Yet underneath the sales pitch is a viable method for understanding supply and demand. And it is the imbalance of supply and demand that moves the market.
-
It should be said that candle can be used. TG offers them because many traders like them. I used to like them myself. But bars are easier to see especially at first.
Tom Williams (father of VSA) uses bars
Todd Krueger (TG and leading VSA expert) uses bars
Gavin Holmes (TG) uses bars
Sabastin Manby (Tom's friend and VSA expert) uses bars. Read his article on the T2W forum.
Joel Pozen (Formerly of TG, Student of Richard Ney, and one of the best chart readers, second only to Tom Williams) uses bars. Check out his site at Tradingmentor.com
If one uses candles, one need to remember that the close is more important than the open. Hence while a candle may close in the middle and have an equal open, what matters first is the middle close. The fact that the bar is a Doji is secondary.
As far as mutliple time frames. The best approach may be to find certain support/resistance levels on various higher time frames, but trade off of just one lower time frame chart.
-
Morning doji stars are something to look for. In a down trend this would be a long down candlestick followed by a doji which would signify a reversal. This would be confirmed by an up candlestick. Presumably other reversal candlesticks like hammers work just as well.VSA does not look at the open. There are two and three bar patterns like candle patterns, but not candle patterns themselves. Although they MAY be a candle pattern, they are not looked at in that light.
Since we do not technically look at the open, we do not know or care about a Doji. By definition, a Doji has an open equal to the close but we don't look at the open so we can't "see" a Doji. If you use TG software or look at their charts, you will notice that there are no open notches on the bars.
Personally, I do like to see the open on some bars. If fact, a NO DEMAND bar that closes in the middle and has an open in the middle is a powerful sign. This is a Doji, but VSA is concerned with the range, the closing price and the volume.
The issue which most interests me is what timeframe is ideal? I know "all timeframes" is the usual response but which timeframes are ideal? Looking at today's action the 1 minute charts would lead to false "signals" but the 5 minute charts would get you in very late. One solution may be to use the 1 minute for entries but only stay in the trade if confirmed by the 5 minute.All time frames
.1 minute has a lot of noise on it. It also depends on how many time frames you want to look at. If only trading off of one chart, then a 1 minute might be too "fast". Joel trades off of a single 3 min chart. Todd likes to use multiple charts. One problem with multiple charts is it becomes harder to see the signs of Professional Demand/Support. This is where the software does have an advantage over those who choose to learn the method alone.
I am not a fan of the software and would not recommend it. But if you want to trade off a 1 minute chart, you do need to look at least one more time frame. Just realize it gets difficult to keep all the various bars with supply and demand straight.
-
Okay, Let the learning and sharing of ideas begin.
1. Volume is activity. Hence tick volume can be used where actual contract volume is not available.
2. Two ways of looking at volume:
* relative volume: volume in relation to the previous bar or bars.
* actual volume: the amount (size) of volume an individual bar represents.
3. Strength comes in on down-bars and weakness comes in on up-bars.
4. Markets do not like high volume up bars with wide spreads? Why because there is a possibility of Professional Selling into such a bar.
5. Professional Money deals in large amounts and thus sells into up bars so as not to be hurt by their own selling. The converse would also be true.
6. 85% of a volume histogram represents Smart Money activity.
7. Smart Money is active on all time frames. Various time frames are used to hide their actions from those that can read a chart and each other.
-
.....................................Question to ask: Are we in an one timing auction?
Soul, what is one -time framing for the less skilled Market Profilers? Is this something one needs up-dating (realtime) profiles to see?
p.s. Thank you for your efforts to bring the webinar to us members. Once you get past the software sells pitch, there truly is something here worth learning.
-
Visual Trader (VT) thru CMS. Yes there is volume in forex. It's the best kept secret. Volume is activity and therefore tick volume works as well as actual volume.
Esignal provides tick based volume data for forex. Tradeguider.com has a fact sheet on the data if you are interested. Nowadays some spot forex brokers provide volume. True it is only representative of their platform but it works nonetheless.
As far as the program language, it is basically the same as used in MetaStock. Which is one major reason why I like it. No new language to learn.
-
Hi T.
Let's take a look at that large candle with the ultra high volume. If this volume represented selling:
1. The close should be on the low.
2. The next bar should NOT be closing equal or up. I think this candle is up based on the color of the volume bars.
As you correctly stated, this large bar does look like climatic action/stopping volume. From a VSA perspective, we see the next bar up (or equal) and this confirms the buying on the previous bar.
What I always like to see, is Professional Money showing itself at certain "known" levels. Here we see the Smart Money entering as price moves towards the VAH.
-
I think there are many more interested parties in seeing stock prices rise. Thus they want to make it harder for prices to fall. There is no good reason to have curbs, unless you want to make it more difficult for the market to fall.
Futures still have a sense of being instruments for professionals. Many people still argue that the retail person should not even be involved in the derivatives side of the game.
The "experts" point to the fact that a futures contract can trade lock limit down or be shorted on a down tick as reasons they are only for the sophisticated monied player. But the stock market is for everybody. As long as you put your money in and leave it there for the long run.
Do you think analyst disclosers are a good thing? Then why weren't they a good thing before the bubble burst? A "sale" call by the street is still rare.
-
I flicked through 'Master the Markets' by Tom Williams and thought it contained some useful points but overall I think VSA is more suitable for stock traders. A lot of the concepts revolve around market makers and their ability to see what other traders cannot see (stops and limits) but this isn't applicable trading futures on exchanges like Globex, ECBOT, EUREX and Euronext. We can see the same things that everyone else can see through the time and sales and order book so it makes sense to concentrate on that information instead of just focussing on volume and price.That is simply not the case. The text may seem "outdated" in that there much talk of Market Makers, but this only goes to show how the principles have stood the test of time. How the markets are manipulated by Smart Money (the term Todd Krueger prefers to Market Makers) remains little changed since the days of Wyckoff.
I find it hard to believe that you think there are not Professionals with things on their screen, like where the stops are, that the retail trader does not have. The playing field in simply not that level.
I have attached a chart showing what is going on in the Euro. A market (retail Spot Forex) not even around at the time the book.
-
Cisco futures has an extensive site on Auction Market Theory.
I have given what I have, in terms of "code" up to this point:
1. define average volume over some period x. For me, X=30.
2. Define 4 more levels of volume based on a deviation of the average.
3. why four? Mats has 4 paintbars: blue, green (cyan on the tradestation chart shown on the site),pink, and purple. Black bars are neutral (green on tradestation version shown).
The same idea is used in VSA as one way of determining how much volume a particular bar represents.
With the lowest volume bars (blue), there are a few other requirements. Like they be climbers or drifters (see Bill Williams' trading chaos). Also most of the blue bars are buying or selling bars.
Here buying bar refers to a bar that take out its previous bars high and not the low. A selling bar has a lower low than the previous bar but not a higher high.
Below we have a good example of what may be possible with the combination of "mats" and VSA. The first thing we see is stopping volume/climatic action. This bar has high volume that stops the preceding downtrend. With high volume and closing off the lows and the next bar up, we know there must of been Buying (demand) in this bar.
A few minutes later, a High Volume Balance Area is formed. We know it is a buying Balance Area, because the low is made before the high of the Balance Area. This concept comes from Mats. With VSA we know we have recently seen stopping volume. Hence we are looking to see if the market responds to the upside.
Ideal, we want to look for a No Supply sign within the Balance Area. Price moves out and then comes back inside. Note that the bar that represents No Supply does close within the Balance Area.
Remember, A balance Area is formed when there are two or more successive paintbars. When the next bar is a non paintbar (green) The balance Area is formed.
-
Actually Knytt, i use 2 different versions of Metastock. Version 7.0 for RealTime Trading and Version 8.0 for EoD Analysis. So i need for both basically. I'm tryin hard making all the indicators especially WillVal. I feel its an exceptionally nice indicator.Actually i happen to attend Larry Williams Seminar. So got exposure to all the indicators he uses. I'll collect and give you soon the data as regards the settings which Larry uses (if in case you dont know) required to make WillVal indicator. Will search my notebook soon and provide you.
Nishant
What do you think of MetaStock for real-time trading? It is the one platform where I understand the programming language. I don't want to spend time learning another one (I find easy language isn't all that easy). Is it suitable for intra day index trading?

[Volume Based Candles] and how to profit
in Technical Analysis
Posted
This is where WRB analysis comes into play. One can use Wide Range Bodies as profit target/profit taking levels. WRB analysis will give one support/resistance levels as well. They are also usually precursors to (secondary) candle patterns analysis.
In the chart below, note the WRB's that precede the valid sub group hammer pattern.
Once in the trade, one can use the creation of a WRB to exit some of the position. Note as the candle becomes a WRB, some of the position is taken off the table.