
Welcome to the new Traders Laboratory! Please bear with us as we finish the migration over the next few days. If you find any issues, want to leave feedback, get in touch with us, or offer suggestions please post to the Support forum here.


fatdog1
-
Content Count
22 -
Joined
-
Last visited
Posts posted by fatdog1
-
-
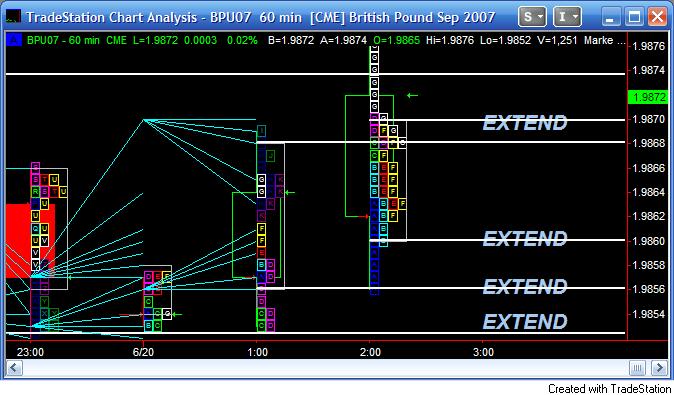
I had an idea to use trendlines 1 tick above the previous bars value low area and 1 tick below the previous bars value high area to enter trades long and short as an automated system.
I use Tradestation and I have tried several times to plot the trendlines.
So far, no luck. I have to draw them in by hand.
Here is a screen shot of the British Pound showing what happens when I try to draw the trendlines into the Tradestation Market Profile Activity Bar using Easy Language. It looks like a Gann fan.
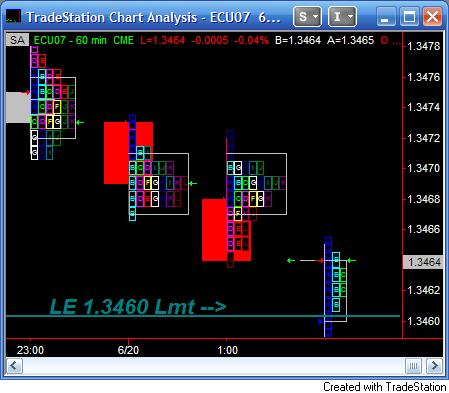
The second screen shot of the Euro shows the Tradestation color trendline strategy I use to enter using the manually drawn trendlines.
-
This is the best message board I have ever seen for traders.
I hope it stays that way.
I don't have time to post during the week, but I do like to read on the weekends.
Thanks SoulTrader.
Hi guys,Let's do our best here to respect each others opinion and keep the debates constructive. No need for personal attacks and such. Please lets try to keep it friendly and educational. Thanks
-
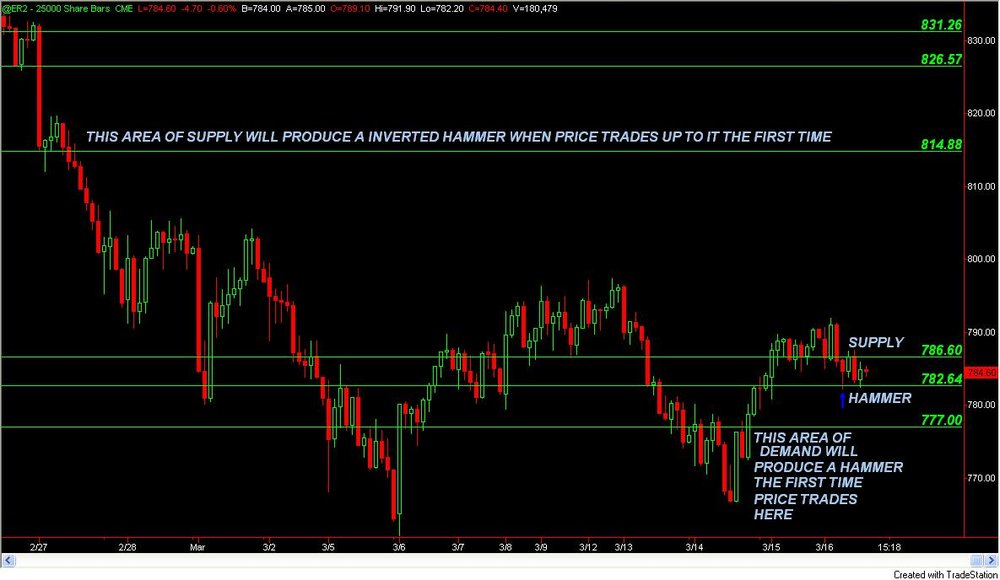
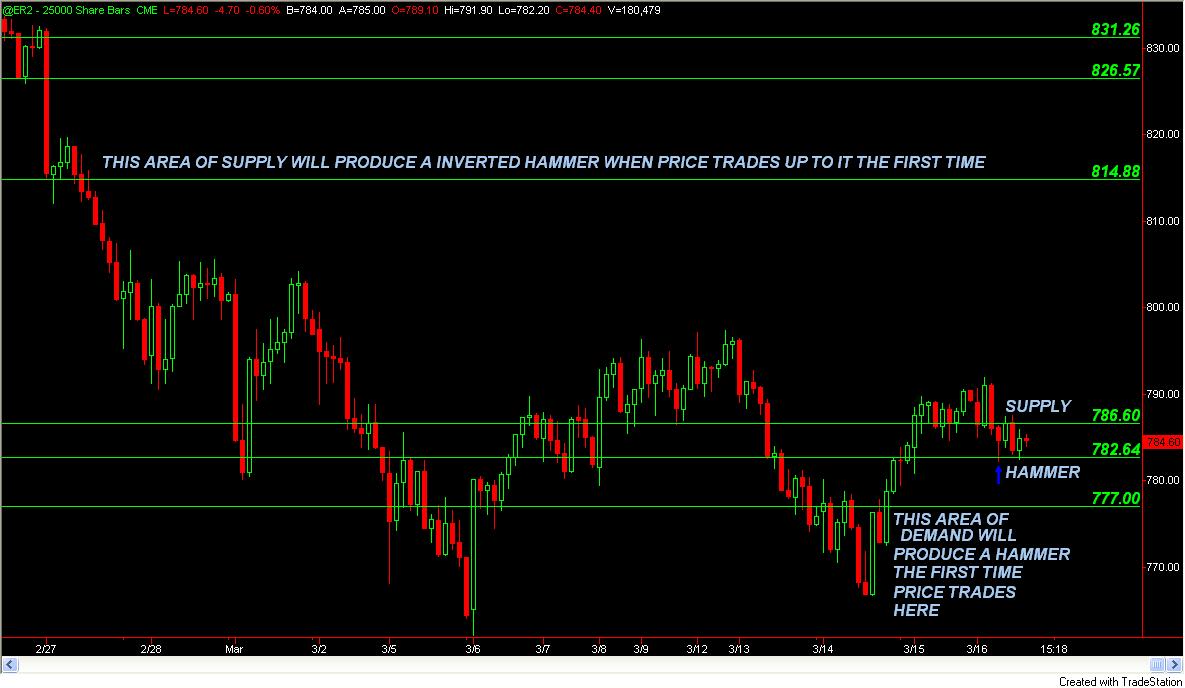
"Hammers are important because they show shifts in supply and demand."
I agree with that statement but rather than look for hammers and inverted hammers, I look for the areas of supply and demand ahead of time that will cause the hammer and inverted hammer to form.
Hammers occur when price reaches an area of demand.
Inverted hammers occur when price reaches an area of supply.
For example, a hammer will occur when the Russell trades down to the
horizontal line at 777.00 which is an area where demand exceeded supply the last time price traded at this level. The first time price revisits this area of the imbalance, a hammer will be the result.
The inverted hammer will occur the first time price revisits the 814.90 area which is an area where supply exceeded demand the last time price traded at that level.
These two areas are the both areas that have not been revisited by price since the imbalance. The area of demand at 777.00 formed on 3-14-07 and the area of supply at 814.90 formed on 2-27-07.
There is an area of demand at 782.50 that has been revisited twice on Friday and it did produced a hammer once already.
Unfortunately, there is an area of supply directly above 782.50, so the bounce was very small.
There are other areas of supply ahead of 814.90, but they have already been revisited and some of the supply at those levels have been absorbed.
-
Hi Steve,We focus solely on the currencies, and wrapped it up towards the end of 1st week Dec, which has become a normal habit over time. So we haven't been affected by the usual thin conditions leading into year end.
Again, August causes problems with diluted volumes & it's a case of either standing aside, reducing potential profit expectations or switching to a shorter strat framework.
My brother got tangled up a bit during mid Oct (Cable) with a few false starts, but then it's to be expected every now & then.
What kind of filters do you operate in such conditions? Are they worked around your automated model or structured alongside your manual execution.
I tend to change tack slightly when the mini (hourly) trends begin unseating me. Maybe drilling down a timeframe or two & booking 1st line profits earlier, whilst trailing the remainders a little closer until the field opens up again.
Always a very annoying & frustrating occurance, but thankfully, not a consistant problem on the majors.
Hi Texxas,
I have a few triggers for entry based on candle patterns and volume
that I use to enter in the automated strategy. Lately, the indexes and currencies are overshootting the places that I normally place the initial stop loss. It happens now and then and it takes the repeative part out until it settles down.
Steve
-
I think if you trade a particular instrument or candidate on a pretty regular basis over time, & your set ups revolve around repetative triggers etc, the subconscious kicks in.These ingrained behaviour traits (especially based around price activity at key levels & patterns) tend to form alerts, & whether we realize it or not, illicit a response/reaction to a previous consistant behaviour pattern.
I guess those who eventually begin to notice this type of behaviour tend to be traders who adhere to a well honed & developed strategy-plan.
Nothing like wrapping a workable set of rules, trade plan & repetative structure around you to focus the mind

HiTex and everyone else,
Great thread Soultrader.
Yes to the repetative trigger part, for sure. The problem is that sometimes the trigger needs an adjustment like adding a filter when the market is jumpy.
I have noticed that my automated strategy has taken a ton of losses after entry due to the volatility recently. Premature exits also. When you see that happen, it is time to go back to the manual entries and work on adding a filter. Has anyone else noticed excessive slip lately?
Have a good day,
FD1
-
Thanks for the thorough answers. I'll reread it to get more questions.Another question: "I use the Market Profile to tell me if a range day or a trend day is likely by the shape and location of the bell curve and the POC.
If a B shaped Profile forms near 792, then it is possible that a trend move lower could occur when the number of willing buyers drops to zero and a imbalance in the supply demand equaision occurs."
So you're saying here if Wednesday is a B shape, then Thursday is a possible down trend day? So is there an inference that if the previous day has a B shape, chances of a trend break to the downside likely and if previous day with a P shape, an upward trend likely?
That is what a trend continuation move will look like on a MP.
The people who trade with the Market Profile noticed the P and B shapes before trend continuation moves and have written articles about it.
If the price hangs out near 792 on Wednesday, it will mean that the demand at that level is being absorbed. If there is a close on a 60 minute chart below 792 then the number of buyers has dropped to zero.
-
So far, your explanation makes perfect sense. But I see a few things unanswered. How do you determine where the peak demand or supply is? From MP? Price-by-volume indicator? And how do you determine the low/high zone where to place your stop when you go long on peak demand area or short on peak supply area? How do you make the entry? When momentum reverses in the opposite direction. Say, when and if it hits 787.6, do I wait for the next bar to go higher than the previous bar to go long?The other question is, from last Friday's MP, I see a P shape, so this means that 792 is not absorbed yet but it's no longer peak demand area correct? Since we don't know what Wednesday's MP shape will be, we expect Wednesday to be in 792-799 action seeing Friday's MP shape?
Hi Torero,
I missed this post the first time, sorry:
"How do you determine where the peak demand or supply is? From MP? Price-by-volume indicator?"
I look for areas where there are imbalances in the supply demand equasion that are continuation areas in the current trend. Best way to describe this is a consolidation area preceeded by a up candle in a uptrend or a consolidation area preceeded by a down candle in a downtrend.
Let's use the 787.36 - 786.77 demand area as an example. I opened the screen shot to see the area so as to describe the area and the potential long trades better from the picture. There is a small area of peak demand at 786.77 and also a breakout area at 787.36. This means there could potentially be a trade near the 787.36 breakout line and another near the 786.77 peak demand area as well. Since after we based for a period of time on 12-22-06 between 785.50 and 787.36 we then went higher, there were
more buyers than sellers at that 787.36 level and therefore an imbalance in the supply demand equasion. The number of sellers dropped to zero at 787.37. That can be the only logical explaination for why prices traded higher.
It stands to reason that there will be willing buyers left behind wanting to buy when price trades there in the future. I don't use MP and a volume indicator to determine that. I just use the candles. That big candle tells me there was a lot of demand at that price.
"And how do you determine the low/high zone where to place your stop when you go long on peak demand area or short on peak supply area? "
To determine where to place a stop loss, I look at the size of the area where supply and demand was in balance before the move higher and place a stop loss below the low of the area for a long. For a short near supply, I place
the stop above the high of the consolidation area. I make the entry with either a limit order at the price where the imbalance occured if the area is peak demand, or a buy or sell stop if the area is not peak, or if it is a breakout of a trading range that formed after a sell off.
" How do you make the entry? When momentum reverses in the opposite direction. Say, when and if it hits 787.6, do I wait for the next bar to go higher than the previous bar to go long? "
Let's separate the two possible trades in the picture.
I re-read my post from Sunday and looked at the picture and I amended the 787.60 price to 786.77 for the area of peak demand. I will use a limit order at 786.80 and my initial stop loss will be 785.40 for that trade.
It is very possible that the price will turn higher when it hits the 787.36 breakout line. I will place a buy stop at 787.50 or 787.60 if that line is hit to catch the reversal and I will watch the tape for buyers.
"The other question is, from last Friday's MP, I see a P shape, so this means that 792 is not absorbed yet but it's no longer peak demand area correct? "
Correct. It is not absorbed until price closes below the 792 area on the 60 minute chart and it is not peak anymore.
"Since we don't know what Wednesday's MP shape will be, we expect Wednesday to be in 792-799 action seeing Friday's MP shape?"
There is no way to determine the shape of the Wednesday Profile from Friday's. If the price trades between 792 for the low and 799 for the high, it could be a normal profile if the price rotates in the middle of the range, or a P shape if the price hangs out near the 799 area of supply, or a B shape if the price returns to the low of the day and rotates there.
-
One other question? How many days must go by before the peak demand is disqualified as peak demand? Is virgin POC important?Very good question with a two part answer.
Peak demand and supply is peak until the first time price revisits the area.
There are areas of peak supply in the indexes like the S & P and Nasdaq from the bubble that have yet to be revisited. There will still be sellers when price revisits those levels. I find those areas on weekly and monthly charts.
Even though the Dow and Russell are near all time highs, they won't be able to advance very far without the S & P and Nasdaq advancing as well, and they will sell off when the S & P or Nasdaq comes into a large enough area of supply. On the rise from the July lows, areas of peak demand formed that will produce bounces when the price revisits them in the future. There are also areas of peak demand from the 2002 lows that will produce bounces should the market ever test those lows. The second part of the answer is to determine who is in control of the market now and try to trade with them. The market is making new highs, so I am buying pullbacks to areas of peak demand as they form. Once the current uptrend ends, I will switch over to shorting pullbacks to areas of peak supply as they form. The first chance to find out if the uptrend is ending is when the Russell trades up to the 800 area which is a area of peak supply that has recently formed.
-
Thanks. I'll keep that in mind. I am curious as to why you use 60min while the others use 30min to set up their MP.Torero,
My trading style is simply this: I am a buyer at this price, I am a seller at this price. I use daily, weekly, 240, and 180 candlestick charts to find the big range areas of supply and demand that I expect the price to trade between. For the actual entries, I use a 60 minute candlestick chart to find the small range areas of supply and demand that I want to trade between by going long near demand and short near supply. Today is Monday, and I am planning to trade the Russell on Wednesday between 792 and 799 because the demand is near 792 and the supply is near 799.
The areas I speak about have nothing to do with Market Profile at all.
If the price trades between 792 and 799, the Wednesday Market Profile will automatically form between those two prices.
I use the Market Profile to tell me if a range day or a trend day is likely by the shape and location of the bell curve and the POC.
If a B shaped Profile forms near 792, then it is possible that a trend move lower could occur when the number of willing buyers drops to zero and a imbalance in the supply demand equaision occurs.
The possibility of a trend move lower exists because the 792 demand area is not peak demand anymore. Peak supply and demand are areas that price has not revisited since the initial imbalance in the supply demand equaision. The 792 area was revisited on Friday afternoon. That was the highest odds, lowest risk long entry at 792. It also happens to be the bottom of the Market Profile from Friday. It was the area of peak demand which shut off the selling and forced the rotation higher before the close.
I would still trade long again at 792, but, like you, I will now need confirmation before I enter a long trade. Like SoulTrader, I will use the tape before I enter to determine if there are buyers left at 792.
If the range is extended lower, I would next be a buyer near 786.77 which is the next area of peak demand. I don't need confirmation to enter long here.
My first target would be 792 where an imbalance in supply and demand will have occured if we trade below 792. I won't short 792 since the areas of supply and demand are close together, but I will move my stop to even on the rest of my position in case price revisits the 786.77 area.
I will still be a seller near 799 which is peak supply if it is reached on Wednesday or any other day as long as the distance between the areas of supply and demand are at least 3 to 1 at the time that price revisits 799.
Hope this helps.
-
Hi FD1, can you post one of @ER2? I'd like to see your observation on it. Since I'm still a newbie with MP, I would like to see what the experts out there use MP to trade properly. Thanks.Torero,
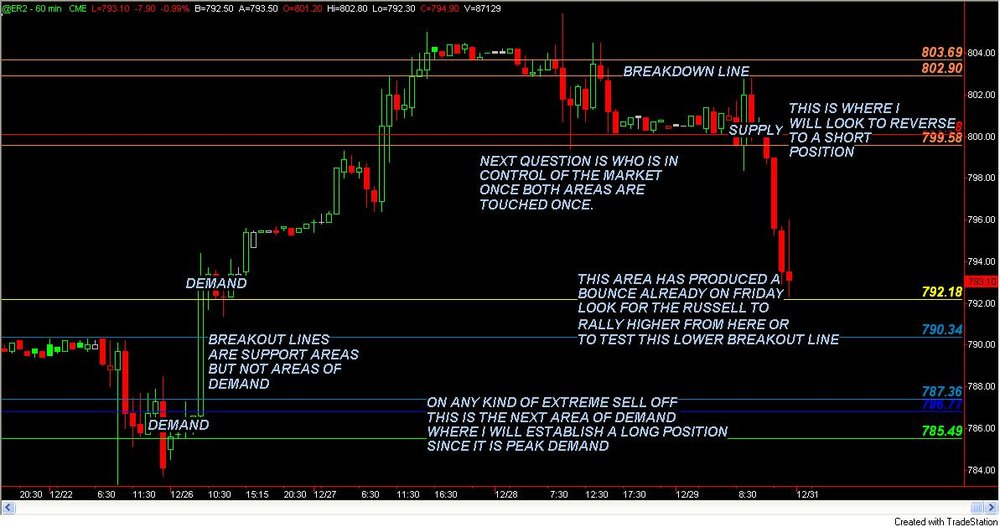
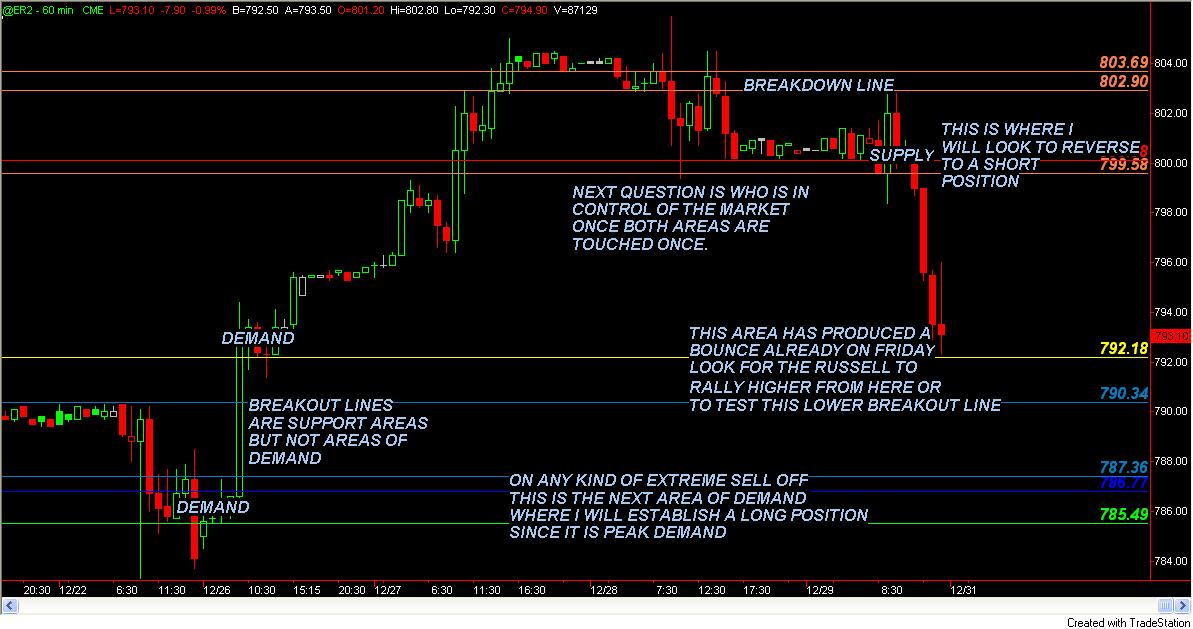
My observations on the areas of supply and demand for the Russell are below. The daily Market Profile will form on Wednesday between these areas.
That is the extent of my expertise in using the Market Profile. I use the Profile to observe what kind of bell curve forms, and where it forms so as to guage the likelyhood of a trend move once an area supporting or resisting the Profile is absorbed. For instance, on the Russell, I am looking for the area at 792.20 to act as support on Wednesday morning. The Russell has been in the area of demand at 792.00 already on Friday afternoon and it bounced 4 points off the low before selling back down near the day's low by the close.
It is possible on a selloff that the Russell could extend the range down to 790.40 which is a breakout line out of a trading range from the 21st and 22nd of December. I don't trade pullbacks to breakout lines that occur far away from the point of imbalance which is 786.77. There are no guarantees that there will be willing buyers that far away from the actual area of demand. The tape would have to get real positive near the 790.40 area for me to take a long trade there for confirmation. It is possible that the Russell could visit the area in the premarket too. If the Russell rotates back up to the 792.00 area after touching 790.40 in the premarket, I would be interested in a long position using the tape. The next breakout line at 787.36 is very near to the point of imbalance at 786.77. If there is an extreme selloff on Wednesday, that is the next place I will establish a long position without confirmation.
On the top, I am looking for the Russell to trade up to the 799.60 -800.00 area. I will reverse to a short once that area is reached since it is the first time back to the area of supply. My first target is 792.00.
A couple of possibilities for the future.
Once both areas at 792.00 and 799.60 are touched, (792.00 has been already) we will see if a downtrend will begin, or if the Russell will again trade near the area of supply and form a P shaped bell curve indicating a move to the old highs. However, a B shaped bell curve near 792.00 means we visit the 786.77 area, and I hang on to the rest of my short.
-
Hi everyone,
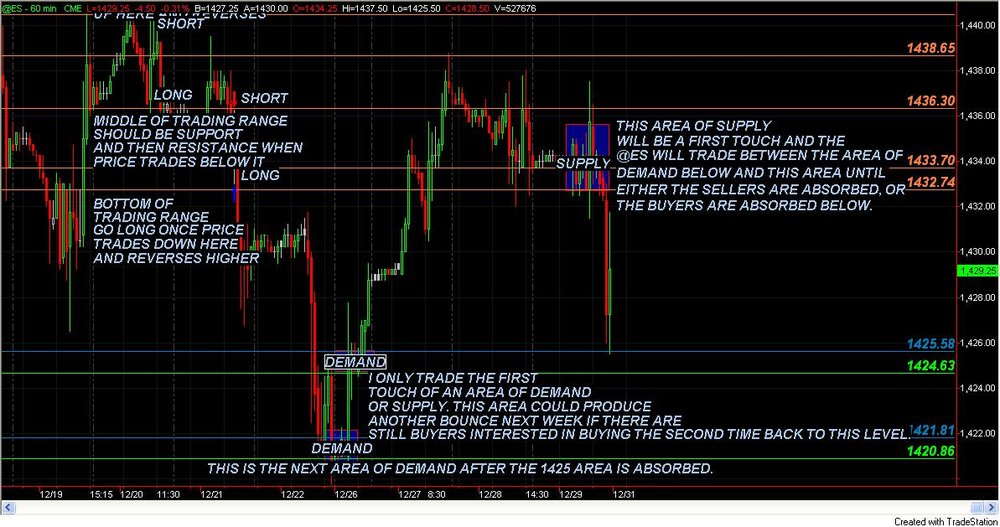
I want to add a bit to the discussion if I may. I am a discretionary trader only because I am not able to code what I do. I totally agree with Ant about the entry being as early as possible so as to reduce the initial risk. I also agree that with my method automated, I will miss many entries because the price will not reach the area exactly where I have my entry order placed. Mostly, a different index will reach an area of demand or supply and turn and take the rest of the indexes along with it. That happened at the end of the day with the S & P's. My entries are in areas of supply and demand which is price based only. Since it is price based, it does not lag or require math formulas.
I am able to find areas where price will turn consistantly with no doubt in my mind that until the area is absorbed, the laws of supply and demand will force the vertical move to cease, and the horizontal move to absorb the area to begin. In fact, I can post a Tradestation chart of any market you wish with areas of supply and demand marked off with horizontal lines with alerts. You will be able to observe in real time the market trade between the areas of supply and demand until either the supply is absorbed and the price moves higher, or the demand is absorbed and the price moves lower.
I will have additional areas of each marked off on the chart for when the original areas are absorbed. When price reaches the next area, the new trading range will be established.
If you can combine the Market Profile with what I do, it will lead to a more robust trading system. You will know when a trend day or a range day is likely by how many times price visits a level on either end of the Profile. The first time to an area is the highest odds, lowest risk trade. The more times a price visits a level of demand, the odds are reduced that there will be willing buyers at that level and the same for sellers at areas of supply. Once the area is absorbed, price moves on to the next area. The Market Profile shows these areas as vertical moves or horizontal rotations. In addition, P shaped rotations are near areas of supply being absorbed, and B shaped rotations are near areas of demand being absorbed.
Put the two together, and watch what happens to the Profile when the price reaches the areas I mark off. If it is the first time, it should be a normal bell curve Profile. If it is the second or third time, watch for the area to be absorbed by the shape of the Profile.
I have a screen shot of the S & P's below. I can't post a TS workspace here.
If someone here can help me code the patterns, then the lines could be added to the chart like the HVA and LVA are now.
Happy New Year everyone,
FD1
-
Hi walterw,Can you elaborate on that a little bit more? Here's my example of what I was talking about using patterns with price action:

Like I said before, patterns need to be confirmed by price action, in this case, lower higher and that turned the support area into resistance area (this is what I call confirmation of a breakout). My stop would have been the last higher low pivot (just below 796), and entry just below the confirmation area, then target is around 791. The R:R is not even 2:1 so I'd either take a small position or find a bigger pattern in higher timeframe that might be at play to find a bigger target to confirm the direction and possibly lower target. In this rectangle target, the target is near the low of the day, which is quite a safe exit.
Torero,
Perfect example of the stage 3 top.
The best part is it is shortable the first time back to it no matter when that happens. I am shorting those patterns in @NQ and @ES from 2002.
-
So these traders are clueless? I thought you had to have a decent track record before trading their money.Depends on the firm. If the firm is into training new people, they are sharing in the commissions, the desk fees, a portion of the profits, software fees, ect.
They will hire anything with a pulse until they blow out the deposit and leave, or deposit more and stay. You want a job at Goldman so you can share in the billion dollar bonus if you have a track record, lol.
-
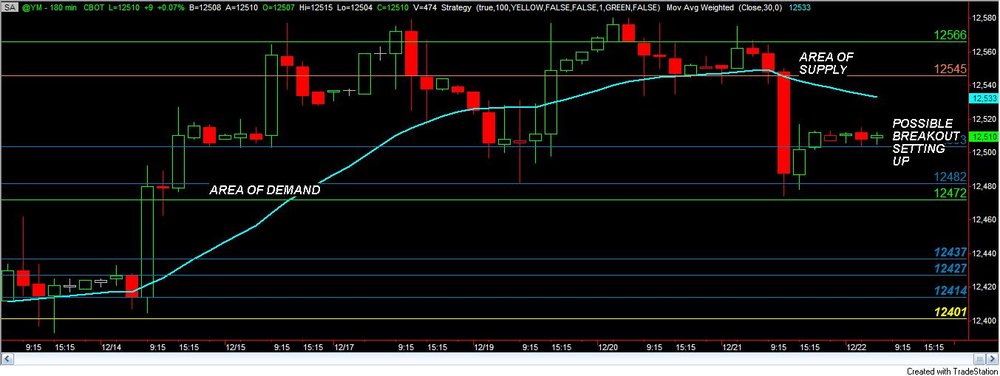
I am looking at the 180 minute @YM chart for today.
I am going to post the screen shot of the chart below.
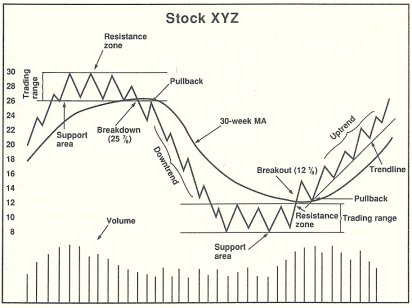
There is going to be a economoc release later this morning which will complete this pattern one way or another. I have adapted the method that Stan Weinstein wrote about in his book Secrets For Profiting in Bull or Bear Markets.
In the book, Mr. Weinstein describes the 4 stages of the market.
Here is a screen shot of the 4 stages. In the book, Mr. Weinstein briefly mentions buying and shorting pullbacks to the breakout and breakdown areas, and the possibility of a continuation patterns.
That is the picture on the 180 @YM chart for today. There is a stage 1 or stage 3 trading range between 12,500 and 12,512. It will be a stage 1 if the Dow rallies past 512 and the 180 candle closes above 512. It will be a stage 3 if the Dow declines below 503 and the 180 candle closes below 503. The current candle closes at 6:15 Central and the economic data is released at 7:30 AM Central, so that will be the candle where the action takes place.
Even if the news is good, the party ends at 12,545 until the area of supply between 12,545 and 12,566 is absorbed. If there is a decline after a rally, the 12,512 area will produce a bounce the first time it is revisited, and my range for today is 12,512 to 12,545. If there is a decline and no rally, the 12,472 area may produce a bounce if it holds as the trading range bottom on a daily chart between 12472 and the old high, or the next area for a bounce is down near 12,437. On a daily chart, a push down to that area could be a long tail on today's chart if we close back near 12,475.
That's my contribution to the @YM group for today. Using the Market Profile
in addition to this information and the tape will be interesting to watch as to the possibility of range extension, failed breakouts, ect.
I would love to be able to code it and lay it on top of the Market Profile lines that Ant coded for you.
Merry Christmas,
FD1
-
Thought I'd share a basic Excel spreadsheet for tracking trades and trading performance (created on Microsoft Excel 2002). This is intended to serve as a starting point for a Trader's Log and can be modified to suit a trader's needs. My goal was to keep it as simple as possible so that this part of a trader's job does not turn out to be too onerous. Note that there is a lot of room for improvement. For example, this log assumes that trades are opened/closed on the same day and it does not track all expenses, such as the cost of trading platform(s), computing needs, etc. I expect this log to evolve over time.Trader's Log Worksheets:
-
Trades - Enter the details for each trade. The data entry for each trade is done in this worksheet.
-
Trade Analysis - Calculates the trader;s performance fo all, long, and short trades. No data entry required.
-
Account Summary - Summarizes the trader's monthly performance. The initial balance can be entered.
-
Monthly P&L - Charts the traders performance from the Account Summary worksheet.
-
Performance Summary - Provides additional details on monthly performance.
-
Strategy P&L - For traders that trade different strategies, this worksheets tracks the performance of each strategy.
Thought we could use this thread for discussing how traders handle this important part of trading and to get other ideas. Hope this is helpful to some.
P.S. Some of the worksheets have been protected to avoid making changes inadvertently to it. To unprotect the worksheet, click on Tools > Protection > Unprotect Sheet...
Thanks Ant. I would suggest to anyone that does not use MS Excel that the free Sun Microsystems OpenOffice.Org program works well for me.
FD1
-
Trades - Enter the details for each trade. The data entry for each trade is done in this worksheet.
-
Can you explain what prop traders and prop firms are? I was tempted to join one a long while back but decided against it having reading a few reads here and there and wasn't convinced enough to trade in freedom and keeping my own money. Is it as true as some forums claim?Good morning Torero,
A prop firm is a trading company that lets traders use their trading capital to trade. Most of them now require a trader to deposit a small amount, like $5000.00 and then they can use the firm's leverage to trade larger size than they would be able to on their own. Most of the firms have an arrangement with a clearing house so as to share in the commissions, and most charge monthly fees for the desk, software, ect. A few of them do a decent job of training the trader. Most of the training I see is to jump in when there is news without any idea about where to get out. I trade using supply and demand so I work with the traders to identify the trading ranges for the day. As you know, there are times when good news can be sold into and bad news can be bought if you know where.
FD1
-
Hi Steve, nice to have met you in the chat room. Now you are a member of the CBOT (have a seat there?) or just working for a trading company at CBOT? Just curious. Very nice blog, see you cover virtually all the majors! I'm only with GBPUSD for now, more than I can chew, I'm afraid. But baby steps for me for now.Hi Torero,
No seat. I have a few shares of stock. Very few now since the buyout was announced. I work in the CBOE now more than the CBOT. I am involved with a couple of firms and I am working toward a CTA so I can do it for myself down the road. I use to like the GBPUSD when I was trading forex for the larger ranges it trades in daily. I hit the short at 1.9697 for the prop. traders, so they were happy today.
Take care,
FD1
-
Welcome to the forums Steve. Plenty of index futs traders here and glad to have you on board. Looking forward to some great YM dicussionsThanks for the welcome everyone.
I had a good time in the chat room this morning.
Too bad most of my messages seemed to vanish after I typed them.
I must have had some Java issues.
I will try again tomorrow.
Steve
-
Thanks for the welcome everyone.
I had a good time in the trading room this morning.
Sorry my typing of replies took forever.
Every message I typed disappeared for some reason.
I will be happy to share a few levels to trade at in the @YM.
I hope ANT can help me code something as nice as the MP value areas that SoulTrader uses. That is excellent work.
Have a great evening,
Steve
-
Hi everyone,
My name is Steve Misic. I am a professional trader from the Chicago area.
My trading is base on the study of price movement between areas of supply and demand. I learned this method of trading from a gentleman named Sam Seiden.
There is plenty of material on Sam Seiden available on the web if anyone is interested in learning more about his style of trading directly from the teacher instead of the student. I will be happy to contribute what I know and answer any questions. I trade the Mini Dow, Russell, Nasdaq and S & P's, the currencies, and the bonds. I use Tradestation for my platform.
For forex traders, here is a link to my blog:
Forex Trading Based on Supply and Demand
Happy Holidays to everyone,
Fatdog1
-
Good Morning,
I saw your post about automated trading signals being executed by your broker in the 24 hour forex market.
Here is another issue with automated forex trading and forex trading in general you might want to be aware of.
I use to have that done for me by the one and only RefcoFX. Unfortunately, now I have no trading capital since their lawyers and the nice bankruptcy court decided to give my trading capital to the secured creditors of Refco, LLC. Bottom line, don't just go with any broker that offers the service and don't leave any more money in your forex account than you need to trade with because your broker has just been given the green light to steal your trading capital if they get into trouble. I now use my automated strategy in the currency futures market which is regulated and protected by the CTFC.
It is a stripped down Tradestation strategy that I run on the front month contract which does not offer enough historical data to use the full version.
I am still involved with the spot forex market by selling advice to a couple of forex fcm's for their traders to trade based on supply and demand analysis. Supply and demand is price based analysis only. The best part of that is that you can use OCO orders for all my trades since I identify the areas of supply and demand I want to trade between both long and short ahead of time.
I have a free blog where I post the trade recommendations based on supply and demand for the forex market. Here is the link to the free blog for you to follow if you are interested: Forex Trading Based on Supply and Demand
I am interested in adding the study of volume to what I do by using the Market Profile. I am from Chicago and I work at both the CBOT and CBOE, but I have not met Mr. Steidlmayer. I actually had a fight with the guy who was suppose to introduce me to him the day before I was suppose to meet him.
Happy Holidays everyone,
Steve Misic
Fatdog1


Market Profile: The Secret Sauce To Mechanical Strategies?
in Market Profile
Posted
I should explain that the reason I draw the trendlines is to mark off areas of support and resistance. The long trade will be exited when the price trades up to the yellow trendline and a short will be entered if the 60 minute candle closes above the dark red line.