
Welcome to the new Traders Laboratory! Please bear with us as we finish the migration over the next few days. If you find any issues, want to leave feedback, get in touch with us, or offer suggestions please post to the Support forum here.


VolumeJedi
-
Content Count
125 -
Joined
-
Last visited
Posts posted by VolumeJedi
-
-
Live right edge (AKA put yourself out there to be labeled a fool LOL):
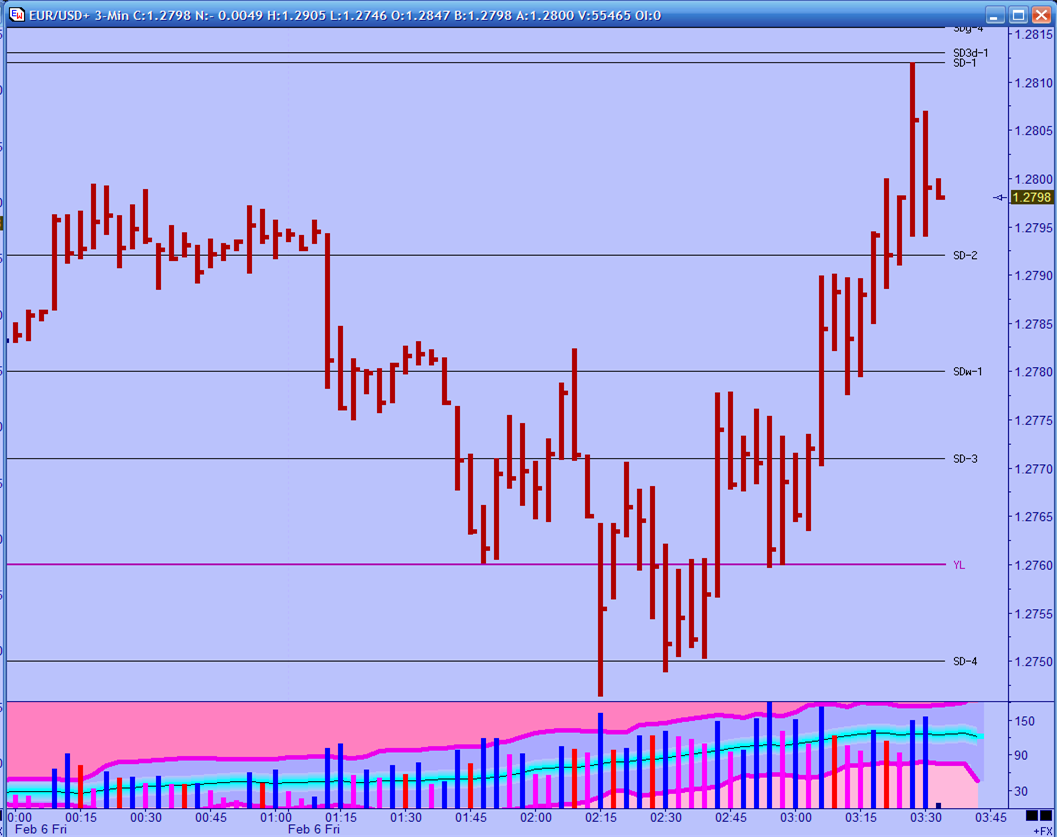
Here is a chart of the Euro 3 min.
Before we get to the right edge we have to look at how we got there. This is looking left to trade right.
Ignore the black lines (SDs) as they are for Sunday/Monday trading.
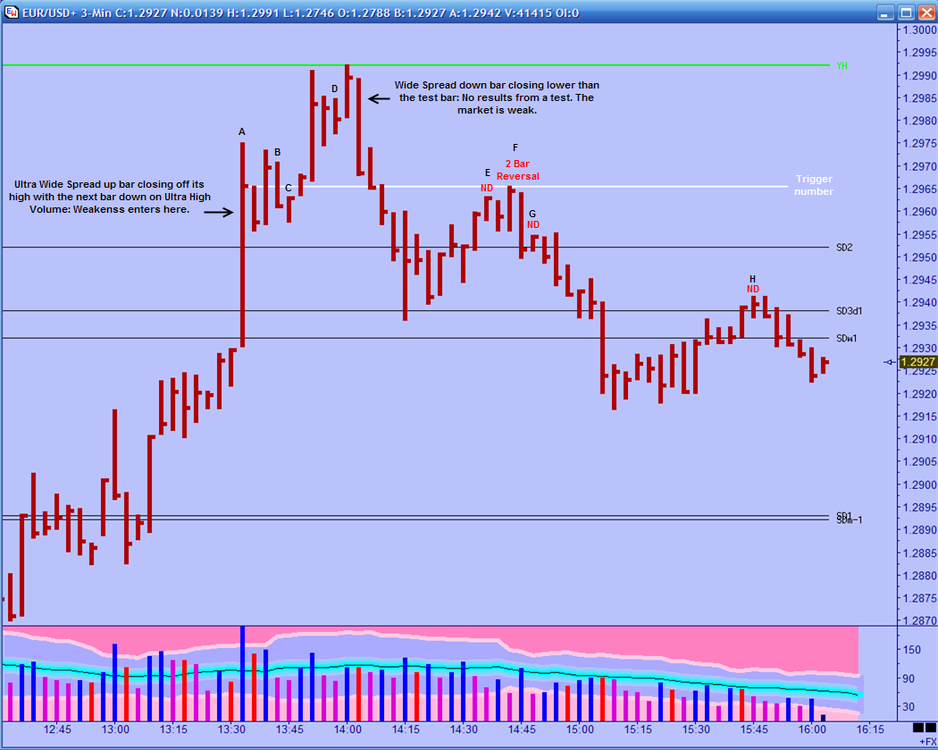
A: Ultra High Volume up bar closing off its high with the next bar down. When weakness appears, it appears on up bars. As oft repeated, markets do not like this type of bar as it could contain hidden selling. Well if all the volume on this bar was buying, then the next bar could not be down. It is. This sets the stage and the weakness here does not just disappear.
B: If A was strength, we would see it tested immediately and we would also note an old top to the left. There are not old tops to the left, so pushing thru supply is not likely what was going on in bar A. B, however, is a down bar on volume less than the previous two bars. No supply. This bar should be ignored there is weakness right in front of it.
C: First "tricky" bar. We see an up bar on volume less than the previous two bars on a narrow range. It is No demand. However, it is not completed as the next bar is up and not down. Looking closer at the bar, note that it makes a lower low then the previous bar and not a higher high. Ideally, the bar would make a higher high and not a lower low than the previous bar. Simply, we would like it to be a mis-named buying (Dunnigan) bar.
Momentum takes prices higher. Momentum is a powerful thing.
D: D is a narrow range down bar on volume less than the previous two closing in the middle of its range. This is the Test we were looking for to confirm that A was strength. Or is it? Well, first off it is not in the correct place. A good test would be in the range of the Ultra High Volume bar. This is not. Two bars later we complete a 2 bar reversal where the second bar is a wide spread bar that closes lower than the low of the test bar at D. This is no result from a test. This is likely, CW's WRB dark engulfing candle that he talks about. For our purposes the concept is the same. A wide range bar closing on its lows that closes lower than the low of the test bar. In fact it closes lower than the lows of the last three bars. TG would have a SOW over this bar I am sure.
E: The best place to take a short (but not the only place). We see a narrow range (NR7) bar closing up and on its high with volume less than the previous two bars. Note that this bar does not trade higher than the close of the bar at A. This close at A is Gavin's trigger number signal. Also note that E is within the range of A, unlike the test that could of fooled us. Bar E is completed on the next bar as the next bar is down an makes a lower low bring many into the market.
F: This is a two bar reversal. Seb Man likes to see wider spreads on this pattern but it is none the less a Two bar reversal. "Coincidently", the first bar trades up to, but not thru, the trigger number level. The second bar closes lower than the previous three bars, does not make a higher high , and closes just off its lows. We actually like to see two bar reversals "proven" with either a test or no demand soon after.
G: The very next bar is an up bar on a narrow range (NR7) on volume less than the previous two bars. Simply, it is no demand and proves the two bar reversal pattern. If you only short on up bars then this was what you were waiting for. Enter on a breach of this bars low.
H: This is just another No Demand bar as price moves down. Again, we note that this bar appears within the range of bar A. Thus, in the area where there was once high volume we are seeing little activity (low volume). If you were not yet short, this is yet another entry place. Of course the day/week is ending soon and most traders are already hitting happy hour.
Okay, that's our background.
When the market opens up we would expect to see a possible (Gap) down move. Forgive me, but I must add this. Market Stats tells us that the VWAPd is above the PVPd so what we would want to see from that perspective is a move down to SD1 and then a move up at least to SD2. Or the market could move down to the VWAPd and then bounce up from there. Either would be consistent with what VSA is telling us at this time. We do have to be careful with what happens with the TARP over the weekend. It could cause the dollar to strengthen which would be consistent with our VSA view, or it could be received negatively for the dollar. So we are looking for early weakness (prices down).
-
I don't know about worst loss, but what about worst win? My first trade. I made $32,000 in less than two weeks starting with $2,000 on a currency futures trade whilst working at Burger King. And doing all the wrong things.
Since that time I have wrecked a few ships on the rocks (never a blow out) blinded by the seductive sounds of the Market's siren call...........
-
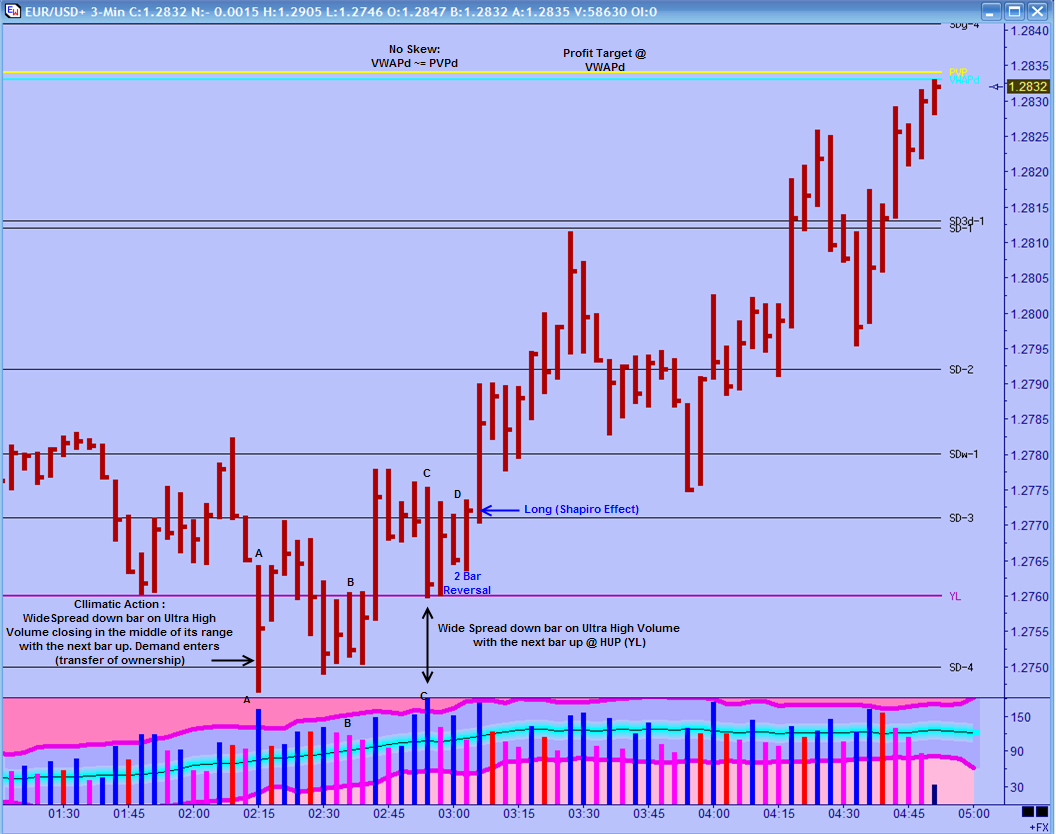
Just posting a chart that relates to the chart in the pure VSA thread.
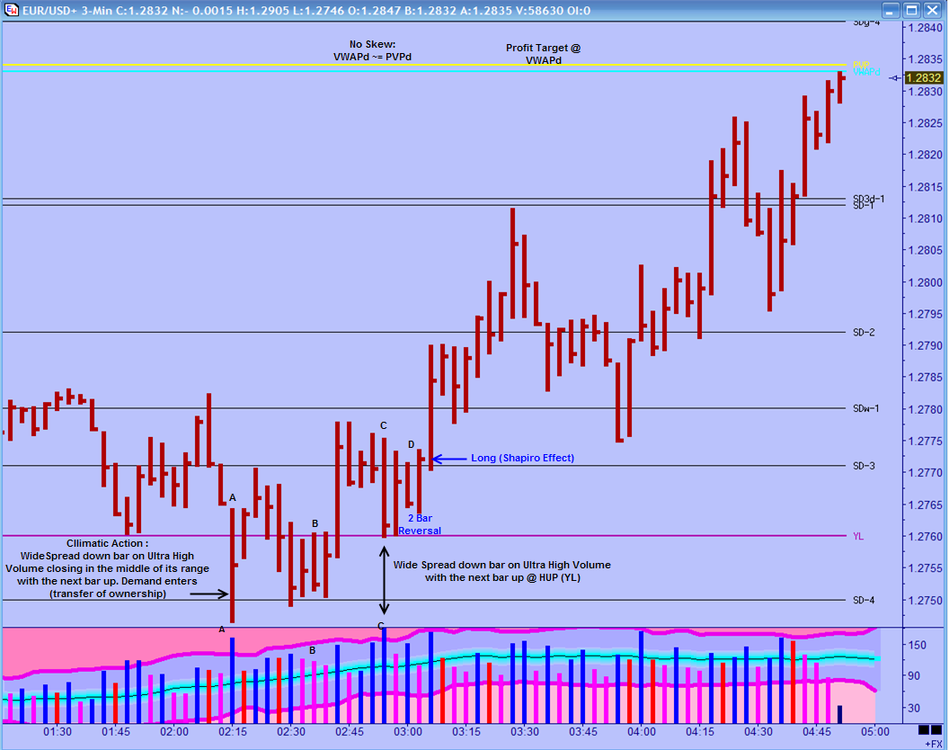
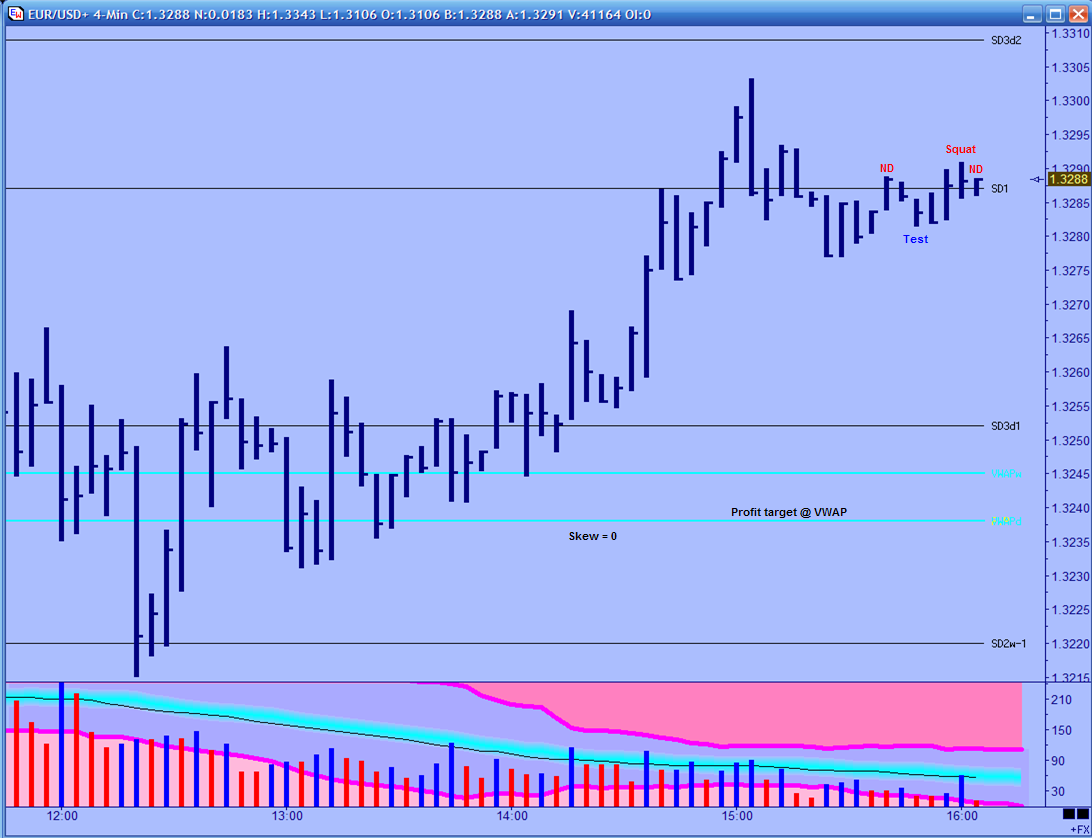
This is what I call an "position" trade. The bias was for an upside trade (long) because the VWAP and the PVP were just about equal. The "hard" open for the Euro is 0200 EST. What we are looking for is a way to get long with the expectation that price will move back up to the VWAP. See the market statistics thread for reasons why.
A: Climatic Action stopping volume. Wide Spread down bar on Ultra High Volume closing near the middle of its range, with the next bar up. At the time, this is the highest volume bar that can be seen. As we have had the "hard" open, it is expected for volume to pick up, but this is level speaks to something more. This is a transfer of ownership type of bar. The BBs are net buyers into herd selling.
B: Down bar with volume less than the previous two bars within the range of a high volume bar. This is no supply. The range is not as narrow as we would want to see and the bar makes a higher high. We would rather see the bar trade lower than the previous bar.
C: Wide Spread down bar on Ultra High Volume with the next bar up. This bar is being support at a HUP line-yesterday's low. Volume is higher than our climatic action bar so we must pay attention to it. If there was selling in all that volume than the next bar should not be down. Also note that the range should be larger with respect to the amount of volume.
D: 2 Bar reversal pattern. We have strength in the background and now we see a two bar pattern of strength. This is occurring in the place we want to see it from a MS point of view-at SD-3. This is a good place to go long with a price target all the way up at the VWAP.
-
Thanks a lot Eiger. I have posted my chart in VSA part II thread.
P.S. Hope this weekend goes well
 .
. -
Eiger, just wondering where you would get long or short (if you would do the fromer or the latter or both) on this chart?

-
Issue #1: Next Tuesday 2/3/09 @ 0130 EST Tradeguider is having a webinar with live right edge trading. Start time is 0130 EST and end time is approximately 1130 EST Tuesday. It looks like this will be a two day event, which means the same times on Wednesday 2/4/09 as well....Turns out this is a paid event. My bad. I hate TG more and more each day LOL.
-
Issue #1: Next Tuesday 2/3/09 @ 0130 EST Tradeguider is having a webinar with live right edge trading. Start time is 0130 EST and end time is approximately 1130 EST Tuesday. It looks like this will be a two day event, which means the same times on Wednesday 2/4/09 as well.
Unfortunately, it is TG so there will be an air of a "sales pitch" but the VSA learned can be applied to any chart. Hopefully, some of you forex traders, and some of you forex doubters (no volume) will show up. I will be there even as I struggle with the use of VSA.
Which brings me to the second. I have attached a chart from earlier in the week that was taken for my benefit. Yes I know its after the fact, kiss my A** if you have a problem with that !!
The use of candles is not in honor of Todd Krueger, but rather because Jperl uses them. The volume is similar to what one now sees on most TG charts, yet not all that different from what was recommended here. Blue for increasing volume, Red for decreasing volume, and Fuchsia for volume less than the previous two bars.
To the chart.
There have been some things written about seeing terms like VWAP and SDs in the VSA thread. Well, Tom himself has said the next most important thing after volume is support and resistance. How one finds support and resistance is not really defined, except for the use of channels/ trend lines. Trend clusters are not disclosed (which is one reason TG lies when they say there are not a black box-if they don't disclose everything that's black box).
Well, I have found that HUPs (Hold Up Prices) are extremely good for horizontal S&R areas. In fact, it goes deeper than that. With the use of HUPs, one is able to use one chart timeframe rather than multiple timeframes. Okay, apparently I am still too upset to post. So here's the chart, make of it what you will.
-
Attachment shows the rest of the day...and my continued confusion and frustration over this issue. Todd Krueger used to call this the "polar bear in Hawaii". A "No Demand" (the polar bear, N.D. being a bearish signal) showing up where the bloody thing don't belong. Todd used to just dismiss these anomalies, but I think we can do better than that, at least I hope so. Long ago I queried the VSA#1 group as to whether we could come up with a VSA-based logical explanation. Why IS it that No Demand, and No Buying Pressure, so often show up at the beginning of up-moves??? This is when I'd like to get in long, but these contrary signals keep my finger off the trigger, and I miss the move.Anybody got any good advice here?
Ouch! LOL!
Repeat after me:
I totally understand that consistency is more important than being right. Having desire to be right is for armatures and making money consistently is what the real pros do. I am striving to be a real pro everyday by focusing on what is proven to really work and which produces steady profits while protecting me if a am wrong.
Nice pick out CW and Eiger. Two great posts that help clear up a difficult situation that is not that uncommon. Thanks all.
-
Tasuki;
Looks like you have a narrow range up candle with volume less than the previous two bars that is closing in the lower portion of its range. These all point to No Demand. However, the next bar is up, which means it is really more indicative of No Buying Pressure.
Take a look at the candle just prior to the "shake out" with Ultra High Volume. On this candle, buyers stepped in (demand entered). We know this because the next bar is up. If that candle was truly all selling than then next candle would not be up. But now as price falls back into the range of this heavy buying area we are seeing no buyers on up candles. Simply, dispite the Shake Out, the market is weak not strong.
-
I found this post on "Re: Classic VSA Setups Per Tom Williams Original Material" interesting and have nominated it accordingly for "Topic Of The Month January, 2009"
-
I still can't seem to get the attachments button to work. I click on manage attachments and get an error on page icon on the bottom leftside of the screen.
-
...There are 2 places where this trade can play out. The "soft" open. This is the open when the market starts trading again on Sunday night. The other place is the "hard" open, which is around 0200 EST when London comes on line for the week.....Results:
As the Forex traders amongst you know, the "soft" open or low volume time of the Sunday evening open is really not a good time to be trading. The London open has much more volume is when the BBs really come into the market. With that said, here is how things worked on the soft:
Chart 1
We opened up and were not brought in to the market at SD1. Eventually we get an entry at SD2. This comes after we see some supply enter at SD3. But that is VSA so pay no attention to that. An entry at this point doe lead to us being stopped out.
Chart 2
The "hard" open. The hard open is when London starts trading. It is usually at 0200 EST but sometimes we observe increasing volume prior to that time which serves to alert us the BBs have come to play. Note on this chart that we have a pure Shapiro Effect entry about 8 minutes before the 0200 hour. Our stop is placed at SD3d3 which is the third standard deviation above a three day VWAP.
Chart 3
It does take some time, which is why Jperl calls them position trades I believe, but our profit target is hit roughly 100 pips later.
If you were starting your day with the "hard" open, then you would of course only have made this trade. Depending on the number of contracts, you could take some off the table here and hold some on for a possible move down to SD-1. And again, if the distribution is going to remain symmetrical, then a move down to SD-2 would be in order.
**Having trouble attaching files at the moment**
-
VJ,Where do we learn more about jprel (or is it jperl?) and this work you regard so highly?
Taz
Jperl's thread is in the Market Profile section of the TL boards.
-
I found this post on "Re: Classic VSA Setups Per Tom Williams Original Material" interesting and have nominated it accordingly for "Topic Of The Month January, 2009"
-
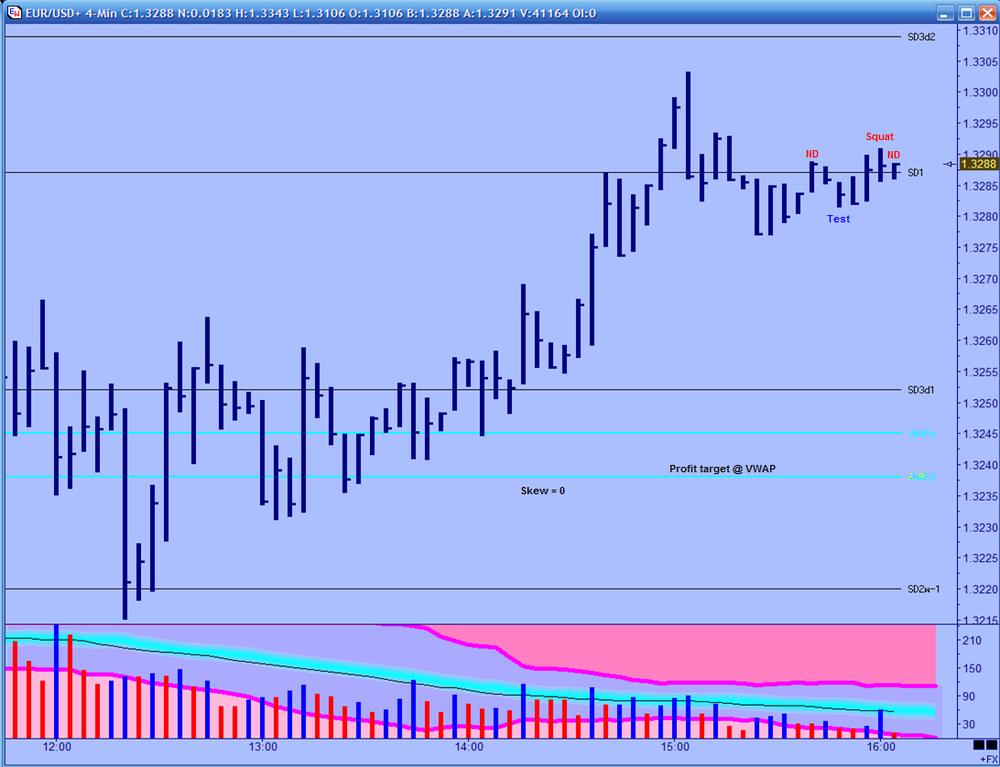
Just wanted to show a nice set-up via Jperl's position trading idea.
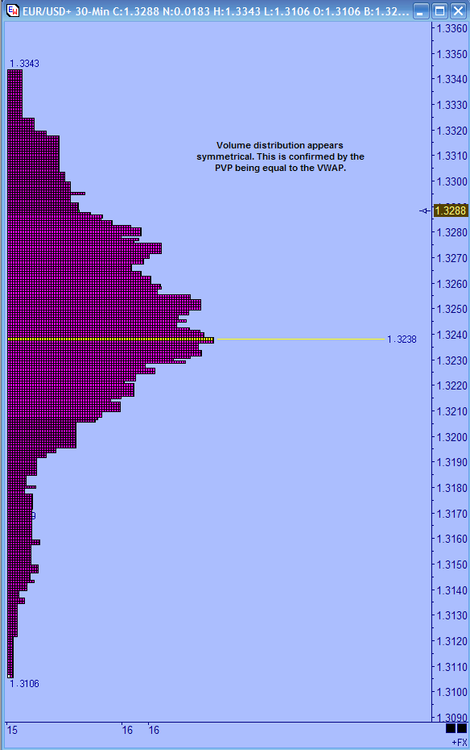
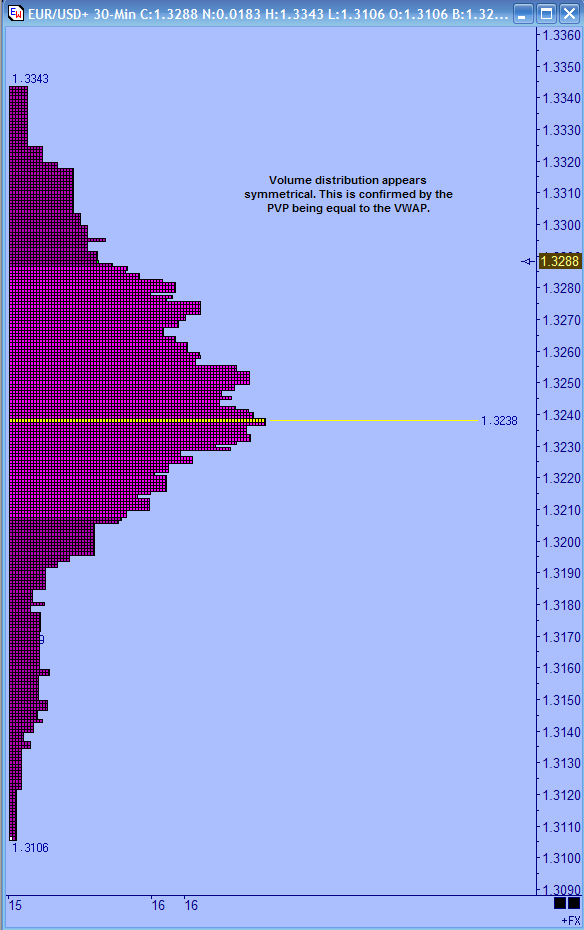
The first chart simply shows the volume distribution for Friday. You can see that it does appear to be symmetrical. This is confirmed when we look at the second chart and find the VWAP and the PVP are equal. On the second chart the PVP is in yellow and the VWAP aqua. If you look closely, you can see the yellow of the PVP label, but the line cannot be seen- it's underneath the aqua.
Let's look at the set up using what we have learned.
1. Since the day ended with a symmetrical distribution, we know that for this to continue price must trade down to (and possibly below) the VWAP. Therefore our trade idea would be to trade towards the VWAP. As price is above the VWAP, this would be a short trade and a counter trend trade.
2. As it happens price has closed at the 1st SD of the VWAP. Leaving the VSA out of the mix, we can see that the last bar is an up bar that trades thru the 1st SD. According to the Shapiro Effect, we could therefore go short on the first bar that trades lower than the low of this bar. Our Price target would be the VWAP/PVP.
3. If price moves up, we would still be predisposed to take a short trade at the 2nd SD. Again, if the distribution is going to remain symmetrical (and there is really nothing that says it must) price needs to trade down to the VWAP. More exactly, for the VWAP and the PVP to remain equal, price has to trade down to the VWAP.
There are 2 places where this trade can play out. The "soft" open. This is the open when the market starts trading again on Sunday night. The other place is the "hard" open, which is around 0200 EST when London comes on line for the week.
If I understand correctly, the place for a stop would be somewhere above the 2nd SD. This is because the trade is still valid at the 2nd SD. Personally, I do not like that. There is another HUP just above the 1st SD: the 2nd standard deviation of a 3 day VWAP. This is where I would place my stop.
I will just note that while it is hard to interpret the last few bars of a Friday, we do see low volume up bars and a squat. The last bar on the chart is No Demand and this looks good with what the statistics might be pointing to.
If you were to be trading multiple contracts, you would want to take some off at the WVAP and then hold some whith an eye towards the 1st SD below the VWAP. If price moves up to the 2nd SD first, you would want take some off at the VWAP and target the 2nd SD below the VWAP as you ultimate target.
Hopefully, Jperl will let me know if I have this correct.
-
VJ:I have no problem with the Forex tick data. However I am more concerned with the quality of data. It seems to me that only Esignal has the most reliable tick data on Forex. Whereas CME volume data should be easily accessible and uniform among all data vendors...
You are correct. Esignal probably does have the most reliable tick data as it is a combination of over 60 banks/brokers I think. It gives you the ability to "ignore" the data from certain sources like brokers known to for price spikes (read bucket shops).
....I find it refreshing that you are combing VSA, Allan's Box, Murray Math, and Jperl's stuff. Is this something that you put together recently, or you have been at it for a while ?I messed around with Allan's box for a bit. It is a great way to use Murrey Math in a slightly different way. Instead of using the high and low of 62 days or 32 days or whatever, it takes yesterdays high and low and creates the mm lines from that.
But I have found a new home with Jprel's work. It is absolutely amazing stuff. The HUP lines are a great tool.:
1. They create exceptional places (areas) to look for VSA set ups.
2. They create high probability natural profit targets.
3. They create good stop loss areas.
To be sure, I don't use them exactly as Jperl presented them, but I think his intention was to provide a jumping off point. Not a rigid system to blindly follow.
-
What is wrong with using the volume for the FX Euro futures contract on the CME ?I don't know if you have ever heard of Tim Morge ? He certainly think it is pretty cool by using volume bar chart derived from CME data.
OAC;
You and I will probably never agree on this, but there is volume in forex. It is tick volume not true traded volume. However it still represents activity which is the same thing that true traded volume represents. No it is not 100% prefect or an exact match, but it is what we have. As far as using currency futures volume data, there is nothing wrong with it at all. I suspect you are really asking, "Isn't it necessary to use currency futures volume?". My belief is no.
With that said, I would be interested in learning a bit more about this. Any suggested readings?
-
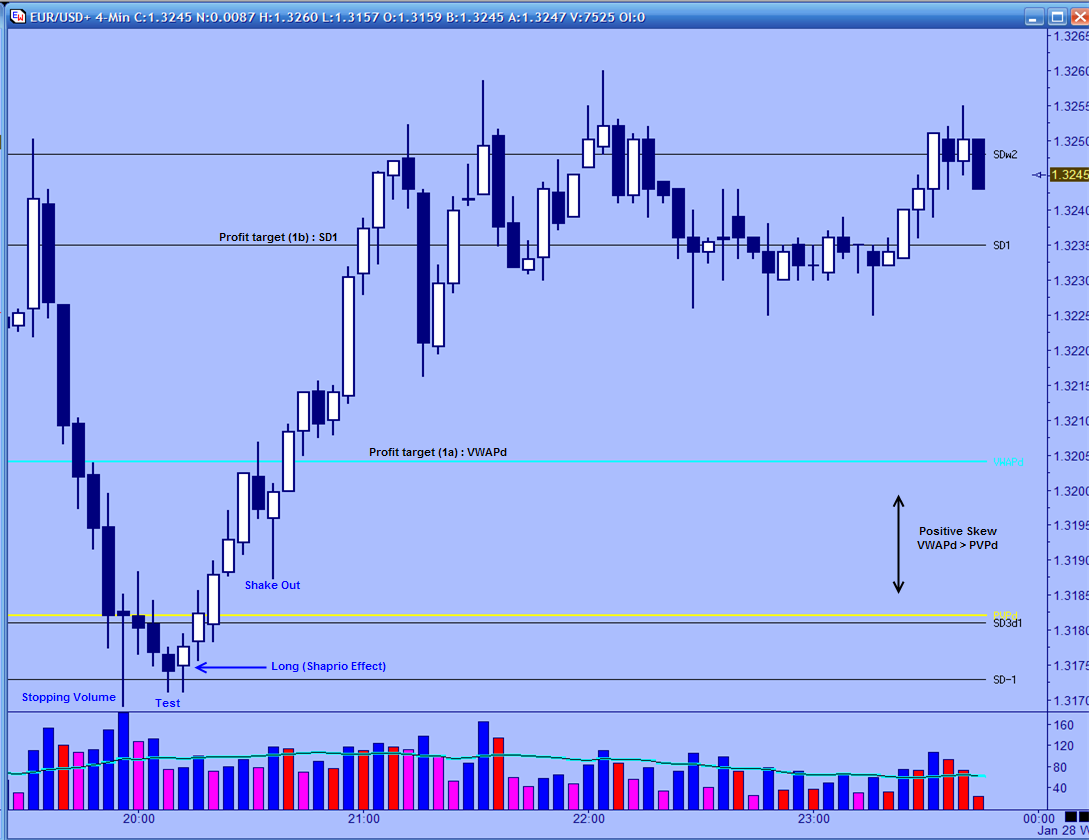
We now have two new VSA threads that make no sense to me. This thread (although I think it is time to start a III) has always been about 1. VSA the methodology (classic VSA if you will) and 2. Each individual posters use of VSA. Which would include other modalities. At this point, I don't even know where to post this chart.
I will post it here.
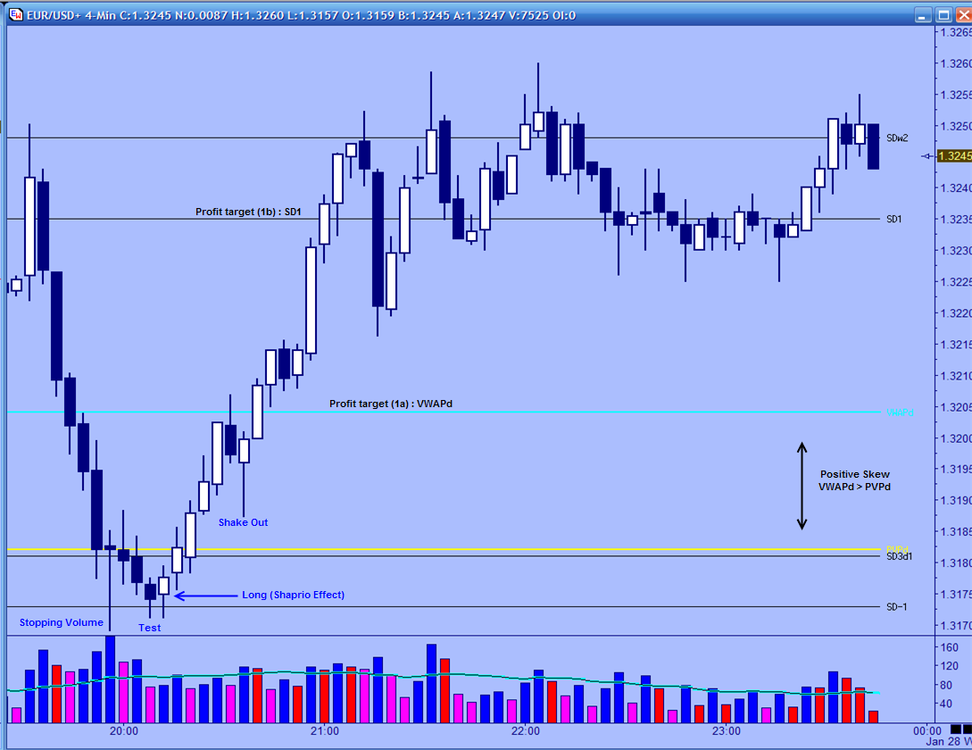
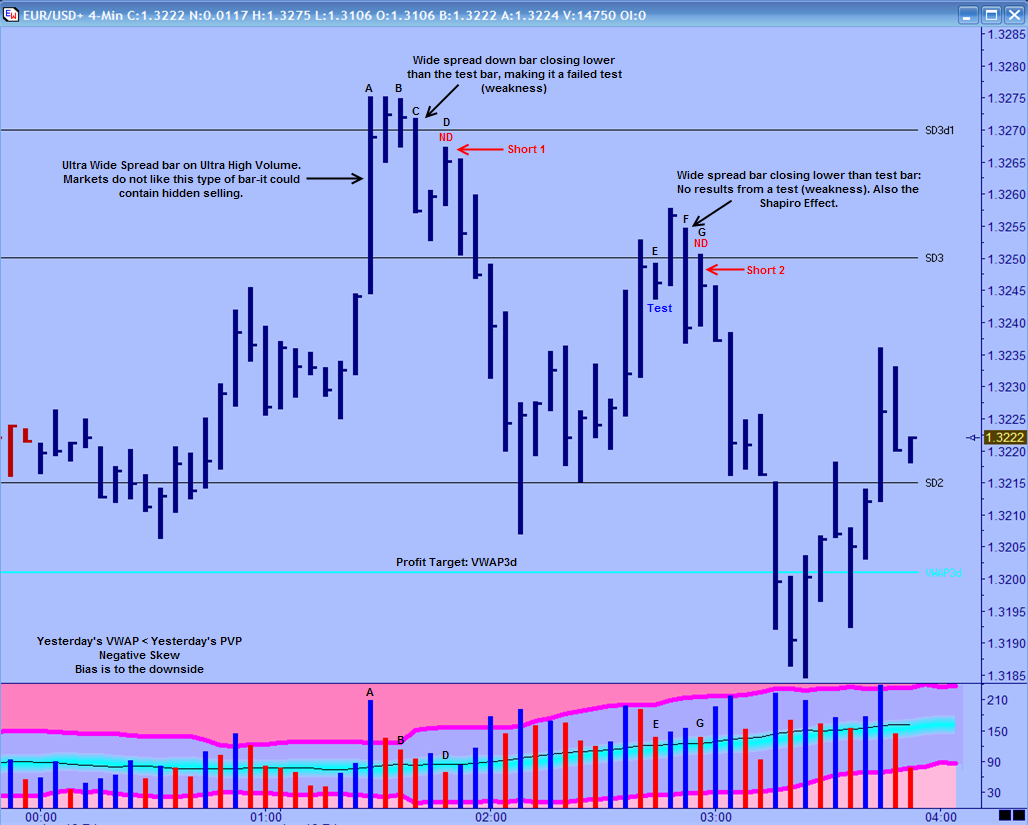
Before I get to the chart, there is something not seen on the chart that is important. What can not be seen is the VWAP and the PVP from the prior day. The VWAP is below the PVP. This is negative skew and set our bias for a "Position" trade (see market statistics thread).
On to what can be seen.
A: Like so many good set -ups begin with, this one begins with an Ultra Wide Spread bar on Ultra High Volume. We know the market does not like these types of bars. Why? Because there could be selling within the volume. Note that the next bar is up and not down. However there was still some (actually a lot ) of selling in this bar. While the next bar is not down, note how the volume drops off. Also note that the bar does not make a higher high and the range narrows.
B: When we see ultra high volume up bars we can assume they are weakness about 90% of the time. When they are not, we will see a test almost immediately after. B is a test two bars after the Ultra High Volume bar. It is an NR7 narrow range bar on volume less than the previous two bars.
C: Once this bar is formed, we know that the test has failed. This bar is a wider spread bar that closes lower than the test bar. For a test to be a good test we want one of the next two bars to be up, and we certainly don't want to see a close lower than the low of the test bar. Our background is weak. We have had an ultra high volume bar and a failed test. For some this bar is an entry as it is the Shapiro Effect on SD3d1 (first standard deviation of a 3 day VWAP).
D: This is our first possible entry point. It is an up bar on volume less than the previous two bars. It is no demand. Note that this bar is within the range of the ultra high volume up bar at A. This is important. In an area where there was once high volume there is now very little. Something has changed. Note also that this bar is finding some resistance at the SD3d1 Hold Up Price (HUP). Some may wait for the next bar to trade lower than the low of this bar for entry. Others will simply enter on the close of this No Demand.
At this point we have a price target of the VWAP3d. Again, we know the skew is negative from the prior day. We also know that the current PVP is above the current VWAP (both not shown). We simply can expect price to move from the standard deviation back to the "mean" or VWAP.
Moving on we have another nice set up for an add on, or entry if we missed the first one.
E: As price tries to move up past the 3rd standard deviation of yesterday's VWAP, we see a narrow range down bar on volume less than the previous two bars. This is a test. Unlike the test at B, the next bar is up confirming the validity of the test. But then F happens.
F: A wide spread down bar that closes lower than the low of the test bar. This is showing us "No results from a test" a sign of weakness. Note here that the volume is increasing. Increasing volume on a down bar usually does mean selling.
G: Our best friend. Narrow range up bar closing in the middle on volume less than the previous two bars-No Demand. We see No Demand as price tries to rise above the HUP. At this point we have weakness in the background and the market is making a lower high. That's the definition of a down trend. This is a good place to get short on the close of the bar.

-
2) for liquid and illiquid instruments, why do we think that the BBs are operating in concert with each other? The fact is, there is no evidence that I've seen that they act in collusion, and there is significant evidence from those who have worked in the big trading houses that they are just as much competitive with each other as they are with "the masses." However, one regularly hears VSA proponents saying that "the Big Boys are buying here, or selling there" when the truth is probably closer to "some Big Boys are buying here and other Big Boys are selling here." For living proof of this, listen to the squawk box for a few days and you'll see (OK, you'll *hear*) what I mean. So, the question becomes--how can they move the market if they are fighting each other?.
Tasuki, I have to take issue here. VSA does not state that the BBs are in some cigar smoke filled back room deciding to "take'm down today boys". On the contrary, VSA states that the BBs are in combat with both the herd and themselves. The net effect, or composite, of all the BBs is what is seen in the volume and price bar. It is true that many here say "the BBs are buying here", while it is more accurate to say, "the net effect of all the BBs action is more buying than selling took place".
Think about a test bar. The BBs (the bullish ones) are testing to see if there are any sellers underneath. But they are not testing for sellers amongst the herd only. They are testing for other BB sellers. If all BBs were in concert, there would be no need to test. Since as a group working as one, they would completely absorb any selling by the herd.
This is where the term "Composite Operator" comes from: what can be viewed on the price chart is the composite, the sum total, of all the BBs' actions.
-
They're leaving the room open for 10 hours. It would be worth it if I could stay up cause Brad is an awesome trader but I just can't do it.Enjoy it if you go.
as long as you log in within the first two hours, I think you could go to bed and then come back to it. LOL
-
TG webinar tonight at 1800 EST. Don't know how long it lasts, but the email says they will be trading the European open (forex) as well as the Asian session.Sorry, start time is 830 pm (2030) EST.
-
TG webinar tonight at 1800 EST. Don't know how long it lasts, but the email says they will be trading the European open (forex) as well as the Asian session.
-
Manby alas attempts to analyse every bar on the chart, sound good on hindsight charts but when he tried it on realtime, it was 50/50 at best.Price/Volume via VSA/Wyckoff has value at relevant support/resistance levels, rest of the time price is travelling from one level to the other and trying to read meaning into every bar is pretty futile.
6Ws and 6Ls will get you into a bowl game.
Batting .500 will get you into the Hall of Fame. (batting .300 will get you in-that's NOT getting a hit 7 out of 10 times).
It is not about being right; it's about winning big when you are right and getting out quickly when you appear to be wrong.
-
......Of course there is nothing new here though it is probably worth mentioning Charlie Drummond who has arguably put forward the most rigorous and complete framework for multi time frame analysis. Still going strong in his 70's. Sadly his work is not in the public domain though some of the ideas have slipped out....The late Robert Krause did some good work in this area too. While I am not big on indicators, I like his use of one chart with indicators from higher timeframes. Mainly because it allows the trader to look only at the "entry, exit and stop" level chart-the small timeframe, while getting trend/momentum/support and resistance from the higher timeframes.

Trading with Market Statistics. IV Standard Deviation
in Market Profile
Posted
The platform is Ensign Windows. It has price historgram and VWAP with 2 SDs. You can create a DYO for the 3rd ones. Most other platforms can replicate the tools here though.