
Welcome to the new Traders Laboratory! Please bear with us as we finish the migration over the next few days. If you find any issues, want to leave feedback, get in touch with us, or offer suggestions please post to the Support forum here.


VolumeJedi
-
Content Count
125 -
Joined
-
Last visited
Posts posted by VolumeJedi
-
-
THE_UNDECLARED_SECRETS_T HAT_DRIVE_THE_STOCK_MARKE T is same as Master The Markets. I think its the earlier version.Yes, this is true. It doesn't have the TradeGuider stuff obviously and according to Eiger there are more examples and they are more clear.
-
Hi traders,This is my first post here, though a mute spectator since a month.
Anyways, please see the below EOD chart and let me know how it looks to you from the VSA angle.
Some background info: After selling pressure of yesterday(2nd last candle), the price again sunk today in the first few hours of trade. The volume of contracts traded was not high though. Then, in the next few hours, the volume and price both started shooting up and the price recovered from its low to close on its high, with high volumes.
So what do you think? Is this indication of strength or weakness.

(Note: I have purposely blurred the name of the security to avoid any bias).
Thank you,
-Bunny.
The trend is up. The last candle appears to make a lower low and not a higher high. It also appears to close near its high. The wick shows support (demand) on the bar. As ther volume is increasing but does not look excessive, I think the candle is strong. It may be a from of a Shake Out.
-
Thanks for the chart.
This is how I see things.
1: Wide Spread up bar on ultra high volume. This is the highest volume bar up to this point ( I am not sure if this is an open or what cause all the previous bars look like they are part of a low volume period). Anyway, the close is off the high and the next bar is up. Even though the next bar is up, the close tells us that some supply entered here. Why else would the close be so low in the range? With the price action behind, this may be pushing thru supply, which would be bullish, but then we need to see it tested almost immediately.
2: This bar appears to be a bit narrower, but the volume increases. So we have an increasing volume bar closing off the high and this time the next bar is down. More weakness enters here.
3. Volume less than the previous two bars on a narrow range bar closing down. This is a test. This not a very good test bar. We would rather see this bar make a lower low and close in the middle or high. It does not. Plus the range here is a bit wide. This test like bar is confirmed with the next bar up.
4: Increasing volume (second highest since 1) on a average ranged bar that closes off its high. With the amount of volume here, the range should be wider and the close should be higher. So there is some weakness present here as well.
Price may be rising, but weakness continues to appear. This can happen as there is a such thing as momentum.
The bar after 4 is up but the volume is down. MTM tells us that in general, bearish volume is increasing volume on down bars and decreasing volume on up bars. This is the latter.
5: Another test. Note that the range here is narrow. While we don't get a lower low on this bar, we do get volume not only less than the previous two bars, but also less than any candle since 1.
6: Wide spread down bar that closes below the low of the test bar. This means our test has failed. As you correctly pointed out, prior to our test we have begun to see lower lows and lower highs. After seeing weakness enter, we would be looking for this situation-a change in trend.
Basically, every up bar starting with1 has been weak. The trend eventually changes and then we get the test at 5. At that point it is a bit risky to take a long. If 5 did not fail, you would likely see a "re-test" bar soon that you could use for a long entry.
-
Great post.
Very nice to see you back. We all missed your brilliant insights.
-
Lots of questions there.
Ultimately it is a personal choice.
VSA works well in all markets and on all timeframes. Many traders trade the indices , futures or spot forex. All you need is a freely traded market that has volume (contract) or volume (tick). There is (tick) volume in forex.
Ironically to many, the signals in forex are really good. The claim that there is no volume since there is no central exchange. Never the less the signals are often clearer and more idyllic or text book than in the emini. Personally I think this has to do with competition. Remember the smart money is not only in a battle with the herd, they are in a battle amongst themselves. In my opinion this may lead to less idyllic signals at times in a market littered with smart money. Just a guess.
As far as stock go, the only thing I can say is make sure it's a liquid stock. VSA will not work well, if at all, on a "penny stock" with little volume. Timeframe for stocks does come into play because of the "day trader" rules.
I hope this helps and welcome.
-
Hi. Take a took at the attached chart. During the time of trading i was finding it a little difficult to interpret the price/volume/spread action after demand entered the market. The next 3 bars seemed weak ,so i took a short position here on the narrow spread up bars marked by the yellow crooked line which triggered my stop loss. The reason i initiated the short position was because there was no effort (volume) on the up move , the spreads were reducing as the price was increasing. Now in hindsight i am using a term that Sebastain Manby uses , the market was resting. How do we determine when the market is resting or a price is going to tank ?
The bar you denote as stopping volume is strength. With immediate strength in the background, why would you consider the next bar weak (no demand) ? This happens often and is the lull before the up move takes place.
The very next bar is a down bar on even less volume this in no supply. The next bar (green) marked low volume up bar is a test. Some tests close up as this one does. You should be looking to enter the next bar if it makes a higher high than the test. As it does.
Be careful of this as it happens often and many people mistake the no demand for weakness in this situation. Just look out for a "no demand type" bar on a nascent up move directly following strength. It's not weakness.
-
Good day!I am new to the thread and would like to thanks to its founder Eiger and VolumeJedi, who also provide amazing analytic on volume to the thread. After reading your materials I really understood much more then after reading Tom Williams!
VolumeJedi, I would really appreciate if you will comment / send your suggestions regarding attached picture.
There are indicated two potential trades – the first one long, the second one – short.
I have some doubts there to enter the trades.?
So, looking for background.
After the second candle was formed after candle 1, we could understand that under VSA, candle one has stopping volume or has selling climax action. It tells us that we should look for signals to enter long positions. The signals should be tests for No Supply.
The questions is, could we count as tests for No Supply bars 2 &3 as they both has volume less then 2 prior candles?
Or should we wait then local resistant will be broken, but at which candle we should enter long then?
As for short, we can see high up candle which closed not at its top and the candle has very high volume, it tells us, that SM was selling and third candle after A confirms it. After the third candle price straightly drop down. There were 2 candles B & C. Both of them has volume less then prior 2 bars. The question is there is the best place to enter short?
Would be nice to get your comments here,
Regards.
Question #1 (long):
Every trader has to make his or her own choices. You correctly identified the strength that entered at 1. Point 2 is a test, but many people would miss this entry. Point 3 is another test/no supply type candle and another viable place to get long. More accurately, point 3 is no supply and the following candle is the test. If you wanted to enter when the high of 3 was broken, then you don't get in on the next candle. Your entry would come one candle later.
Take a look at point 4. The two candles prior to this are a two bar reversal. This is into your support/resistance area marked by line a. For many this is the best place to go long.
It comes down to how much background strength or other supporting evidence each individual trader wants/needs. If you are comfortable getting long at point1, then there is nothing wrong with that. Gavin, talks about "diamonds" changing colors before entering and I would think that at point 1 they would not be green. I only mention this to make my point of trader's choices. I personally don't like or use the diamonds from TG.
Question #2 (short):
Either would work. There is another one two candles later. This one is actually the best definition of no demand (on my platform at least because the volume is also less than the previous two candles). Based on your screen shot, it is a squat and still a good place to get short.
Back to B&C. Note that B does not confirm because C closes higher. If you were looking to enter when the low of B was passed, it doesn't come on C. C has an increasing spread so it's not technically no demand. It does show a lack of buying interest of the smart money never the less.
-
............ Neither am I able to explain why the 01 sept heavy vol down bars produced little downside move.Welcome.
The high volume down bar marked 3 white diamonds is tested over the next 3 bars. Each bar has less volume as they close down. The third test is followed by an up bar and forms the second low of your channel.
-
Do a search. I believe it is in the coding forum.
-
I have an example I would like to share, and I would like feed back in regards to the next day's instication of a buy. If you see in the attached files, this particular stock closed at $2.43, which is the same as the bars low.In order for the next bar to be an indication of a buy:
1.) Does the next bar have to open below the previous bar's close; the high is higher than the previous days high, and the close has to be higher than the previous bars high and the volume has to be less than the volume on 8/28?
or
2.)Does the next bar's Low, and Open both have to below the the previous day's bar, and the high has to be lower the the previous day's high, and the close has to be higher than the previous close?
or
3.) Simply, tell me what to look out for...
There is no buy there. 1 bar back is a test. This test fails on the next bar as price trades lower on increasing volume. 5 bars back is a wide spread down bar on ultra high volume where some demand did enter. But that last bar made a lower low and closed lower than that bar.
Your best options are to do nothing and wait for a successful test. Or look for a narrow range up bar on volume less than the previous two bars to get short.
-
The term WRB means Wide Range Body. The body is the distance from the open to the close of the bar/candle.
Many have incorporated WRBs into VSA but it is not technically a part of VSA, as VSA does not look a the open. There is a small thread in the VSA section on WRBs take a look. For more complete info go to eliterader and do a search.
-
You can look at volume and compare it to range. In addition, you can compare the close "result" to the range to see what the "effort" or volume did.
It's called volume spread analysis.
-
Don't know how useful this is (the fact that I don't trade the S&Ps not withstanding LOL), but I do get a kick out of listening the these examples. Thanks all.
-
Just my 2 cents.
One does not have to use obscure timeframes to "get ahead" of the herd. The issue is that the herd is not looking at what matters, regardless of timeframe, and that is price action. They are concerned with arrows and candles turning green or this indicator going above that line or line A crossing line B.
In fact, if one uses the same timeframe as the herd, one would be able to both see what the herd does, and more importantly, does not see.
Ultimately, markets are moved by imbalances in supply and demand. These imbalances are created by the BBs. These BBs are on all timeframes, but if they want to manipulate the herd, then they have to be on the herd's timeframes.
-
Area A begins with the large red candle.
I am refering to the three candles prior to this that are not contained within the area marked A.
-
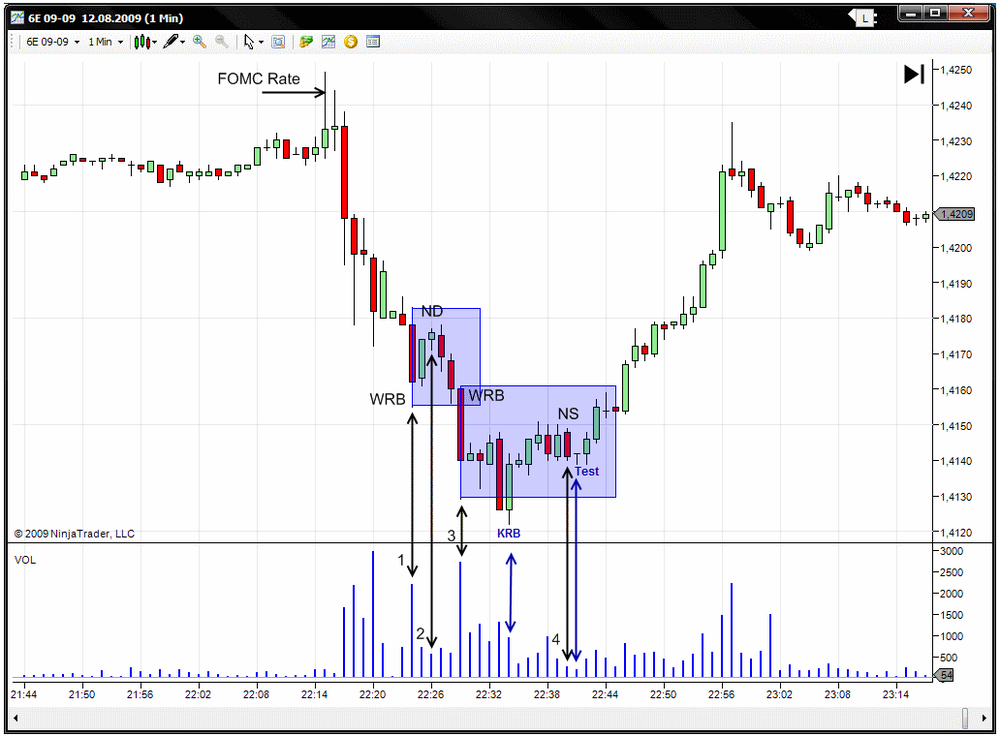
Returning to the above chart, I've got a question about how you know when the trio WRB/KRB/ND gives a bullish signal and when a bearish signal. Any insights?This is a standard dilemna for VSA traders: you could wait for confirmation, that would clear up the picture, but then you might have lost the meat of the move.
Is there any clear difference between these two candle trios that would signal bearishness or bullishness without having to wait for confirmation?
Thanks,
Tasuki
Hi Tasuki. Great question.
From my perspective there are 4 major differences in the two areas.
Let's look at B:
1. The first thing of note is the Ultra High Volume down candle marked #3. Although this candle closes on its lows, the next candle is up. So some demand(buying) must of been "hidden" in all that selling.
2. There are 3 more candles prior to the trio in question. Note that these are NOT the same type of candles prior to the trio in the first set (A). As I mentioned, the first candle is up. It is a very narrow range and volume drops off. It is not no demand, however, as we have just seen strength enter. The next candle closes down but in the upper portion of its range with a long lower tail. Here volume has increased. So we have a down candle on increasing, but not excessive volume closing in the upper portion of its range. This is strength. The next candle actually is an engulfing candle. Not VSA but another sign of strength.
So we have more evidence that there is strength in the market prior to this trio of candles in B. Now look at the volume of the dark candle that starts the trio. It is not as high as the volume marked #1 in A. Nor is it as high as the first down candle in B. Wide spread down bars are decreasing in volume. Another sign of strength.
The KRB basically shows professional support in the market and negates any weakness that might be seen on the next candle, which is narrow and up on volume less than the previous two candles.
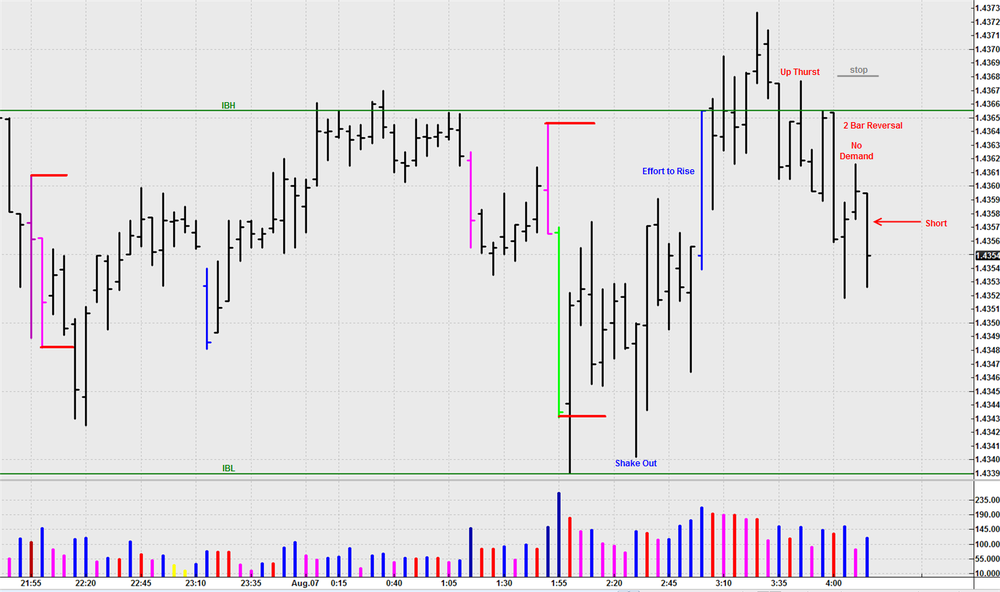
Let's look at A;
1. There is a lot of weakness in the background. Just prior to the large dark candle we have an up thrust type candle with follows a low activity narrow range down candle. Notice how this candle dropped from the previous candles close? This looks like a test candle. With the next candle closing down and lower than the low of the test candle, it is a failed test. Weakness. The very next bar is an Effort to Fall with high volume but not as high as some prior bars and not as high as the bars in B. The volume on the "KRB" is very low, not showing that much professional support. To get technical, we would actually like to see the KRB not close on its highs. So for some it is not even a key reversal candle.
But that "technical" definition is of little import. The next candle is no demand. A narrow range (NR4) candle closing up and off its high on volume less than the previous two candles. We have seen and Effort to Fall and now we see little activity to the upside as we retrace that area. The BBs must not be interested in higher prices.
Obviously this is completely hindsight but I hope it helps.
-
Welcome and thanks for the post. This is a great place to learn and share ideas.
#2: yes this is the place to get short. Narrow range up bar on volume less than the previous two bars. You can short on the close of this bar, or you can place you sell order at the low of the candle and wait for the next candle to trade lower and bring you into the market.
BTW that WRB looks like an Effort to Fall, so you not only have the obvious trend to the downside, you have an immediate sign of weakness in the "near background".
#4: There are two candles that jump out at me. The candle after the one you labeled NS (No Supply). This is a narrow (NR4) bar that makes a lower low closes on its highs with volume less than the previous two candles. In fact, the volume is almost non-existent. This bar close up, but it is a test. This is your signal to get long.
The second candle is the one I have labeled KRB (Key Reversal Bar). This is a clear sign of strength in the market. It closes higher than the previous bar, higher than its open, and makes a lower low than the previous bar. Volume is lower than the previous bar but not too low.
The previous candle is another Effort to Fall candle. Note, however, that it does not have anywhere near the volume as the Effort to Fall at #3 or #1. Simply, effort is decreasing. Or to put it in physics terms, effort in the opposite direction is increasing. Hence we end up with effort but no result.
-
For me, anything that is market-generated information (Open, High, Low, Close, and volume) is not an indicator.Price and volume are all the markets generate.It seems I have not been clear.
I put Market Profile in quotes because if you use a strick definiton Price ITSELF IS AN INDICATOR....The Wyckoffians would say, much more articulately than me, the price is contiguous. It flows independent of time. Thus any attempt to parse this flow into compartmentalized data points is to create false snippets of prices true nature. In other words, a 30 minute chart only indicates as false picture on prices natural flow. Since price is contiguous, there is no open, there is no close, there is no high and there is no close. These notions are merely constructs or indications of what prices actually has done over an artificial timeframe. If something gives an indication, then by definition it is an indicator. Therefore price itself (as seen on a bar chart) must be an indicator.
I do not see price as an indicator. I do not see Market Profile as an indicator. I do not see volume as an indicator.
Market Profile is the visual representation of the price/value discovery process. The aution.
-
Certainly there are many ways to look at the market.To me this sounds a little idealistic.
Allow me to formulate another view not for theoretical reasons but because I learned that it can make trading efficient:
Why are there people that keep markets alive?
Because some people make profits through them. And markets will be kept alive only as long as some people (has to be always the same) make really big profits. (If it were only small profits they would start looking for other fields).
Therefore the main purpose is to give the few a chance to make big money.
On the other hand this implies that they have to take it from the masses.
So in this view it is not about finding agreements or disagreements more on finding areas of comfort (for the masses) which quickly turn into traps.
It is more like:
Where do the masses go?
How can we make them feel comfortable (in order to build bigger positions)?
After that, how can we shake them out / make them panic?
This has already been answered by Sevensa.
There are farmers who want to hedge their crops. Companies issue stocks to finance business expansion. Individuals own stocks to become board members. Airlines want to make plans now based on the perceived value of oil some time in the future. Markets exist for this.
Yes there are a few that can make money on inefficiencies and manipulation but markets exist in spite of them not because of them.
-
Hi there,i want ask you how consider this chart from point of view strength and weakness.
-Main Trend is UP.
1. Down bar close on low with excessive vol (possible strength)
2. Up bar closing on high with high vol (this bar for me confirm buying on 1. bar) so we have background.
3. Up bar with low vol. same spread and same close on high ( weakness - no demand for me)
4. Upthrust with high vol closing on the low another weakness
Now more weakness appears then strength so can be this upthrust consider as a new background ?
it going with momentum that is down. but prev background was good coz it go with main trend.
now iam confused:angry:
can anybody make a comments for this situation
Thanks!

Thanks for posting.
Demand did enter on bar 1. However as you correctly note, there is a weak background. The directional movement was to the downside and after 1 it is slightly up to sideways. Doesn't look like enough demand entered to soak up all the supply. Note the two up bars (2&3) have decreasing volume. Volume spikes back up for the thrust 4, but the close is near the low and down from the previous bar on a wide spread bar making a higher high: a sign of weakness. I would be looking for a narrow range up bar on volume less than the previous two bars to get short....
-
The market's sole purpose is to find that level where there is a disagreement on value and an agreement on price. The market does this very quickly thru a process called an auction. Market Profile "taps" into this auction market process like few other "indicators" do. I put indicators in quotes, because if we stick to a strict definition of indicators, PRICE IT SELF IS AN INDICATOR as it indicates a level or perceived value and the subsequent cost.
The profile is not about the "what should be", it is about the "what is".
Market Profile is not merely theory or an academic school of thought.
It is the visual representation of the essence of a market. A market where buyers and sellers make decisions about value, then make transactions, then make new decisions and new transactions. This process repeats as new information is gathered by the market participants. One of those new pieces of information is of course price itself.
Simple elegance. That is simply powerful.
-
I think, you go to far to define roules for test bars....Great post Habi.
But let us not forget that the great masters and revolutionary artisans KNEW the rules of their craft BEFORE they broke them.
We start out with the black and white so we can understand shades of grey........
-
Brilliant stuff, VJ. Thanks very much. I'd like to continue this discussion with an observation and a question:Observation:
The more I mull over these test bars, the more complexity I see. There are a whole bunch of factors to consider, but there's one that we don't talk about much in VSA, and that's the spread between the open and the close. Tom Williams' word "spread" refers to the distance between the high and the low. He doesn't even consider the open. I think that may be a mistake, or at least that he's missing some potentially valuable information (I notice that most people's charts posted on these forums include the open price for each bar).
My software does not have an option of H-L-C bars and if it did I am not sure I would use it, as I do agree with you here. Take the best No demand bars, many times they turn out to be dojis (open=close). This fact is completely missed by the VSAer without an open hash.
Returning to VJ's chart in permalink 132, p. 17, those two pesky test bars, #4 and #7, would seem to show strength to me precisely because their open/close spread was wide--by the close of each bar, the bulls had pushed price nicely above the open, showing strength.Actually, I do not see these as tests. I see them as strong bars for the exact same reason you state: The spread between the open and close on higher volume closing up and on or near the high after first making lower lows.
Question for VJ:You say that a successful test bar should NOT make a higher high. Why is that? What's the psychology behind it?
They SHOULD make lower lows and NOT higher highs. First if the bars does both, then it is not narrower than the previous bar and this would be bad in the case of a test bar. As for the highs, if the bar makes a higher high and then closes lower in its range there is supply present at the top of the bar. In other words the BBs stepped in and pushed prices down when they reached a certain level. This could purport weakness, not strength in the bar.
If we reverse the logic, we see why we would want to see the test bar make a lower low: closing off the lows shows buyers stepping in. We do need to be a bit careful with that one however, because in reality a test bar is about probing for sellers not buyers. Which is why we like the volume low.
Let's review the conditions for a successful test bar:1) makes lower low---price probes the low to see if there's supply down there.
2) low volume---BBs do not find supply down below
3) higher close---close of the test bar should be above the close of the previous bar, showing strength. A lower close would be worrisome---not enough "oomph" (that's a technical term) to make price rise.
4) lower high--the high of the test bar should be lower than the high of the previous bar---this is the one I'm puzzling over..
3) should read lower close than the previous bar. This is the case of strength showing itself on down bars.
-
what do you guys/gals see here?
Took a loss on this one. Seemed to set up so perfectly.
While there is obvious strength in the background, here is what I saw:
1. There was an effort to rise bar : this is key in my thinking as we will see.
2. Price falls back below the Opening range high.
3. There is an Up thrust bar/trap up move type bar signaling some weakness in the market.
4. An absolutely beautiful example of a two bar reversal. The first bar closes near its high then the next bar is wider closes near its low, makes a lower low and not a higher high. This is a text book example of a two bar reversal.
5. Here is the kicker. A narrow (NR4) up bar on volume less than the previous two bars. No Demand. Note that it is back within the range of the reversal bars AND the range of the Effort to Rise bar. So where we once saw high volume, we are now seeing little interest (volume).
The bar just prior to the first bar in the two bar reversal did look like no supply and a possible place to get long. I thought the up thrust showed more immediate intent. Did I also mention the fact that the two bar reversal is a bounce of a "known" resistance line (i.e. the initial balance high)?
Thanks in advance.


[VSA] Volume Spread Analsysis Part III
in Volume Spread Analysis
Posted
There's really not enough information to answer you question.
There are a myriad of ways to paint the volume bars. One can paint the volume bars blue if the close is greater than the previous close and red if the close is lesser. One can paint the volume bars blue if the volume is greater than the previous volume bar and red if the volume bar is less than the previous volume bar.
Some people use the better volume indicator which has various colors for the volume bar based on things like range of price bar X volume.
One can use different colors to indicate many things and basically take the place of "squiggly" lines on the chart. Its just a question of how much information you want to be.able to gleam when you look at a volume histogram. I would also add that VSA looks at relative volume, and there are times when using colors helps accentuate the relative difference is size of the volume bars