
Welcome to the new Traders Laboratory! Please bear with us as we finish the migration over the next few days. If you find any issues, want to leave feedback, get in touch with us, or offer suggestions please post to the Support forum here.


Tradewinds
-
Content Count
911 -
Joined
-
Last visited
-
Days Won
1
Posts posted by Tradewinds
-
-
So re “What would you like to see different?” I would like to see more of my market and trading questions answered to my complete satisfactionI think a lot of the roads lead back to why people are motivated to contribute. What are people going to "get out of" answering questions? I'm not saying that I have the perfect answer, but we need to be asking the right questions.
None of us have all the answers. Collectively, our minds might get broadened and our perspective widened, and we might realized that a few more pieces of the puzzle actually exist. There is the individual good and the greater good. Neither are wrong, they shouldn't be exclusive.
When I first started using forums, I quickly accepted that I'm probably not going to get the perfect answer very quickly. And the majority of the time, I might even have to answer my own question. That's just the way it is.
-
Trendlines can be automatically "drawn" on a chart with EasyLanguage. Controlling where a line ends, can be difficult. Starting a new line is fairly easy.
If there can be multiple signals intrabar to start one trendline and end another, the new trendline may be created, but the old trendline may not get ended. To deal with this issue, I use past bars and exclude the current bar from the signal. Plus I end the current line immediately on the first signal for the new line, before creating the new line.
var: Peak(False), Up(False), Down(False); var: CurrentRzstnce(-1), OldRzstnce(-1) , OldRzstnceBegPrice (0); Peak = Up[2] and Down[1]; {-- Ends the current Resistance Trend line if a new peak signal fires, then Starts a new Resistance Line ---} If Peak Then Begin //Immediately end the current resistance line in order to insure that the line gets stopped. //End the current resistance line before starting the new one. If CurrentRzstnce <> -1 Then Begin Value1 = TL_GetBeginVal(CurrentRzstnce); Value2 = TL_SetExtRight(CurrentRzstnce, False); //Stop extending the current line to the right. Value3 = TL_SetEnd(CurrentRzstnce, D, T[2], Value1); //End the current line end; OldRzstnce = CurrentRzstnce; If OldRzstnce <> -1 Then Begin OldRzstnceBegPrice = TL_GetBeginVal(OldRzstnce); End; // The Peak signal occured two bars ago, so the start point for the line is T[2] and the start // Height is H[2]. The end price (height) is the same, this make the line horizontal. // Value1 = TL_New(iBarDate, iBarTime, iPrice, eBarDate, eBarTime, ePrice) CurrentRzstnce = tl_new(d, t[2], H[2], d, t, H[2]); // Create the new Resistance line Value4 = TL_SetExtRight(CurrentRzstnce, True); Value5 = TL_SetSize(CurrentRzstnce, 2); Value6 = TL_SetColor(CurrentRzstnce, Blue); End; -
Should I go to ET?Should we all go to ET?
I think that forums in general need to advance to the "Next Gen" (Generation). I've never seen a forum structure that I really liked. To many old threads. To many useless posts. To difficult to find information. To many people with an agenda. To many people with no agenda. lol.
I'd actually like to be able to delete my own posts. There may be times when I look at an old post and think, "That was kind of stupid". lol I may want to delete my own posts. But that's just a simple example.
Forums really need to figure out what motivates people to visit the site, and provide an incentive to do so. The "Thanks", the "Likes" are good, but I'd like to see a better rating system. Which brings up another thought. I don't know the specific "Thanks" that I got from someone unless I go back to the post and happen to see it. The "Likes" show up on my page which is great, but I'd like to know what posts I get thanked on also.
I don't understand why every time I click on a Blog from the Homepage it tells me it's been removed? If it's been removed, then why list it on the homepage? Is it that hard to fix? There aren't any members who know anything about coding webpages? It seems like there isn't really much member involvement in the site. One goal might be to give members a way to feel involved and invested in the site.
-
Here is some really simple code that I create:
That code doesn't work. This does:
-
Displays Time on Chart:
Once
Begin
Value1=Text_new(D, T, H, "Start");
End;

Text_SetString(Value1, "         " +  TimetoString(Computerdatetime()));
Text_SetLocation(Value1, D, T, Getappinfo(aiHighestDispValue));
-
this code only gives you the ending time of the bar.you should use currenttime:
Text_SetString(Value1, NumToStr(CURRENTTIME,0));
MultiCharts user can use CURRENTTIME_s, which gives the seconds portion of the time.
ps. there is a function/keyword to format the time into hh:mm:ss
Okay. Thanks. I learned something new. See, it's worth sharing code even if it's not perfect.

-
Hii..I am santosh from India, basically into daytrading NIFTY (NSE INDEX Futures)..
Is this what you are talking about:
National Stock Exchange of India
-
any1 could help me to convert this please
its only my simple indicator to plot local time on chart
Here is code that puts the clock on the chart. See the ELD file. I got it from the TradeStation, EasyLanguage Forum:
Here is some really simple code that I create:
Once
Begin
Value1=Text_new(D,T,H,numtostr(T,2));
End;

Text_SetString(Value1, NumToStr(T,2));
Text_SetLocation(Value1, D, T, getappinfo(aihighestDispValue));
-
DeMark trendlines AND their qualifiers are NOT subjective if one can read: "If any of the four qualifiers are true, the trendline break is valid" which leave all your other remarks pointless.....I wasn't stating that DeMark trendlines are subjective. The bullet points were taken directly from the PDF file. The PDF file stated that a problem with many trendlines is that they are subjective. That statement was made to contrast the objectively of the DeMark trendlines. Again, what I wrote was just a rewording of what is stated in the PDF file. I wasn't criticizing the DeMark method of trendlines.
-
Here's a PDF to read some more on the subject.- Trendline drawing can be very subjective - 10 people, 10 different trendlines
- Rules may be inconsistent.
- Need validation that trendline is correct
- Continue at trend break, or reverse? That's the question.
- Draw trendlines from Right to Left. Insures using the latest data.
- 4 different qualifiers to decide what to do.
- Something about a bar's "TRUE" high or low. Rules, but I don't know what the logic is.
- 3 Rules for abandoning the trade: Rules apply to the bar after the entry bar.
- Next bar opens below breakout level - Abandon trade (Long)
- Next bar opens below the previous close and closes down - Abandon trade (Long)
- Fails to make higher high - Abandon trade (Long)
- Trendline drawing can be very subjective - 10 people, 10 different trendlines
-
Plot as lower study:
var: TickRatio(0);

TickRatio=Upticks/Ticks;

Plot1(TickRatio, "Tick Ratio");
Plot2(0.5, "Center Line");

If TickRatio > 0.5 and TickRatio > TickRatio[1] then SetPlotColor[1](1, Darkgreen) else if TickRatio < 0.5 and TickRatio < TickRatio[1] then SetPlotColor[1](1, Darkred) else if
TickRatio > TickRatio[1] then SetPlotColor[1](1, green) else SetPlotColor[1](1, Red);
9:25 am - Ratio down, Might be near a bottom.
9:30 am - Price has lower low, but Ratio is going up. Bottom signal
9:35 am - Ratio and Price up hard. Take Long profit.
9:40 am - Ratio down, Possible re-entry long.
9:45 am - Price has lower low, Ratio is starting up. Confirmation up
9:50 am - Price up substantially, Ratio up, but not real strong. Probably not the peak
9:55 am - Price has higher high after some retracement, Ratio up Stronger. Exit Long. Wait.
10:00 am - Ratio plummets on price Higher High. Peak signal. Short.
10:05 am - Ratio down hard again, cover short. Wait for Short re-entry.
10:10 am - Ratio up substantially, but still less than 50%, Re-enter short.
10:15 am - Ratio is flat. If it was going higher it would have surged up. Stay short.
10:20 am - Ratio is down hard, be looking to cover short.
10:25 am - Ratio down, but very little. Momentum is slowing. Cover short. Wait.
10:30 am - Ratio and price up hard, Looks like we are going up. Long on price going down.
10:35 am - Ratio flat, but price up substantially. Warning. Divergence. Exit long. Wait.
10:40 am - Ratio flat, close up. This is you last chance to exit your long if you were stupid enough to stay in. (It happens).
10:45 am - Ratio down, but still over 50% line, and not plummeting. Re-enter long.
10:50 am - Ratio and price surge, look to exit long.
10:55 am - Ratio down hard on a doji. Don't wait. Just get out now. Okay? Okay.
11:00 am - Ratio flat, but down a little. Is it still going up? No guts no glory. Go long.
11:05 am - Dang!! Taking some drawdown for the first time this morning. :crap: Okay. Don't worry. You've already made a ton of money. Well, sweat it out. Hang on!
11:10 am - Ha Ha!! What did I tell you, We're going up! Making even more money! Okay, better get out now. Ratio going up hard. Wait to see what's happening.
11:15 am - Ratio down hard. Price reverting to the mean of the last bar. I don't know?
11:20 am - Price just barely has a lower low, and the Ratio just won't go down more. Heck, let's go long.
11:25 am - Wow! Ratio is shooting for the Moon. Don't be stupid. Just book your long profits now.
11:30 am - Lunch time. Maybe I could actually make a living doing this.

-
The ratio of the Volume Bias revolves around the Easy Language reserved Words:
- Upticks
- Ticks
- Upticks - Returns the number of ticks on a bar whose value is higher than the tick immediately preceding it.
- Ticks - Total number of Upticks and Downticks
As an example, I created a one line indicator: (TradeStation)
Plot1(Upticks/Ticks, "Tick Ratio");
That one line of code is all you need to plot a lower study that shows the ratio. Of course, there is all kinds of different formatting that can be done. The main calculation is: "Upticks/Ticks" That's it. If I wanted to see when the ratio goes over 50 percent, I could add a center line at 0.5
Plot1(Upticks/Ticks, "Tick Ratio");
Plot2(0.5, "Center Line");
Now you have two lines of code.
If you want the ratio as text on the chart, this one line of code will do that:
Value1 = Text_New(D, T, H*1.001, NumToStr(Upticks/Ticks,2));
That one line of code puts the ratio over the high of the bar.
If you want it to be in different colors, or only display on the current bar, and not all the bars, or do other formatting, that is more lines of code. But the basics are very simple.
- Upticks
-
Hi Tradewinds,You can get the same program for free with esignal. It offers all that Pat mentioned. The program has been around for a long time. It can work with either volume or tick data.
I've used it many times before. As to it's usefulness, I guess that's up for debate!!
Countdown timers are fairly common and available. I've posted a time based countdown timer, but you can get volume, tick and Kagi count down timers.
Depending upon the platform you are using, I would start with the official website of the platform. For example, TradeStation has a forum for their programing language.
I don't use the countdown timer as one of the main things I focus on, but it's good to know when the bar is about to close, especially if you are using time based bars.
-
Tell me why you want to be a trader:
-
This article is part of a contest and if I get your views I get points so for me it would be really appreciate it. I hope you don't find it as a span as at the end of the day I put a lot of effort on it.There is a section in Traders Laboratory for article's. Why don't you just post the article here? You won't get points, but you'll get thanked if people find it useful. Why are you in a contest to get points? What do you get?
-
My strategy involves a lot of trades; exiting, and then re-entering trades in the same direction. In order to do this, I need to know intrabar price behavior. Looking at a historical chart, it may not be intuitively apparent what good exit and reentry points are on the same bar.
So after studying some recorded videos, I've decided that the center point of a price bar is a good reentry target if the bar has a big range, and my indicators show that the trend is still not approaching it's end. Also, if it's a downtrend, I want the bar to have had a lower low to consider exiting and reentering on the same bar. Vice versa for an uptrend. I don't want to try to exit and reenter on a retracement wave.
I want to exit before a retracement, and reenter during the retracement, but not exit and reenter during the retracement. There's a difference.
If the bar was short, and I exited, I'd want to reenter on a close in the opposite direction of the trend on the next bar.
So I'm going to program something into the price bar and/or an existing indicator to show when the hl2 is hit in the opposite direction of the trend direction. A close up, or a close down, higher highs and lower lows are obvious, but price behavior intrabar may not be intuitively apparent. Candlestick patterns define price behavior with bar patterns, and take into account intrabar behavior by looking at the different bar configurations. But even so, that analysis may be done after the bar is closed. I'm looking for price behavior patterns before the bar has closed.
-
Take a look at the Vendors, Vendors, Vendors thread so you have an idea of who is posting what and why:
-
An animated film about the housing crisis, banks, gold reserves and money.
Entertaining, but not sure how accurate it is?
Who owns the Federal Reserve?
Who Owns the Federal Reserve? According to the "Fed"
-
By the way, love your quote on your signature...who said that?
That's my goal. :rofl: It's how I want to trade. My own quote.
-
Tick charts are a must for futures.
I see that is a 400 tick. Is that your shortest aggregation period? What do you use for your longer aggregation period? I've decided that whatever I'm using for my shortest aggregation period, the next step up is 3 times that. So 1 minute and 3 minute; or 5 minute and 15 minute. I'm just curious what you compare the 400 tick to.
-
Lows often run into strength and pop high as highs snap from weakness and go lower. As long as you are in the right part of the cycle!!Yes, there are strong highs and weak highs, and strong lows and weak lows. For example, you could get a price move down that is average, but a much greater than average selling volume. In that situation, sometimes price "coasts" lower from all that momentum built up from the selling.
How do you personally measure strength or weakness? I measure it mostly with the NYSE $TICK for trading the ES.
-
One of the ultimate questions in trading is:
- Where is the Top? and
- Where is the bottom?
And the answer is, that you can never know for sure. But you can determine how probable it is that a bottom or top will occur under certain circumstances. And that is the best you can do.
So even though lows can go lower and highs can go higher, but highs can't go lower and lows can't go higher, you can guess at where the top and the bottom might be.
I like oscillating indicators because they will only stay on one side of the zero line for so long. Yes, sometimes they fail to go back over the zero line, but they will also only go in one direction for so long. So even if the oscillator fails to cross over the zero line in the opposite direction, it usually only goes in one direction for so long. So you can guess at where the price is in the wave cycle.
When I buy highs and sell lows, the profit report doesn't do very well. Oscillators keep me in sync with the price cycle.
- Where is the Top? and
-
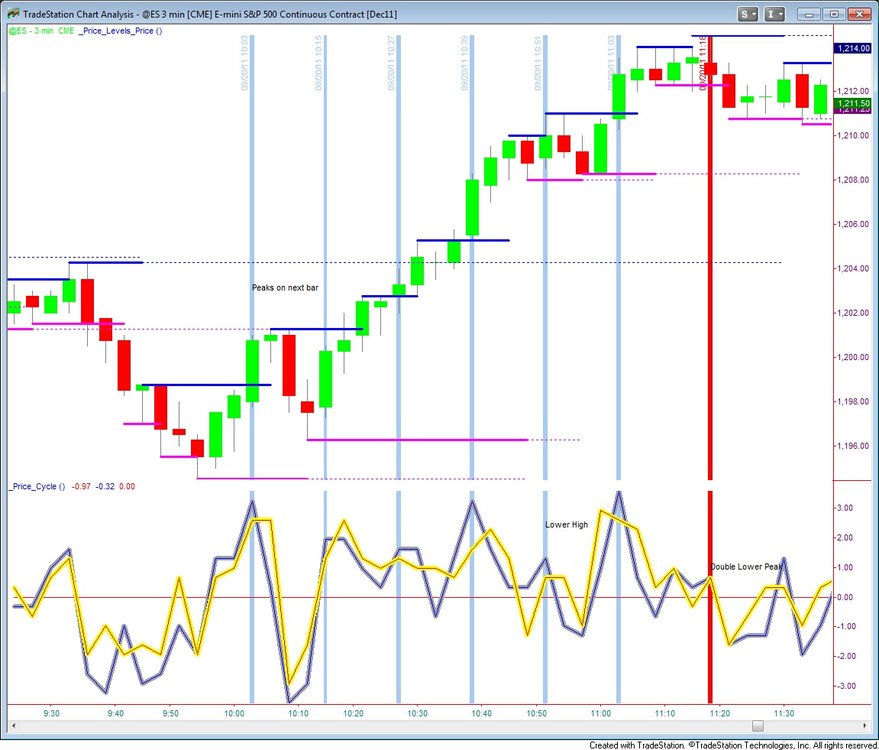
would you have a sample chart to go with the code?ES 3 minute chart.
This screen shot shows how I've colored the lines in the oscillator. Here's how I would read the peak signals:
Once you see some separation up between the Price Low line (Gray), and the Price High line (Yellow), . . . . AND the Yellow Line is either going up with the grey line, OR the Yellow line was going up on the last bar, you would exit your long position on the next bar when the close was up, and the close was higher than the close of the last bar. If you take a look at the chart, the close would have been up, and higher 100% of the time on the next bar. Yes, the historical chart shows one set up with a close down after the signal at 10:51am, but in real time there would have been a close up, AND the close higher than the last.
That strategy would have gotten you out of your long order almost at every price peak.
-
Counts down the time left in a minute bar.
{ This code is a modified version of _TimerExample4

v1.0	8 August 2011

Designed for TradeStation 9

This code is a simple bar countdown timer for minute bars.
}

using elsystem;

vars: TxtID(0),	IntrabarPersist DisplayTxt(" "), IntrabarPersist mins(0), IntrabarPersist secs(0),
	IntrabarPersist mins_str(""), IntrabarPersist secs_str(""),

	IntrabarPersist FrstCalc(true),

	Timer Timer1(null);

method void Timer1_Elapsed( Object sender, TimerElapsedEventArgs args )
begin
Calc_Time_Remaining();	//Call Subroutine that calculates the time remaining
Display_Text();			//Call Subroutine that displays time remaining
end;

//Calculate the amount of time remaining in the bar
// This is reasonably complex, but isn't particularly relevant to how the Timer object works
// so you don't need to understand it
method void Calc_Time_Remaining()
begin
//If its the end of a bar then set the countdown to the bar interval
if BarStatus(1) = 2 then begin
	mins = BarInterval;
	secs = 0;

	FrstCalc = false;

	//Turning time off and back on to sync it with the bar end
	Timer1.Enable = false;
	Timer1.Enable = true;
end
//Countdown our timer
else if FrstCalc = false then begin
	secs = secs - 1;
	if secs < 0 then begin
		mins = mins - 1;
		secs = 59;
	end;
	DisplayTxt = "       " + mins_str  +":" + secs_str;
End
//First approximation of bar time, before end of bar sync.
// It uses your computer clock to work out roughly how much time is left in a bar.
else begin
	//mins = BarInterval - Mod(MinutesFromDateTime(ComputerDateTime), BarInterval);
	//secs = 60 - SecondsFromDateTime(ComputerDateTime);
	//if secs = 60 then secs = 0;
	//if secs > 0 then mins = mins - 1;
	DisplayTxt = "Syncing...";
end;


//Set our DisplayTxt variable to the correct string
mins_str = NumToStr(mins, 0);
secs_str = NumToStr(secs, 0);
if strlen(secs_str) = 1 then secs_str = "0" + secs_str;
end;


//Display our countdown text
method void Display_Text()
begin
If secs = 10 then Condition1 = (Playsound("c:\wave\Ten.wav"));
If secs = 5 then Condition2 = (Playsound("c:\wave\5.wav"));
if secs <= 5 then
		text_SetColor(TxtID, Red) // Use Alert Color
	Else text_SetColor(TxtID, Blue);
Text_SetString(TxtID, DisplayTxt);
Text_SetLocation(TxtID, D, T, (H+L)/2);
Text_SetStyle(TxtID, 0, 2);
end;

once
begin
//Create the Timer, set it to update every second, but don't start it yet
Timer1 = new elsystem.Timer;
Timer1.Interval = 1 * 1000;
Timer1.Elapsed += Timer1_Elapsed;

//Create the text to display the countdown
TxtID = Text_New(date, time, (H+L)/2, DisplayTxt);
end;

//When the first real-time tick arrives...
if GetAppInfo(aiRealTimeCalc) = 1 then begin
//...start the Timer
Timer1.Enable = true;

//Set the amount of time left in a bar at the end of every bar
if BarStatus(1) = 2 then begin
	Calc_Time_Remaining();
end;
end;

Display_Text();

EURUSD Observations
in Forex
Posted
Support from what time frame? I can't see where the support line originated. Do you have any guidelines for what is support?