
Welcome to the new Traders Laboratory! Please bear with us as we finish the migration over the next few days. If you find any issues, want to leave feedback, get in touch with us, or offer suggestions please post to the Support forum here.


Bearbull
-
Content Count
277 -
Joined
-
Last visited
Posts posted by Bearbull
-
-
That is the fundamental divergence of VSA from its original source which is Wyckoff. and over 400 pages in 2 VSA threads without much clarity in sight, folks still engaged in "Find the Bar", "Look, there is hidden upthrust, a failed test, end of rising market etc" and ofcourse "90% of the volume is professional activity":doh:
-
There is enough material in the wyckoff forum (numerous threads and posts) and in the blog to enable you to arrive at some form of understanding of price action via price volume relationships.
-
Can someone give me a discription of price action & how it predicts change of market direction without using indicators.Thanks
Start with this link:
http://www.traderslaboratory.com/forums/f131/riding-the-wyckoff-wave-3739.html
Study that, then go to the wyckoff forum and study all the threads, blogs etc, you should have enough info. to understand something about price action via price/volume relationships.
-
Psychology regarding what? Read POST 31
Trading ofcourse, which is concerned with What? Entering a trade, managing a trade, exiting a trade, unless there is something more exotic missing here;)
As for volume, who is suggesting that it is the only tool required or necessary?
As for "most of us are intraday traders" wow, awesome;), what do yu think we do? go and study
"Trading the Wyckoff Way" thread and learn.
-
So recaping : a technical method must have correct entries and exit rules that will give you a good RRR, you must have the correct actitude towards trading, and as we mentioned yesterday psicology is also important ( managing fear and greed on your mind )... cheers Walter.
There is lot of free info. on the Wyckoff regarding this IMO, infact Db has addressed this issue countless times, one only has to take the trouble to study the posts and Blog instead of waiting for new posts all the time;)
Also Vadym Graifer has done an excellent job providing over 30 examples on how to gain entry, establish exit points and manage the trade. However all this requires considerable effort in understanding how trades interact in the market place, constructing strategies/tactics to exploit these interactions, thorough testing etc rather than waiting for some signals like End of Rising Market, and lo behold! there is a downbar on high vol, professionals have entered the market or some line crossing the other or indicator is overbought or oversold:)
-
Look into the Wyckoff forum espcially in Dbphoenix's blog on how to correctly use trendlines, support/resistance zones to gain entry and establish exit points in a logical manner, also study the pdf file there on Wyckoff analysis of 1930-31 market, as I have shown in the thread "Trading The Wyckoff Way", all the principles explained in that pdf document are as relevant now on any time frame as they were nearly 100yrs back.
-
For those who have genuine interest in judging buying/selling pressures in the market via price/volume relationships would do well to engage in multiple reads of the pdf file on "Analysis of 1930-31 charts" by Wyckoff available in Db's Blog. which BTW is from the original Wyckoff course.
This is devoid of any jargon which seems to be in vogue ie. no demand, no supply, hidden upthrusts, end of rising market, markets do not like upbars on high volume, professional/dumb money etc"
To illustrate that the principles outlined work in all markets and in all timeframes I have extracted some material from the file and posted it along with price action of the Dax market, on 2min charts for Friday 5th Dec, 2008.
Urge folks to take time and scrutinize all the charts along with the text and see for themselves how the various principles play out equally on day charts and 2min charts and their validity after passage of over a hundred years.
Incidentally the run into the close lifted the Dax some 200pts, the last chart is not presented for psychedelic effects but to reveal the use of trendlines, support etc as taught by Wyckoff, start with a low, join it the next low preceding the highest high. and so on. The job of the trendlines is to show trend, period, whatever support it exhibits in incidental, the support emerges from what happened to price at these levels as shown in horizontal red lines.
Here goes:
Wyckoff Principles:
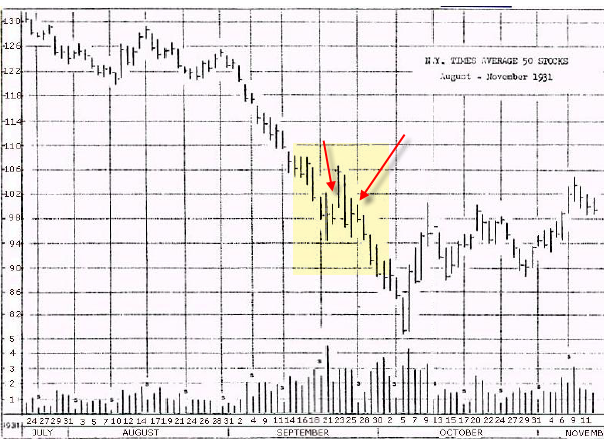
A sharp rebound should not surprise us at any time now and it probably is not far away for there has been no rally of any size since August 29th -- about three weeks. Seldom does the market run continuously in one direction for so long without a reversal of some sort.
September 21st, the average loses 4 points more, making a low of 94, but recovers 5 points by closing time and this makes it close above the previous day. The volume is 4,400,000 -- again unusually high and almost equal to the day before. This action, combined with the 8 point spread in prices for the day and the slightly higher closing leads us to cover our shorts with a view to putting them out again on a further rally; or, we may prefer to sit tight and depend on our recently reduced stops to keep our trades alive if the expected rally should fail to develop material proportions.
On the 22nd, the volume drops off to about 2,000,000 shares; the close is slightly lower and the range has narrowed. The net result of these three sessions is to leave the market practically unchanged at the third day's close. Downward progress seems to have been checked and the small volume on the dip back from the high of the 21st, on Sept. 22nd, implies a lifting of selling pressure. After such agreat decline within three weeks, this is an indication of more rally. This comes on the 23rd, and gives us an opportunity to sell short again while the market is still strong or when we see the rally is failing. Such an indication is given by the way it rallies on the 23rd. On this day, the average recovers to nearly 107, closing at 105½, but the volume falls off to under 3,000,000 shares and we therefore suspect that it is merely due to shorts who all tried to cover at once. Such a rally is too effervescent. It is not likely to last because it removes buying power which formerly existed, and leaves the market without support between the high point of the rally and the previous low.
The market acts just that way; on the 24th it loses 8½ points from the previous day's close and ends 3 points above the extreme low of the 21st. The constant volume, compared with the previous day, plus the rapidity with which theaverage yields nearly all of the previous three days' gain, confirms the fleeting character of the rallying power and the lack of important (good quality) demand. We conclude that the market's inability to enlist worthwhile support and its tendency still to seek the lows will probably induce a fresh outpouring of liquidationshould it break the line of support at 95.
The situation is still critical on the 26th and 28th when a brief one-day rally (on light volume) and a dip back to 95 bring about a slab-sided, or downward slanting formation, judged by the tops of the 23rd to 28th, which suggests the pressure is downward.
Volume decreases to under 1,500,000 on the 26th and 28th, but in view of the market's recent bearish action this looks more like a swing to a dead center preceding new weakness, than diminishing force of supply. (NONE OF THE "NO SUPPLY" JARGON HERE)
Furthermore, the low closing of the 28th leaves the average hanging on the edge of the 95 supporting line. If it cannot rally promptly from here, there will be more decline ahead. Accordingly, should prices break through the low point of September 21st at 94 on increasing volume, we shall again sell more stocks short.
We realize that after a big decline we may be taking chances in trying to get what may prove the end of a bear market, but we do not know when the real turn will come so we keep on playing the short side until the market itself tells us we are wrong or that the trend is changing.
New lows are the rule until October 5th when the average touches 79, closing within a point of the low and the volume is more than 3,000,000 shares. On the evidence of this alone we find nothing that causes us to cover on this day"

-
Excellent Post Walter, spot on.
Without a consistently profitable strategy all the mental discipline in the world is not going to help. Think this has been debated in Mentality v/s Edge thread a number of times.
-
Well Blowfish, you are in luck .
Incase you did not receive the latest email, with archived video of yesterday
Another master seminar to be held in March in Chicago, first day 18 setups will be revealed, and 2nd day, wait for it........
folks will be separated in groups of 10, then given a computer with a demo account of $20k to trade and those who win the most paper trading will be win special prizes. Isn't that absolutely wonderful:cool:
You will then be unleashed on the unsuspecting trading world, armed with the super duper knowledge of how the professional/dumb money works and rack in the dosh;)
So Hurry, do not miss this once in a lifetime opportunity. if you missed the previous one of Las Vegas.
-
GH who obviously has an agenda (selling copies of tradeguider into the retail FX market).
Well you obviously know your friend the professional trader and expert well,

We just received email of archived forex seminar, if anybody has any doubts about the agenda watch it.
Drum beating and trumpetting of how the VSA signals in the software are the best in the world, but this are not buy and sell signals.
Then the ideal signal is pointed out, however where it does not "work" , then "it is a computer, the human brain is better than that", ie. sometimes it works and other times the signals are meaningless as the context is missing.
As regards anything "working", same can be said for any RSI, CCI divergence on any market. As for VSA working on all markets, some of it obviously does as it is based on the Law of Supply and Demand as explained in the Wyckoff course, the original source in which all this jargon is absent.
However you have to give credit to your friend as he certainly has managed to pull in worldwide audience all starry eyed, salivating at getting hands on this super duper software, well they will soon find out the reality when they put it to test in the real market.
For those who have made it "work", well Good Luck.

Afterall GH became an expert in Price/Volume reading within a few years whilst marketing all this stuff, amazing achievement;)
-
The root cause is fear of loss, very understandable, for it has been ingrained in us from childhood, it is associated with being wrong, failure etc.
You have confidence in your edge but this subconscious fear of loss is much stronger, no need to get depressed over it, we all started that way, personally I hate to lose. I am sure everybody does and it is the desire not to lose that gets in the way letting the entry order get filled (presume that is what you are talking about).
However if you have determined a logical stop, then your risk is limited to that sum.
The only way to overcoming is this repetition - way of desensitizing oneself to the stress
ie. let the trade get filled even if there are consecutive losses.
Very similar to how we have all become desensitized to scary movies, initially Dracula, Omen, Exorcist use to give us nightmares;)
-
Why don't you look into the Wyckoff forum
-
This is very much pertinent to the discussion. Am told by my trading friend it is again extracted from one of Db's file, hope Db has no objection, where he goes into details of Demand and Supply(deals with stocks but applies to any market) but without use of any charts and the reason..... Well read on.
REAL WISDOM OF TRADING
I'm sure it has occurred to at least some readers that if the accumulation-distribution pattern I've described here were dependable in all circumstances under all conditions, then all stocks would have a pattern of up, across, down, across, up, across, ad infinitum. This is clearly not the case. The markets are not represented by a straight and narrow highway. A far better metaphor would be a roiling sea of rallies, reactions, markups, markdowns, shakeouts, thrusts, buying and selling climaxes, turning points, all happening all at once in timeframes varying from minutes to years and with all the accompanying eddies, currents, inversions, and undertows. This is the primary reason why I haven't provided graphic examples here of the concepts I've presented. The point is not to find some stock somewhere that typifies accumulation or a shakeout and use it as a template for all future investigations of manifestations of changes in demand and supply, but to understand at a deeper level how the threads of demand and supply, accumulation and distribution, and the relationship between price and volume all intertwine. What I've provided here is only the beginning of an exploration, not an exhaustive treatment of the subject.
Each chart you look at, instead of being "typical", will instead be unique. Each movement of price and volume in a chart has meaning only within the context of what has gone before in that particular chart. Therefore, solving the puzzle of the dynamics of demand and supply will be a new challenge with each chart. Achieving mastery of this skill will take time, if mastery is ever achieved at all. But applying even the most basic of the principles outlined above will result in an almost immediate payback, if not in money gained, then in money saved.
-
Although the original setups were meant for trading with the trend, no reason why one cannot scalp in the countertrend mode as you suggest with the 20ema as the target.
Also blending candle helps as a 2bar or 3bar reversal on a lower time frame exhibits itself as a hammer(for uptrend trading) or upthrust(for downtrend trading) on higher timeframe charts.
-
And if you know your system is profitable over whatever term, then who cares? .Is this not the same as first having " a Proven consistently profitable strategy" and then developing the mindsite to implement that strategy.
-
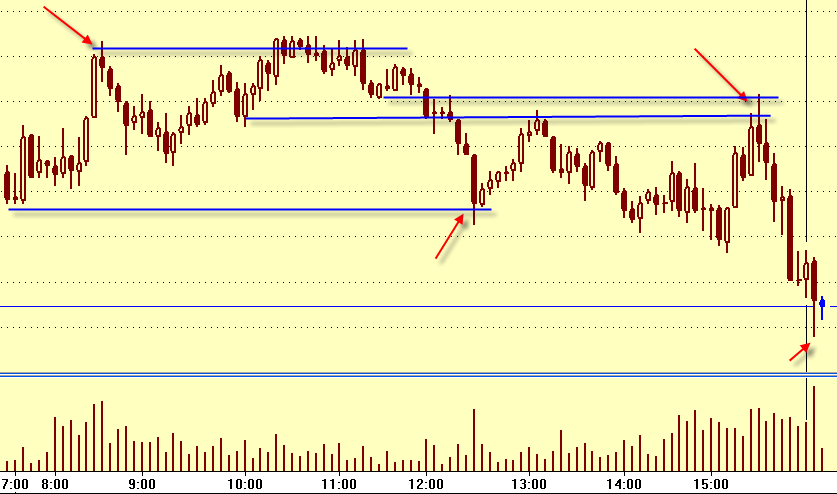
And this is the latest just to show that even after a successful test on low vol (2nd red arrow) the trade does not always work out, however the market goes down for further test of the support(3rd arrow) on even higher vol, but turn up on increased vol. Buying pressure greater than selling pressure. But after having been stopped out on the first trade hopefully at breakeven, have to be available as Mark Douglas states in Trading in the Zone for the next opportunity.


-
Thank you for this explanation, find this confusing, Dbphoenix says to wait for confirmation then the trade is gone, but then from what you explain, that is what has to be done.Perhaps Dbphoenix or yourself would take trouble to show it up on charts, once again I apologise as am not advanced enough to see it in my mind. without looking at charts.
Here are a couple of charts to illustrate the point ie. to pay more attention to price vol at relevant support and resistance, them employ trendlines to stay in the trend.
The first is a 5min Dax, the second is a close of the past few hours on 1min, you can zoom into 10sec or 5sec if you wish to , to note any volume divergence i.e tests. Have shown a test on low vol on 1min after the buying climatic action against resistance.
For further details on how to employ trendlines etc both for entry and exit/scaleouts (to keep to the subject matter of this thread) study the posts on the links provided earlier and in Db blog plus e-book.
Hope this helps

-
It is pretty clear to me that GH has no interest in VSA, trading or traders beyond how it/they can generate revenue for tradeguider. Tasuki wake up and smell the TG BS hehe:)Well you don't find Sebastian or Tom Williams complaining about it, why do you think T.W incorporated all this stuff in a computer program and marketed as VSA software in U.K back in 2000;)
as to tawe comments: if you examine closely there are some logical inconsistencies in VSA/TG claims about reading the footprints of Professional Money and then the onus on the marketing. If they really possess this ability, then all they have to do is piggyback the bigboys, where is the question of mental preparation, emotions , stress etc encountered by normal traders who are employing various types of other methodologies and indicators. Moreover TG have so many potent signals in their software which should tell them what to do without any sweat e.g END OF RISING MARKET:cool:
-
These are good questions and I'd also be interested in experienced Wycoffians views. You could also add how do you distinguish a preliminary climax from a 'real' trend stopping one? I guess this is where you have to deliver a "sensitivity for climatic action"?Think all this is elaborated upon in the threads mentioned in the previous post. W was very much interested in what price and volume did against trendlines, relevant support/resistance etc and Db has posted numerous charts to illustrate this including trendchannels. Vol considerations are largely irrelevant between significant support and resistance, focussing on where it matters will free the trader from engaging in bar by bar analysis as advocated by your friend,and professional trader and ...... expert;)
-
1. I am in the learning process so you will have to excuse me. You say that the climatic action has to be tested but I have seen a number of times price spike on high vol and then test that level on low vol, but the trend does not just reverse2. would you care to expand on what is meant by developing a sensitivity for climatic action
3. lack of sellers and lack of buyers I thought were price moves to test selling climax and buying climax respectively, are you saying that a trader should enter immediately on this and not wait for any confirmation, afterall if it is a valid test, surely the ideal point of entry may have gone, but there should be enough momentum for further move, so how can the trade be over.
please excuse if I show lack of knowledge on Wyckoff but what I have read is very logical and would like to learn more from experienced Wyckoff operators.
Glad to know you are prepared to learn, Zeon had similar issues sometimeback and we addressed that: have a look at some of the threads in the Wyckoff forum including:
http://www.traderslaboratory.com/forums/131/riding-the-wyckoff-wave-3739-33.html
I don't want to attach all the charts but here is the content of my post there: Once again understand your frustration which actually stems from the fact that the market is not behaving as per your expectation based upon a pattern or an indicator be it VSA or a price based derivative. or S/R or
Trendline.
1. If you reflect on this with an open mind, the message is loud and clear, the price is going to do what it is going to do. It cannot be dictated just because something on our chart(RSI, CCI divergence, head and shoulder, VSA no demand and upthrust, moving average crossover, doji, engulfing bar etc) tells us that the market should go up or down.
2. For any indicator or pattern , there will always be two identical examples , one which panned out and other did not. This has to do with the inherent uncertainty and probability of outcome in the market. It is logical to ask why did demand or supply emerge at a particular location but illogical to expect it to emerge there just because the indicator or the pattern on my chart says so. It is like shouting out: what right the buyers or sellers had to come out at this price and time. and take the prices in the wrong direction
3. If you study Wyckoff's analysis (believe the pdf file is on this thread) of a year's price action, you will consistently note how he is detached from the outcome, the entry is taken based upon his reading of price/vol, then he looks for ongoing signals which will confirm, or contradict his trade or force him to modify as the trade is managed.
4. It is going to take a while to reach this stage of detachment where one approaches the market without fear or anxiety and allow the market to dictate your action. Hence the need for the exercise with 15min charts etc which I suggested. It is not a question of singing anybody's tune, I have gone through the same stages and finally it dawned that the answer is not out there but in the charts themselves. It will put you in the driving seat, in control, not of the market but how you manoeuvre, if there is a diversion, you follow that path without resisting, think Db posted an excellent analogy of being a passenger on a bus somewhere, worth looking it up.
5. You mentioned the 2 identical chart patterns, actually you are looking at different time frames, 5min and 1min, and that is why I directed you to look at both the setups on 5min, so the answer was there. We are all looking at the same price action, as you say what is in front, but interpretation is based entirely on what we have been taught/observed and what we believe and expect. Surely you can appreciate that.
Anyway I will make another attempt via the attached:
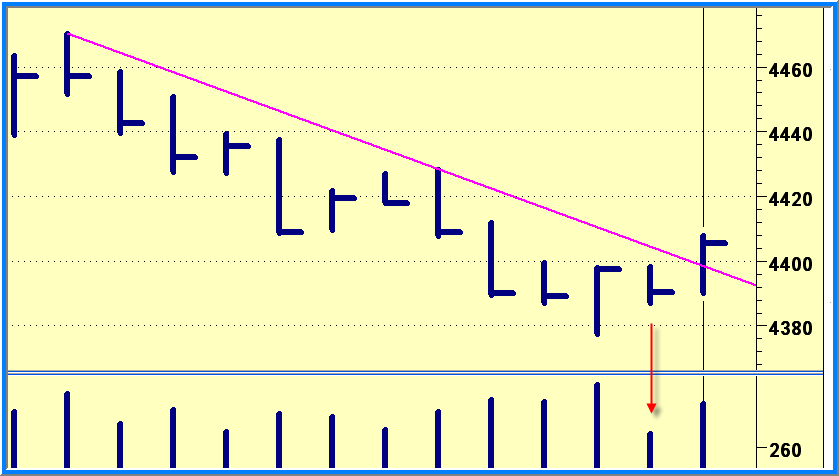
1. NQ 5min (a) 2 arrows showing climatic vol, this has been the ongoing problem for the past 6years with VSA tutoring, and has been ingrained in many mindsets, wait for a no demand, upthrust, short and vice versa.
In the chart the first trendline (black) is broken following just such a no demand and yes you could have shorted but then prices find support at 1970 , here the bars are narrow with low vol, then the market reacts up once again with low vol, NQ 5min (b), if there was supply, how could the prices go up on low vol, the demand must be of good quality, hence this was absorption . Hence you have to modify your stance and go with the flow of the market.
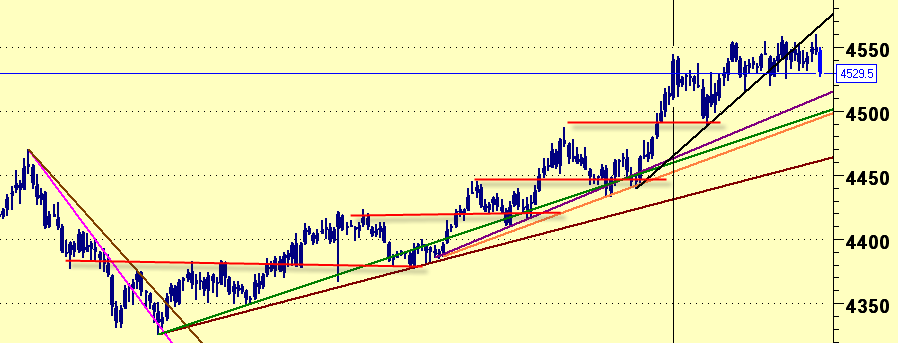
2. Once the prices rise above the swing high, the second trendline (blue) can be inserted. and price action read in a similar manner. (NQ 5min © (d)),
prices rise after retracement on low vol, why? there is no supply in this instance, but yes there will be cases when it encounters resistance and prices will plummet, and VSA team will point out that as no demand , their
ideal setup.
3. Now we move on the next day 7th May, the short around 2000 which has led to all this controversy. NQ 5min (e), again the black trendline is from previous day, you can take the previous days low and draw a new trendline (blue) after the prices break the previous day's high.
And again a new trendline on the day (brown). Now compare the price action and the bar ranges once this trendline is broken to that observed around 1990, zoom into 2min or 1min and study, am sure you will find it a revealing and rewarding exercise.
You will also find further info. on Db blog and http://www.traderslaboratory.com/forums/f131/the-nature-of-support-and-resistance-3878.html plus it will worthwhile obtained Db's e-book on the subject, it is not expensive and highly informative and educational, guarantee you will be well pleased with the content.
Hope this helps.
-
Hakuna,
Noticed you have gone through some of the stuff on VSA as well, have to be wary of some of the concepts taught there especially ones dealing with price spikes on high vol, end of rising market, professional money etc. otherwise you will find yourself countertrending.
As for you questions which are directed to Db, Head2k has some interesting observations, however I am sure Db is well placed to address that in detail.
-
Looks like you are learning fast Head2K:
Is this charting on amibroker package, if so what is the datafeed.
-
-
Plus VSA was born out of Wyckoff so it's methodology is sound.To Bearbull, I don't think these guys actually think they have the holy grail. I
Lets not mistake VSA for tradeguider.
It is human nature to seek evidence that will reinforce their beliefs regardless of evolving evidence and this is what we bring to our trading (Mark Douglas).
Firstly you acknowledge and many others here do as well that VSA is derived from Wyckoff, then why not encourage newcomers first to embark on a systematic study of the source instead of throwing themselves into jargon at the initial stage.
I can state this because we have sound knowledge of both.
Secondly Tradeguider was originally VSA based on Tom Williams' work in U.K, then it was glossed over with a new title, that is all, the software, signals therein, the ongoing teaching, seminar, DVD, are all based on T.W book on Volume Spread Analysis. All the terms in the Tradeguider software are exactly the same as those in the book.
e.g End of Rising Market, this has been claimed as the most potent signal in the software, does that mean it is not in VSA.
On YouTube there is the video how this signal predicted the fall of oil prices from $140 when everybody else was predicting higher prices.
Now if you listen to any of the seminars, the first thing they point out that these are not signals and then when it pans out it is hailed as the most potent signal, just this one signal is enough to cough up $2995 for the software;)
We have seen the software in action and this same signal has a similar strike rate to that of any CCI or RSI divergence method.
Like you I am neither for or against and have no desire to engage in controversy with others on this thread, if you have somehow benefited from it, fine, but to ask a newcomer to struggle through it until he or she finds something that works is not really very encouraging. Afterall whatever you have figured out into your strategy/tactics is not available to the newcomer.
Let him go to the source and then will be a better position to examine VSA concepts.
Trading The Wyckoff Way
in The Wyckoff Forum
Posted
It really is pointless arguing over professional/dumb money, Wyckoff already mentioned "The composite trader", market itself.
All the information regarding buying and selling pressure can be gleaned from the charts via price/volume relationships, as to who is doing what to whom and why is pure guesswork and largely irrelevant.
It is due to this constant obsession over professional/dumb money that I know some traders personally who find themselves countertrend trading most of the time and then sit there banging their heads yelling "but I was informed that 90% of that volume is professional money" etc.
In short, understand what the market is telling you what it wants to do , never mind who is doing it and why.