
Welcome to the new Traders Laboratory! Please bear with us as we finish the migration over the next few days. If you find any issues, want to leave feedback, get in touch with us, or offer suggestions please post to the Support forum here.


CandleWhisperer
-
Content Count
184 -
Joined
-
Last visited
Posts posted by CandleWhisperer
-
-
.....In case anyone doesn't realize this, CW has paid for...
Soultrader or any other moderator. Please note that I have never mentioned the name of the site, the link, or implied if I was sent a pm I would give it. Mark has never done it either. That is not the way he does business. Out of respect to him, I ask that you delete the link to his site.
Also since we cannot ignore a moderator, at least they should be required to act like one.
-
Actually CW, this post from you explains everything. Since your methods are changing weekly or daily and you need to pay someone to show you how to trade, that's all I need to know.It's PAINFULLY OBVIOUS that you are brand new to this. It's ok, you have a lot of learning ahead of you, including how to 'read price action'.
A few here understand when I write that the name of the candle means nothing. To you, this is a deal breaker as evidenced by your reply to me suggesting I open a poll to decide what that candle was called. A very amateur call. An experienced trader will look and say - wow, bullish on high volume, consider going long. That's it. Doesn't matter if you call it a doji, hammer, spinner, lasagna, crocodile hunter, blue moon special, terminator, cannon ball alley or my personal favorite - a reason to go long.

Funny for one with so much experience you seem to show up on every thread. Why doesn't mr. candle man stay in candle corner, if they're so great? And you're so smart?
-
Note to self: use the words for example else your words will be taken literally. the 10 pts loss is AN EXAMPLE. Do you not understand subtext?
-
What strikes me in a lot of these posts, is that pin-pointing the entry always seems fairly easy, but determining the target is hardly ever discussed. Perhaps you could tell us also a bit about where or when you would exit your long trade? Or what signals you'd be looking for to exit that trade? Thanks in advance.Very good question. Thanks for it. I am afraid you will find my answer wanting however.
If you had asked my this as little as two weeks ago, I would of said I don't believe in price targets. I like to trail my stop and let the market take me out of a trade.
That is what I would of said then , today it is a bit different. Since I am a client of a particular site, I do not want to say anything about targets. I will give a hint: it is in a least 2 threads in this forum.
Even with that, I still like to simply trail my stop. I move my stop up based on the appearance of WRBs. This method is detailed by Mark in the WRB thread I believe.
By the way, Tom Williams says markets will trend further than one expects them too. So all the more reason to not expect and simply allow the market to do what it wants to do.
-
I honestly do not care what it's called - hammer, doji, spinning top (actually would probably be a spinning top more than a doji ) Point is, great trade there.And it was easy - high volume bullish candle signal. I see all this stuff in this thread making trading so much more difficult than it needs to be IMO. There's one post asking if this was a trade and then another that says it was textbook... Well, if it was 'textbook' shouldn't it be obvious? I mean, there are some patterns that require discretion regardless of the trading method, but to call something 'textbook' would indicate to me it should be incredibly obvious.
Not sure what was so unreliable about a spinner that produced +8 for me... I don't know, for me, that's reliable enough. It moved approx. 13.5 pts from the close, so if that's not reliable enough, then yes, candles are not good for someone that must get more. It works for me as +8 is a nice trade.
My point was simple - to take something that took at least 3-4 pages of this thread to dissect that literally took about 1 minute analysis in the candlestick world. Result was the same - a long that worked well - but it did not require question after question to get there.
I guess I'm that voice that won't go away in this thread b/c I see so much effort being exerted here for the EXACT same thing that us candle traders are doing, yet it's as plain as day. In other words, I have yet to see ANY advantage that VSA provides that your standard candlestick analysis does not... Oh boy... here comes the hate mail now...

First, I would put Mark's white hammer pattern (Found on elitetrader) up against any of yours or Steve Nison's. The text book/internet patterns are not reliable.
Second, unreliable does not mean on trade can't make 8 pts. It means for every 8pt trade there are 10 2pt losses. Not very reliable in my book.
You still have not shown any understanding of the Price Action. Why?
As far as "text book" VSA, we are not all on the same level. Surely a newer trader will miss an idealized set up. Even a seasoned trader misses things every now and then. If you want to go this route, you can't say with certainty that was a hammer or a doji or a spinning top. And I bet if you put a poll on the candle thread you would get many different responses. By you definition, very little is text book where candles are concerned...........
-
I didn't realize that a long shadow like this sets up a zone for entry. Thanks for that insight. I assume that this is for climactic bars/candles like this?Forget about the term Long Shadow for a moment as Tom does not use candles.
What is important is when a wide spread bar on ultra high volume forms the entire range is key. More exactly the area from the low to the close (in this case). Many would look at a bar like that and say that price was rejected from the low to the close.
VSA would say that BB buyers stepped in and swamped sellers (demand swamped supply) therefore, that range is of some import (to them). Now if price trades back down into that area and we find low volume than we know that the supply is gone.
One might expect to see some who got short on the ultra high volume bar to try and get out at break even. This should mean larger volume not smaller volume. Again the small volume reiterative that there aren't really any sellers in this level.
Simply put: Look for low volume (tests, no supply, no demand) within the range of a high to ultra high volume bar.
Is there some logic about Bar 2 © being in the shadow zone, or is this more a convention in candle trading?See above. But yes, candles draw attention to the most impront part of that range: the long shadow.
-
Just wanted to say thank you to all the contributors to this thread. All the posts add insight and valuable learning. Keep it up ladies and gents.
-
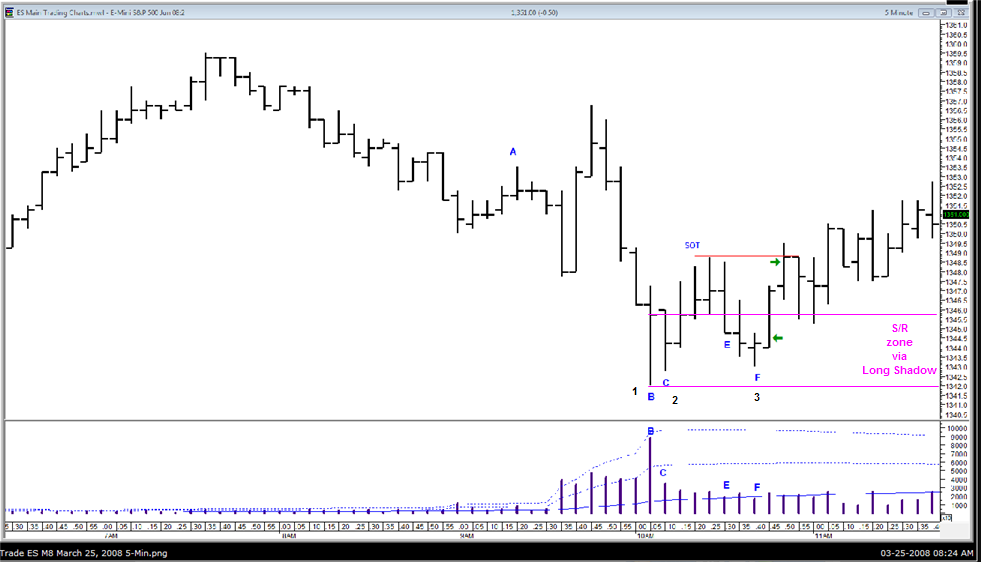
Since the S&Ps are sloppy today, here's a question on trade entry I made from this morning.On the ES 15-min chart, there was stopping volume at B and a test of the high volume at E. It looked like the big money was using the Consumer Confidence news at 10:00 AM to accumulate. This area was the rally high from two days ago (1443.75), and a logical place for support (and, an example of climactic action at higher time frame support).
This also showed pretty nicely on the 5-min chart. About 88,000 contracts traded on the 5-min at B, which is ultra high volume on this time frame. Look at the close. This has to be strength coming into the market. Next bar, C was a down bar on volume less than the previous two bars, indicating a lack of supply where only 5 minutes ago, it was ultra high.
This caused a rally, and then another reaction. Bar E is a down bar back into the the high volume area, and is another Test. Next bar is also down, and does not draw out supply. Bar F is a reversal bar. F goes well into the high volume area and draws no supply. The close was equal to the previous bar, and only 1/2 point lower than E. I like that look of clustered closes, and I went long at the close with a fill at 1344.50. I took it off just below resistance at 1348.50. You can see the entry and exit arrows.
My question: Does this correspond to good VSA trading? Was Bar F sufficent confirmation to make a trade? I know the trade was successful, but was it successful from a VSA standpoint?
Eiger
Here's what I see.
1: We get an ultra high volume bar that closes down but close in the upper portion of its range. This creates a Long Lower shadow. The close in the upper portion of the range on high volume tells us that demand entered. If there had been selling on this bar, the close should not be in the upper portion of the bar. So we have a down bar that closes in its upper portion on ultra high volume: Strength (demand enters). Now we also have a S/R zone via a Long Shadow. this is our entry zone.
2: Next bar is down with volume less than the previous two bars. This is no supply. Personally, I would not enter here as the entire bar is not within the range of the Long Shadow. However, we now have more evidence that the supply/demand dynamic has changed.
3: Now we get the key bar. This is a test. Note that the volume is very low. Especially when compared to the first bar (1). Also note that we in the range of that long shadow where we first saw all the volume. This time there is none. The BBs have tested, or checked, for more sellers and have not found any. If there is no supply, the market is free to rise.
Long at F is very nice. You may not be the first in the door, but the money is made in the middle. Not for nothing but there is also not heat at F. An entry at B (1) could be cause a loss on the next candle.
-
Eiger (and others if interested) - you know what could make life a little easier? Convert your chart to a candle chart and just like that you have a very high volume hammer. Doesn't get any prettier (or easier) than that. Instead of wondering if A vs B and compared to D along with the VSA principles that may or may not apply here, candlestick analysis says - BUY.Good trading!
Note - I took this very hammer for +8. Who knows, maybe got out TOO SOON! :rofl:
BF, you consider that a hammer? To me the upper shadow is longer than the body of the candle and thus it is not a hammer. More like a doji.
Obviously you have a handle on what you are doing, but most traders who take a signal like this end up saying candles don't work. That is because that is an unreliable signal. Out of curiosity, can you describe the price action prior to the doji? Of much import is what caused that WRB-a news release of some sort.
-
Nice to see you back PP Your contributions were missed.
From my third post on this thread:
"JJ:
I managed to save a few screen shots from PP from other sites and this one. I have been studying his posts diligently. I have gone so far as to set up my charts exactly like his/hers. Are you saying he or she was not a real trader? I would hate to be trying to emulate a keyboard jockey."
But thanks for the comparison. I spend a lot of time reading his or her posts.
-
CW, nice analysis since price goes eventually in the right direction, but for the same setup I could find numerous posts where price eventually continues on the way down. ...I can put up some charts if you like.Please do. I hope to show the same with my next post.
...You're stating 'demand must have entered'. But if I'd count the times I'd seen an up-bar on low volume after a WRB down bar on high volume... This happens all the time, perhaps scalpers are trying to pick some points going against the trend there. And if you want to call it demand, for sure. It doesn't mean that price will reverse because there is demand. Usually this 'demand' leads to a temporary change in the buying and selling flow. But I can't imagine anyone wanting to go long there, unless he's talking a gamble. Sorry, just my 2cIf you mean going long on the very next bar/candle after the large WRB then you are correct. Note that I did not call that a possible entry point. No trying to pick the absolute bottom here.
.... It doesn't mean that price will reverse because there is demand. Usually this 'demand' leads to a temporary change in the buying and selling flow.That's what a WRB is: a possible change in the supply/demand flow. It creates an area or zone where the dynamics of buying and selling change. Of course, not all WRBs are created equal. Here we had a high volume WRB and it happened to be the largest of the last 5 dark WRBs. In that way it was a volatility spike.
Again, look at the total picture. Price acts differently after the WRB and more importantly within the Range of the Body of the WRB. Looking to get long or short within this range is thus beneficial. Weather one gets long or short has to do with what the BBs did on that WRB.
-
Okay, it's time we have a VSA chart. I don't care if this is after the fact or not.
There are 2 charts below. The first chart has some interesting things that set up what comes on the second chart. This was not a trade made but an interesting learning opportunity none the less.
A: Large dark WRB on high volume. Down bars on high volume usually mean selling. But look at the next bar, it is up. if all the volume was selling this next bar could not be up. Demand therefore must of entered. Note that the next bar is not labeled. Check out the volume. Less than the previous two bars. With an equal close and not making a higher high, this does not represent a good place to go long. And if one was looking to go short, this is not good example of no demand. Again because the close is equal and the high is equal. Most importantly, because we have just seen strength in the form of the WRB.
B: Now we see a wide spread candle that closes down from the previous bar, but closes above the middle of its range on high volume. Note how price moved down and hit the Support/Resistance line formed by the WRB and then moved up. There is price rejection in this Long Shadow. So we ask what has price done on the volume? Well it closed down but in the upper portions of its range. More demand must of entered on the bar. Simply, this bar is strength.
C: First entry signal. Close on the high on a bar with volume less than the previous two bars and a narrow range into previously high volume territory. This is a test. We are within the range of the large WRB and testing in a logical place. Right after the influx of demand as shown by the long shadow/close in the upper range.
D: Another dark WRB on high volume. Yet the volume is not as high as the first one. Again, the very next bar is up. Demand must of entered on the WRB for the next bar to be up.
E: No supply. Check out the range of this bar and the volume. The BBs definitely were not involved in this bar. This is a down bar, and VSA teaches that strength comes in on down bars. As a bonus, we have moved back into the S/R zone. Note that we are above the midpoint of the body of the WRB. Support within support.
F: Either of these two bars have volume less than the previous two bars and are no supply. See how they are being supported a the low of the white WRB.
3 or 4 possible places to take advantage of a change in supply/demand. See chart 2 for what happened next.


-
First, as one who really wanted this thread to get back to VSA, that did not mean get rid of DB. His take on Wyckoff should be welcomed here. Tom studied Wyckoff, Tom Studied Ney, We study Tom. By the transitive property we study Wyckoff.
Now one more thing about 1 minute charts. Tom, Gavin, Todd, and maybe even Sebastian say don't trade off the 1 minute because there is too much noise. However, Tom ultimately says a trader should trade his own personality. If one's personality is suited for the 1 minute, then trade it.
Again, what many fail to understand is that price is continuous. It flows. We, as humans, are temporal so we think in terms of time. That is why the close is so important to us. It is a momentary picture of where prices is on a continuum that is agreed upon by all. Of course the same is true for the high, low, and open. Price itself, however, is fluid. It ebbs and flows unencumbered by arbitrary measures of time.
Time is important in VSA mainly because we need to compare volume. We need to make distinctions in the amount of volume/activity in the market. This can be done on a 15 minute chart OR a 30 second chart.
Lastly we need to remember that markets are fractal. A 30 minute chart looks like an 8 minute chart, looks like a 3 minute chart. Higher timeframes tend to lead and dominate the smaller ones. Hence when we want to look at trends it is a good idea to step back. The operative words being step back. DB is advocating stepping closer to price to see price. Most step back to see trend. But trend is a derivative of price flow.
Gavin trades the 3 minute e-mini. Are the traders on this thread trying to say that a 3 minute chart must have 3 xs less noise, or be 3xs inherently more tradable? In other words, what makes a 3 minute chart okay and a 1 minute not. What about the 2 minute? The answer, which brings us back to where this post started, is personality of the trader. And that has nothing to do with what is or is not VSA.
-
That I agree on. The problem is that it moves too fast to analyze rationally while the emotions are peaking watching it move. During slower movements, it´s great, but during fast moves like these, even experienced traders have to be wary. I think at least 30 minutes before moving in is reasonable, not when it explodes on the mark of the announcement.Yes. One should let the BBs do what it is they are going to do: dump supply or load up (demand). Trying to be in the market while they are doing this is very dangerous. This is especially true for those who trade spot forex with its requotes and widened spreads. But alas, that says more about the market traded in this environment, than about trading a market in this environment.
-
There are a multitude of factors to consider when choosing a timeframe to trade. I will just touch a few:
(1) Signal to noise ratio. Now Tom and many others will say do not trade a 1 min chart because there is so much noise. I believe there is an error in this thinking. EVERY MOVEMENT OF PRICE IS VAILD as it represents buyers and sellers coming together in agreement. Therefore, there really is no such thing as noise. This is what DB is talking about.
With that said, if one trades currencies with their high propensity to trend, 1 minute charts can lead to many false break out signals. And retracements that on a larger time frame would be easily sat through.
Keeping with the VSA theme for a moment, one has to asses the likelihood that the biggest and smarts traders in the world are trying to get 5-10 pips out of the currency market that tends to trend for 100s of pips. VSA tells us that the BBs trade all timeframes to both hide from the public and each other. But the GBP was not brought down by Soros on a 1 minute chart.
(2) Signal type. Mark is a Price Action trader who uses WRB analysis first and Japanese candlestick patterns second. For the patterns he uses many timeframes from which to trade. Because a pattern may not set up on one timeframe but may on a higher or lower one. For example, a Doji on one time frame is almost always a hammer on some other timeframe.
A valid signal pattern is thus not dependant on timeframe but on the candle lines that transverse into a valid signal pattern.
Some type of entry singals, however, are better suited when there is higher timeframe confirmation. Or simply be taking the singal on higher timeframes to begin with.
(3) Personality. Many people need instant gratification. They want to know if they are on the right side of the market or not immediately. Related to this is the important idea of risk. Technically a swing trader can know if he or she is right or wrong as immediately as a 1- min scalper, but to many the there is a time distortion resulting in increased risk as timeframe increases.
On the other hand, some use time to second guess themselves or at least not rush into positions. It is very nice for some to see a set up on a 15 minute chart and know they still have at least 15 (the whole next bar) to actually decide to pull the trigger.
Of course, there are many other factors. I think (1) is very important here. While the father of VSA is against the 1 minute timeframe, we should still realize that every price (tick) is valid and thus worth understanding. With that said, sometimes one does need to step back from within the trees to actually see he is in a forest.........
-
Thanks soul. Just one more thing. If you just wait until the initial balance is complete, don't you only have As and Bs? If so , do you have enough data points to get a sense of where the value area might be?
-
Price is indeed the Truth, have observed on countless occasions, especially in bull runs, prices crawling up all day long on low vol, previously used to look upon those tiny bars with low vol as no demand especially against some resistance to the left,, short it only to see price sailing past my stops on low vol, then it dawned that low vol is the reflection of paucity of sellers and rising price was that of buying pressure. As you keeping saying volume is not intent."...but rest assured this approach has its limitations too, because at times the market will go up on high volume, but can do exactly the same thing on low volume, Prices can go sideways, or even fall off, on exactly the same volume!
Price and volume are intimately linked and the interrelationship is a complex one." Master the Markets, Tom Williams, P 16
"To understand what the volume is saying to you, you have to ask yourself again, 'what has the price done on this volume'?" Master the Markets , Tom Williams, p 18.
-
Basic MP question. Forgive my ignorance here, but how long into the day does one have to wait to "see" enough of a developed profile to make trading decisions?
-
Price reigns........... "Volume" bars can actually be a distraction if one attaches too much importance to them. At best they are a measure of participation. What is more important is the behavior of price. If this presents what appears to be an insurmountable obstacle, take volume off your charts for a while. Forex traders, after all, have to do without it entirely.To say that on a VSA thread, though, is probably heresy . . .
Volume is nothing more than activity to be sure. This is why tick volume is a suitable substitute for actual volume. However, do not confuse the lack of available volume information with the IMPORTANCE of volume information. In fact, the lengths some go to keep volume from the individual trader only goes to show how important it is.
With that said, Price action is certainly important. Price/Volume/Volatility they all go together.
-
Candle-I would indeed like your $0.02. Please do tell us what you see on your chart-I think that anything you see will help people learn from the knowledge you have to offer!
Sledge
Well, since you asked
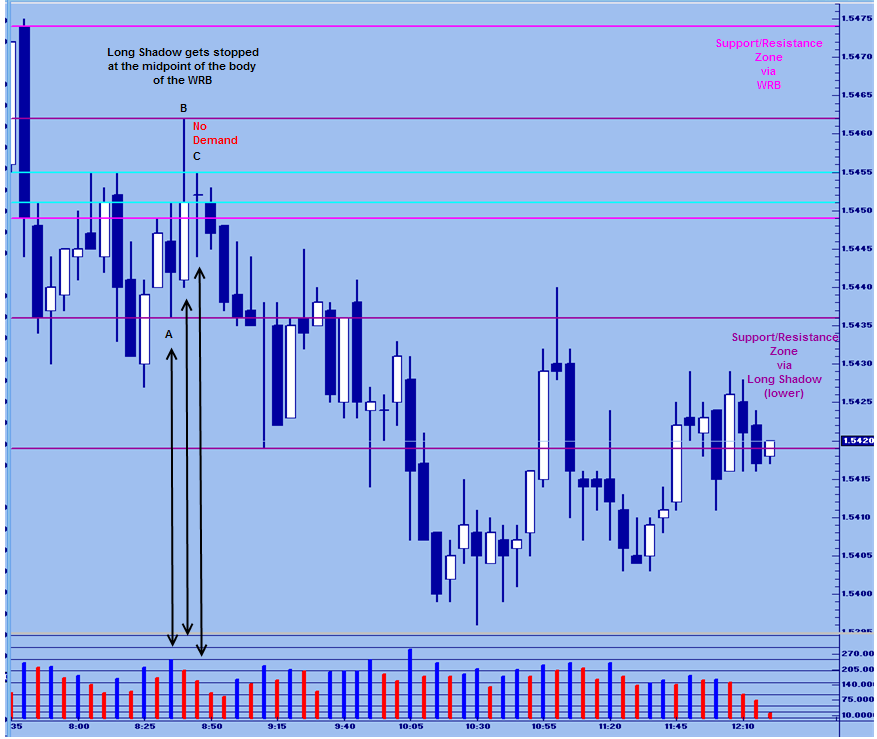
.We start off with the large WRB that creates a support/resistance zone. WRBs signal possible shifts in supply/demand. From a straight VSA point of view, a wide spread down bar on high volume usually means selling. Master the Markets, Tom Williams, P. 166. This is confirmed with the next bar being down.
Skip to point A: Notice that we have a down bar on very high volume that closes near the middle of its range. This signals strength. Demand entered on this bar. Now note that the high of this bar is at the upper cyan line. The cyan lines represent a particularly important type of support/resistance area. Although Mark has mentioned it in the WRB thread, I will not.
Next we have B: After some demand has entered the market we see a wide spread up bar that closes in the middle of its range. Two interesting things also happen. (1) the high of the candle, which forms a Long Shadow is at the midpoint of the dark WRB. (2) The close of this candle is not only in the middle of the range, but it at the low of this "special" support/resistance area.
However, leaving those aside, we can see that there must of been some selling to have the bar close on its mid range rather than on or near its highs. Especially with the demand that entered on the prior candle.
Lastly we have C: A doji. A narrow spread candle that closes up on volume less than the previous two bars. This is no demand. The BBs are not interested in higher prices at this time. Again, note that the top of this no demand is at the upper cyan line and the close is within this channel. Plus, the Close is with the zone of the Long Shadow created on the previous bar. The upper line of the Long Shadow is in purple and low line is not seen, because it is equal to the lower cyan line.
Get short on close of no demand bar. Place stop just above the high of Long Shadow. Start your chant, "'cmon price go lower". :o
-
...........Yours is apparently yet another way of viewing this concept. I'm sure a lot of traders will say "whatever works for you". But why would a WRB be any more significant than a not so wide body? Forgive me for saying, but when I see WRB and price is rapidly falling or rising, its my impression that there is a LACK of S/R in that area. Price seems to move from one area to another and these areas in between where price plunges or skyrockets don't provide any S/R for the reason that there's nothing but "air" in between.Simply, you are reading it wrong. The shift in the supply/demand dynamic creates the support/resistance zone that is evident GOING FORWARD. So yes the WRB may appear to be not meeting resistance, it is however creating a zone where the BBs are doing something. It is thus a place where they will be paying attention to in the future.
...........PS: Oh and sorry if all of this is off-topic, but I'm just replying to another post. Seems like a whole lot is off-topic so perhaps we need to (a) change the name of the topic or (b) start a new thread?Actually Tom Williams says the two most important things to understand are : (1) volume and (2) support and resistance.
Tom does spend some time in the book on this and trend lines in particular. It is true that Gavin has not spent much time on it. He has said he will make more of an effort to talk about this. If you are familiar with the software than you know about trend clusters which are support/resistance areas based on previous trend lines.
-
Would love to here some reviews of those that attended the webinar. Too bad nobody left a sign up link.
-
........In all seriousness, my question was sincere as I enjoy lurking this thread, but have yet to see any real trading being done besides after the fact type stuff. It's REAL easy to find those S/R levels after they've been confirmed. But what about when they are forming? Is the trader in real-time jumping in to see if they do hold or not?..............I'm just asking the questions that anyone would ask of a trading methodology.
I read somewhere that VSA is a big tent. I like that. It is clear that most of the traders on this thread do not do things exactly the same. And if you include DB (not a VSA trader per se, but a Wyckoff trader/supply/demand trader using PV) this becomes even more evident. That is, DB is doing incredible work far beyond most. It is elegant, simple and effective.
As far as drawing support and resistance in real time, there are many ways to do it. After reading the first thread and posts by Nihabashi, I prefer to look at WRBs and Long & Shadows now. There are many things I can't say about them and far more things that I do not know as yet. But what I can say is this. Those that use candles can easily see a WRB appear. The definition is simply A WRB is body (open to close) that is larger than the prior three intervals. A Long Shadow (upper) would be an upper shadow that is larger than the prior three long shadows (only). And the opposite would be true for a Long Shadow (lower).
Now, there are various was to determine what makes one WRB more significant than any other one. Two of the main things I look at is size and volume. Hence, in real time if there is a WRB that happens to have high to ultra high volume or is larger than the last three WRBs it is significant. The three prior WRBs is flexible, but once one decides on a criteria, one should stick with it. It may be different for the individual instruments traded. Subsequent price action will tell you that.
So one can easily determine what is a significant WRB, or Long Shadow. As far as trading it, it is always best to let the market prove it. Why go short simply because price is rising towards a supply/resistance area? Many "pivot" traders make this mistake. Just because price is moving towards R1, doesn't mean go short. Price can continue doing what it is doing: going up. However, one can become more attuned to price action as price approaches R1.
Take a look at the chart below. These areas were easily plotted after the appearance of the WRB or Long Shadow. As so many seem to not want after the fact learning experiences, I will say nothing about a trade set up. It is labeled and if asked I will give my $0.02
-
In the true sense of the word, a mentor would not charge. He/she would want to lend a hand to someone because someone first lent them one on the way to the top.
Here, we use the term mentor in lieu of the words teacher or coach. Jordan had a coach. Tiger Woods has a coach. Most of the elite persons in their fields have coaches. Why would trading be different? Note that Tiger's coach teaches the best golfers in the world, but IS NOT one himself. He is the best Golf Coach in the world.
The issue may be that the secret to trading is that there are no secrets. Put as a question, "are there truly any secrets to trading?" But a mentor/coach should be FAR more than "This is when you buy, or this is when you sell". A mentor teaches you how to set up a business. How to handle the pull back as CNBC reports GDP and all the anchors are gloom and doom. Or conversely, how to disregard perma bull BOB Pasoni (SP?) and focus on what the Tape is actually saying.
As far as price, I think the mentor need only charge enough to cover living expenses and externalities. The money made in the market would just go to grow the account.

[VSA] Volume Spread Analysis Part II
in Volume Spread Analysis
Posted
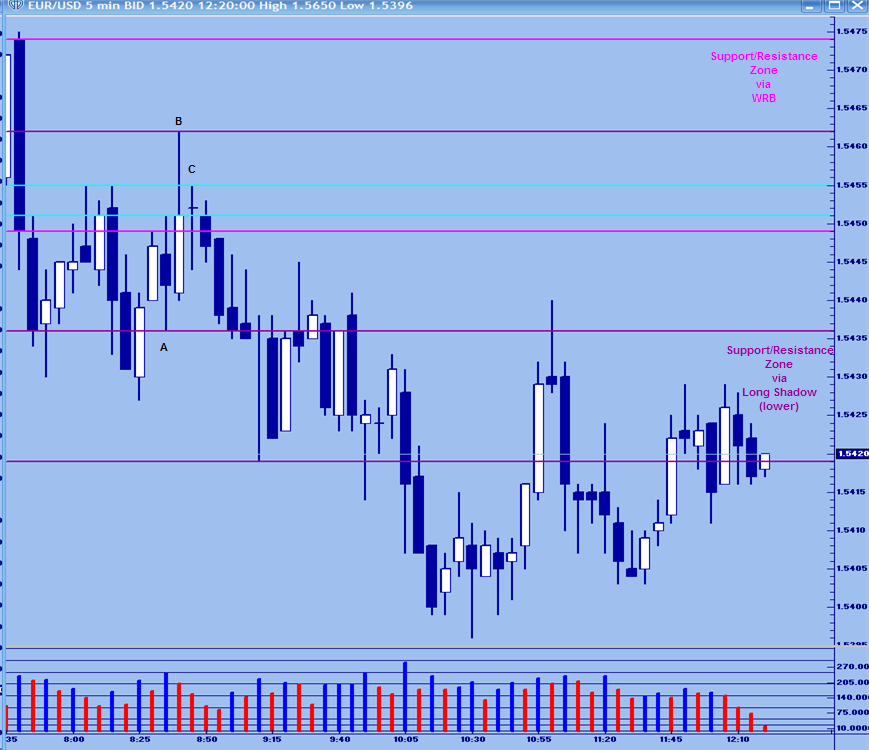
I may be talking out my backside here, but I think you are across the pond. If so then 1230 on your chart equates with 830 NY time. My analysis is based on this assumption.
a: This is the key candle. WRB formed when there was a news release about Jobless claims.
b: High volume up bar that closes in the middle of its range. The close in the middle of the range shows that supply has entered. If all the volume was buying (demand), then the close should not be in the middle.
c: this is a test. It is also a squat. Some demand comes in here.
d: The very next bar is weakness as we have an up bar on volume less than the previous two bars closing in the middle of its range. This is no demand.
e: Price moves up a bit however. Yet we get a wide spread bar that closes on its highs on volume less than the previous two bars. This is no buying pressure. Again weakness.
f: Up thrust. Closing on the lows of the bar on greater volume and making a higher high than the previous bar. Note the close is now equal to the level of the close on the test.
h: the chart says hidden selling, however there is nothing "hidden" about it. We have a widespread down bar on high volume. Most down bars on high volume are selling. If the next bar had been up then there would of been hidden buying.
edit: sorry neglected to say that the first sign of supply was on a.