
Welcome to the new Traders Laboratory! Please bear with us as we finish the migration over the next few days. If you find any issues, want to leave feedback, get in touch with us, or offer suggestions please post to the Support forum here.


stefcio2002
-
Content Count
20 -
Joined
-
Last visited
Posts posted by stefcio2002
-
-
+3000 pips in 15 minutes was crazy stuff on Friday. we're near a monthly support, major one. 1.040 and i think it may take an hold here.I got some support at 1,065 from the monthly. But I think we are going south.

-
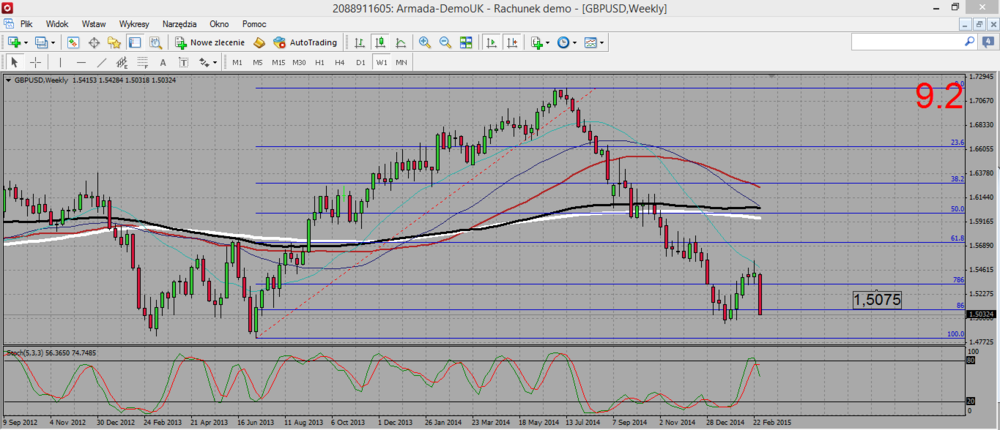
2015 03 08 Powerful bearish action. We broke a weekly fib support, I will use it as resistance. I am looking to sell rallies.
-
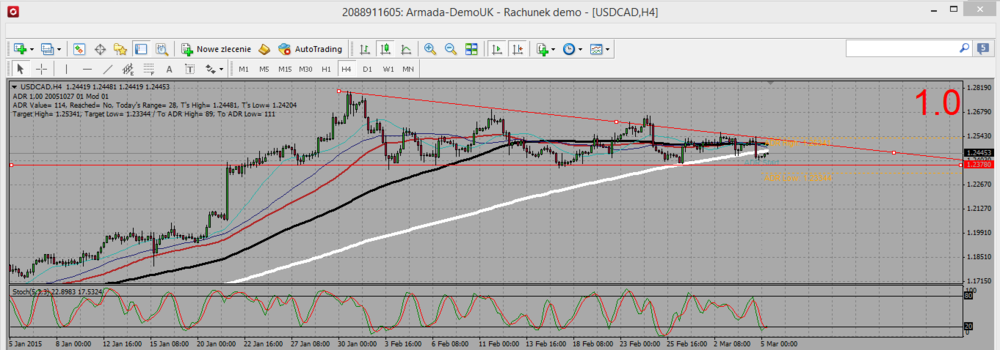
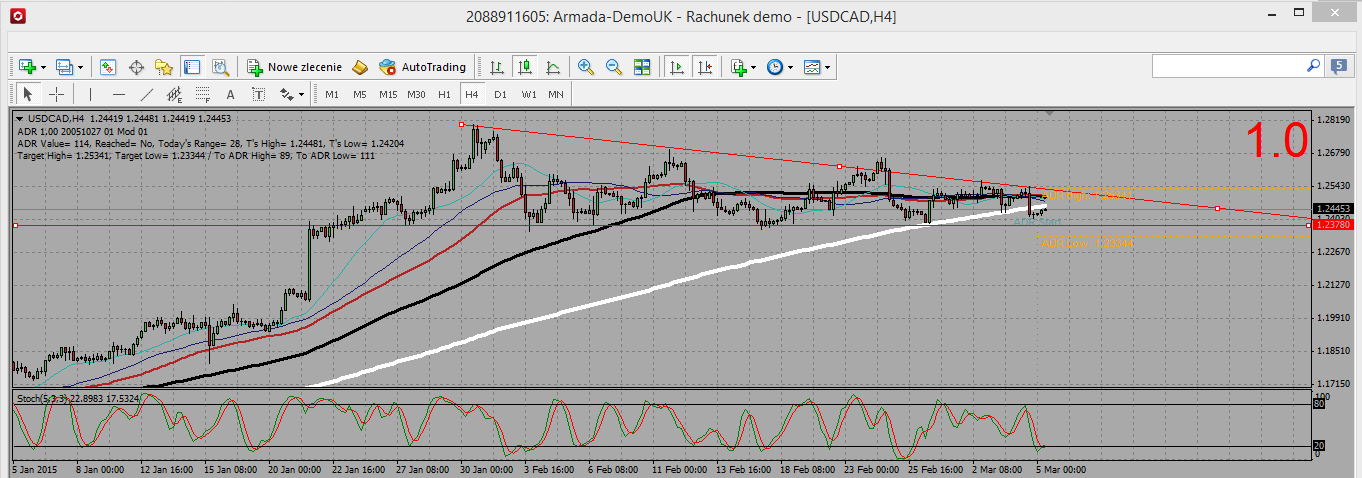
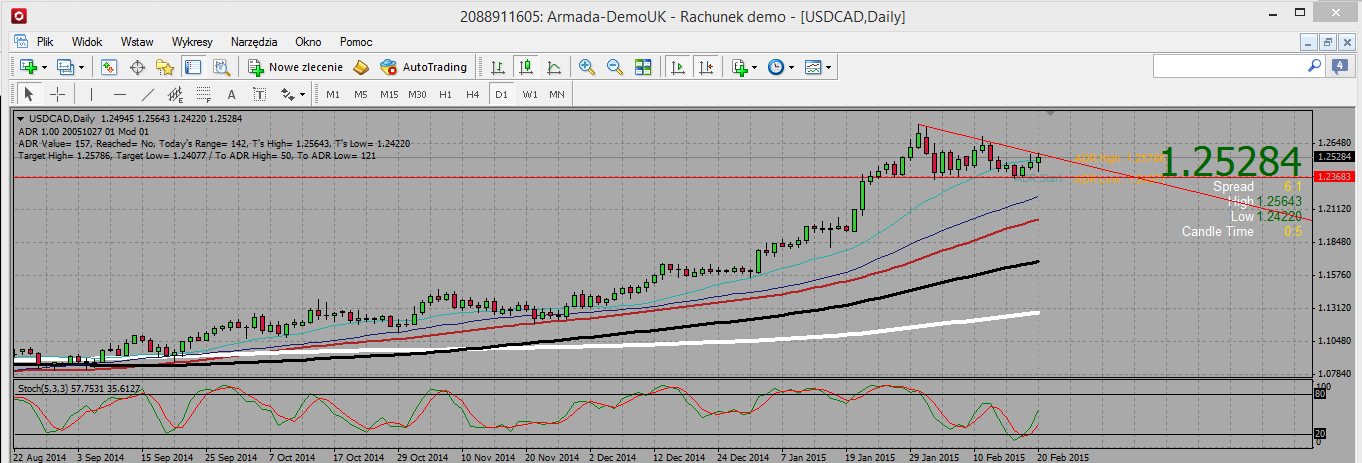
USDCAD is in a consolidation figure on H4. The fact it broke down H4 SMA200 on its second attempt within that consolidation figure just add to the confusion. I will wait until it exits that triangle.
-
It depends what do you need a broker for :
demo, live?
Are you a scaler,, a swing trader?
Do you want a ECN account, a classical one ?
Do yu wish it to be FCA regulated or not?
I am using a Tickmill ECN account on demo to check them before going live, and so far so good : spreads are ok, service is reliable, so I am happy with it. But that's just my point of view.
-
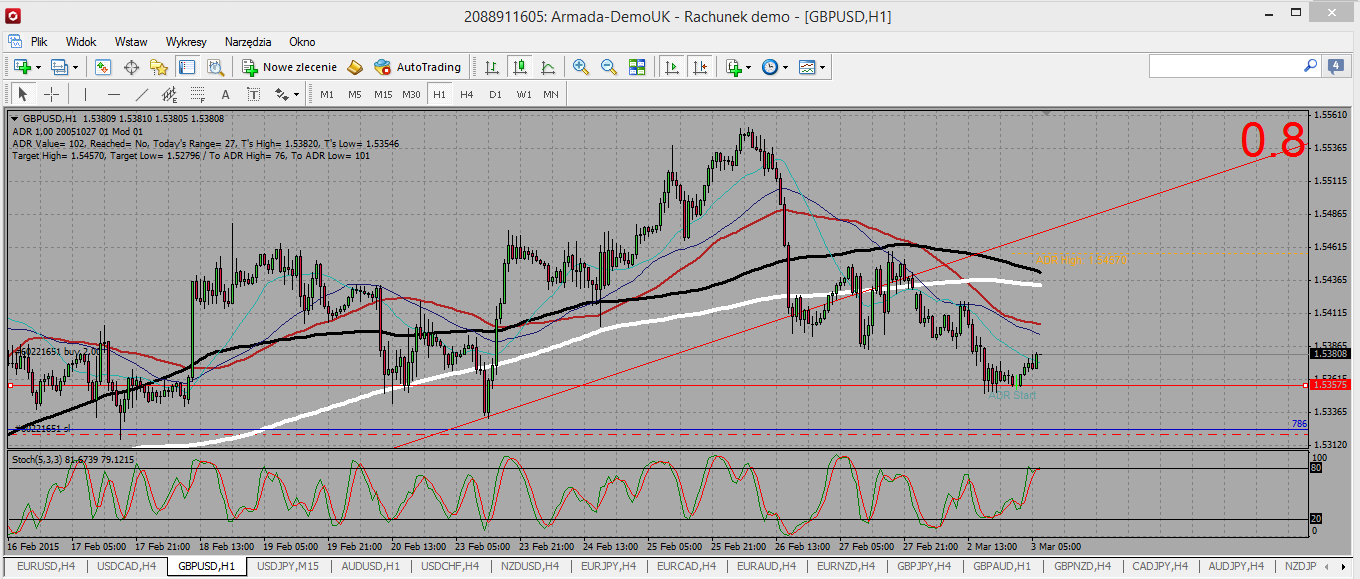
GU is close to the 1,5325 weekly fib level support, and gave a H1 long signal. Jumping into it (only demo on Asian session)

-
When one wants to swing trade, there are multiple ways to confirm or at least establish some confidence over your decision as to when to enter the market.Can anyone give an example of where they are seeing this play out?
-Thank you
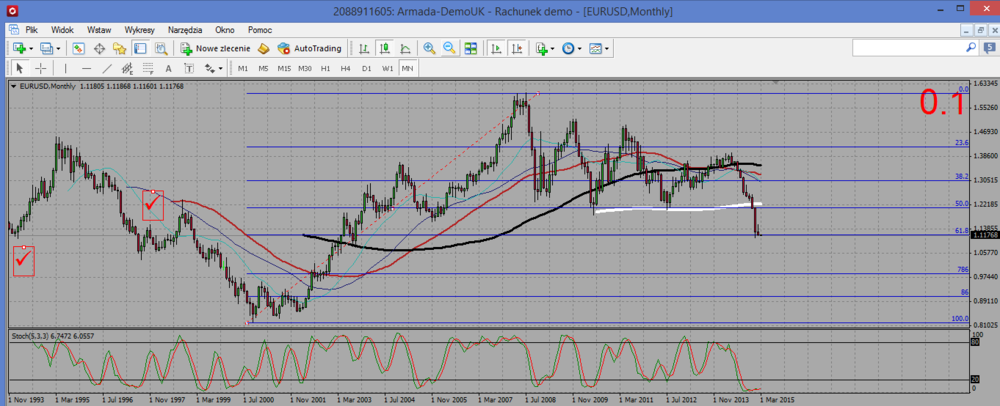
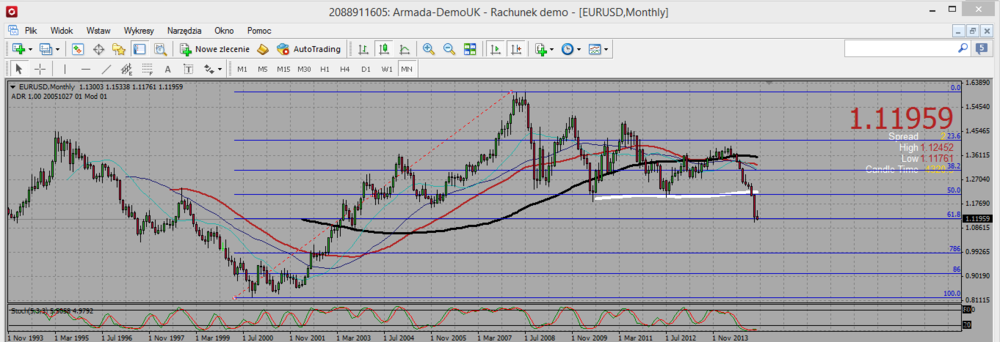
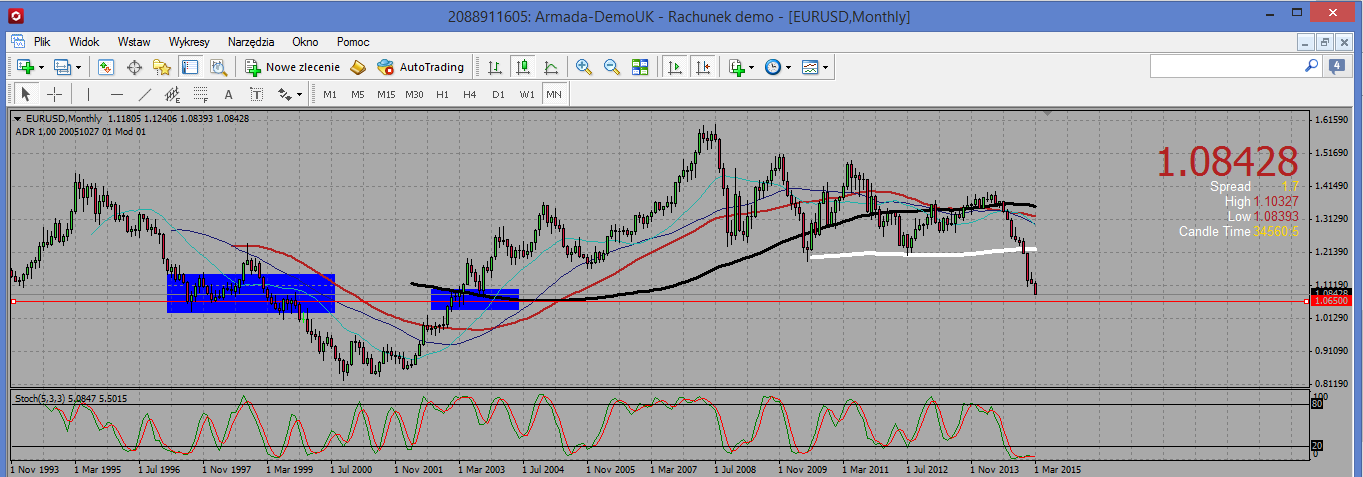
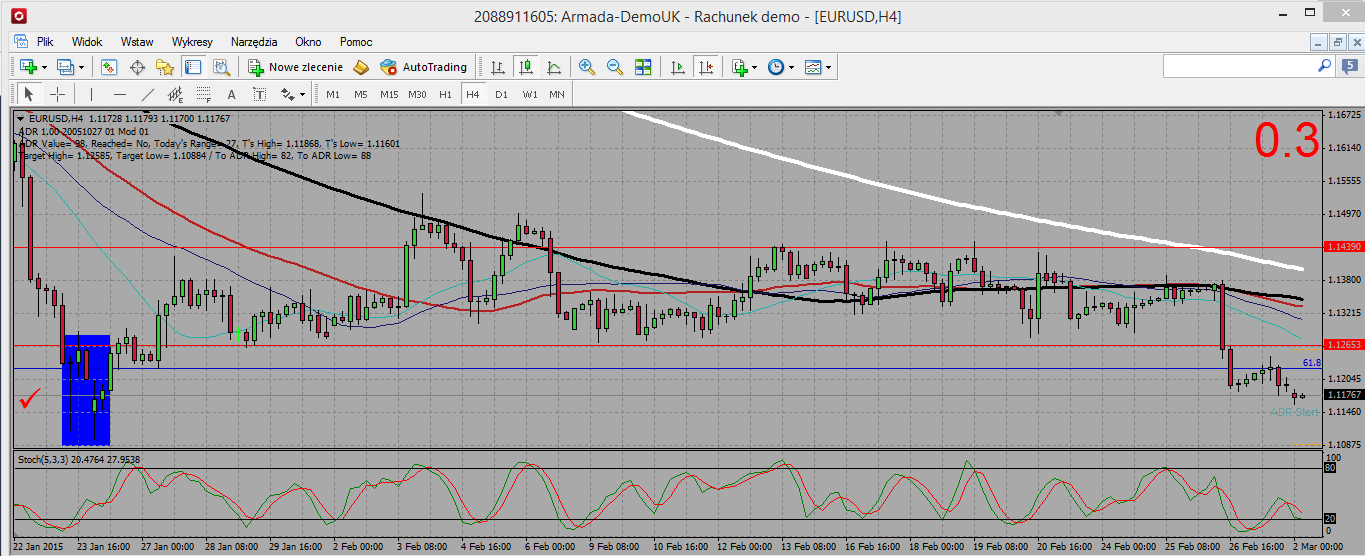
Look at EU now. Everybody is short on short time frames. But from a higher perspective we may actually have a turning point at current level , for we are sitting at a monthly fib level.
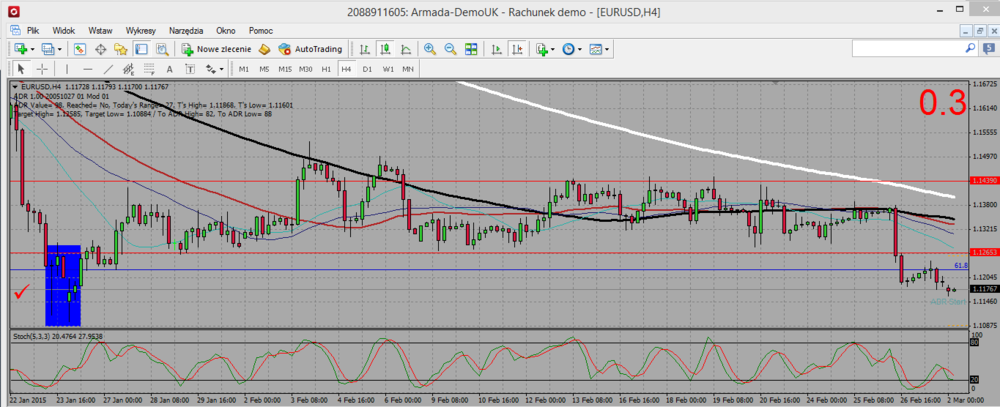
On H4 you see also (right part of chart, that 1,11 is a support)
Therefore, I will be bearish too, but should I got a long signal around 1,1 I will buy because of the monthly chart. And this is how I spot eventually turning points.
-
Opened A small SHORT position Just before close at 1.1847, Seeing this going DOWN to 1.10908 then UPI think it may go up too. it is just too obvious you have to be short on that one, and we got a break out from the monthly that has not been retested yet.
-
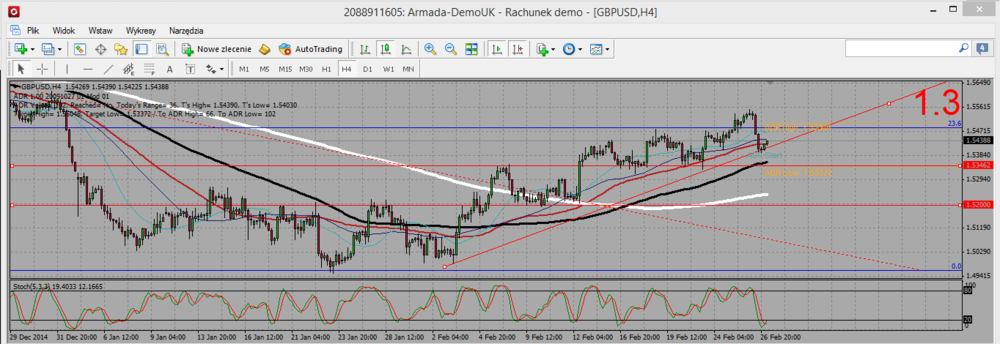
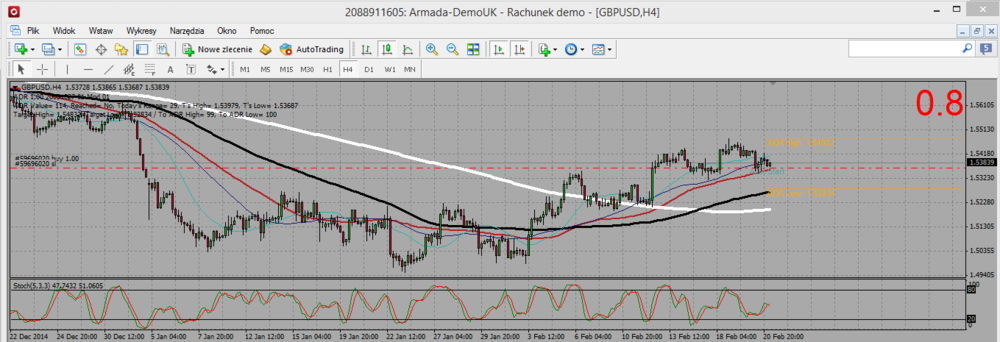
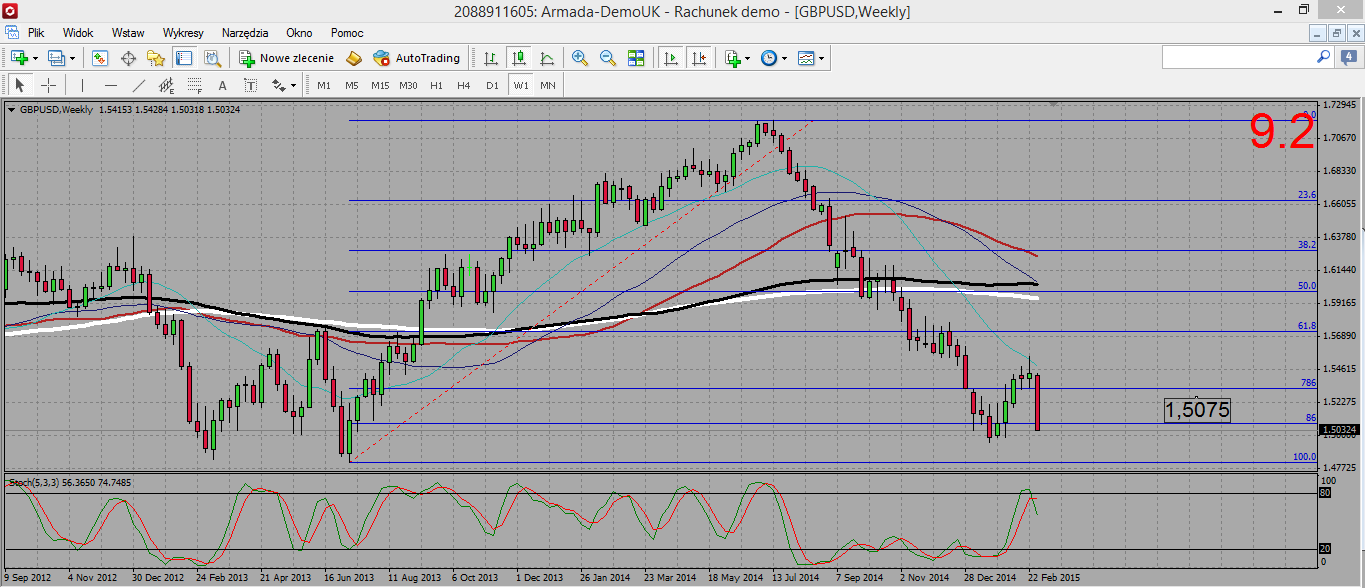
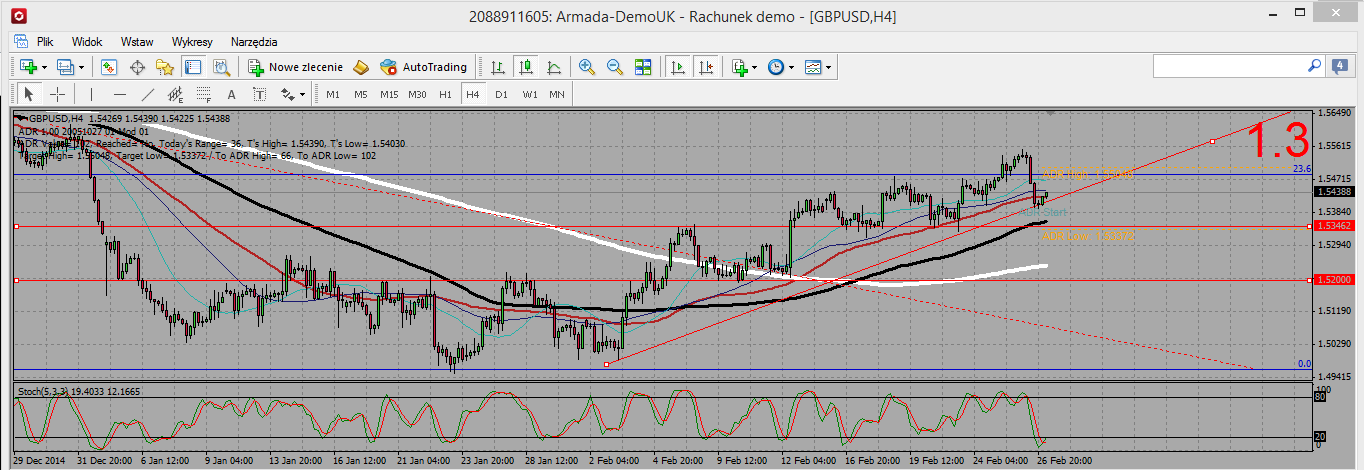
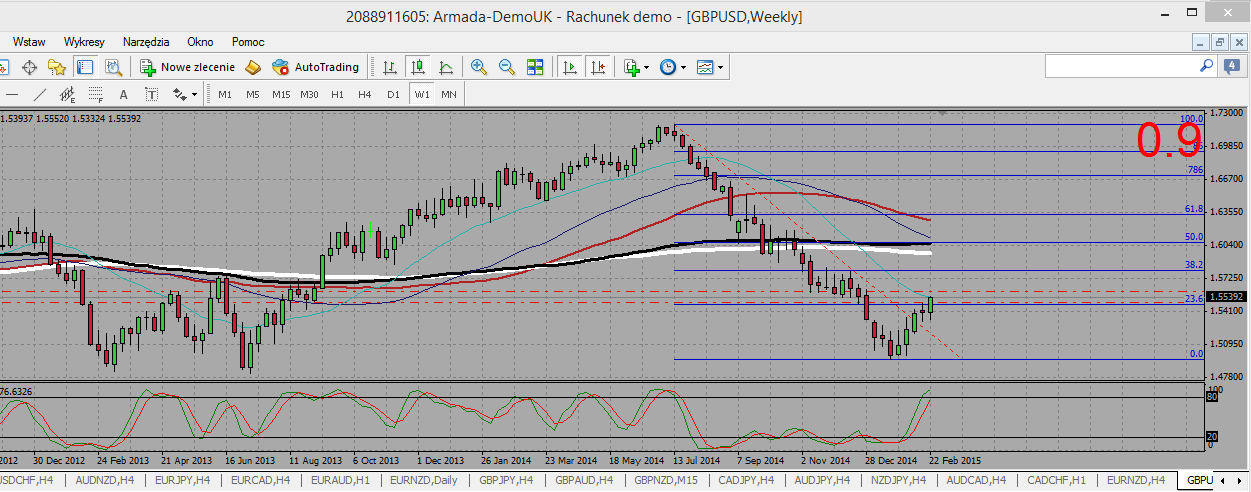
I ma not sure. On the daily I see we are approaching a resistance zone, so I think we may consolidate at that level. I will rather try to take profits, and may be to sell around1,56, aiming to get back to the fib broken resistance at 1,544.Well We did not even meet 1,56 before it reversed so I did not have the occasion to sell: the pair did not pass the daily SMA100. On H4 please take note that we are still technically in an uptrend, as long as we do not break the 1,535 last low's line.
Still the fib line named 23,6 is a strong weekly support/resistance zone. I would look for signals (short or long) there. A bearish break out oof 1,535 would make me bearish on h4.
-
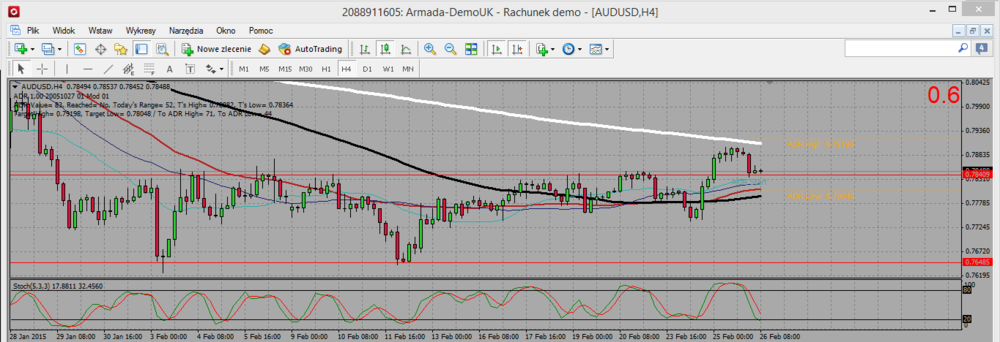
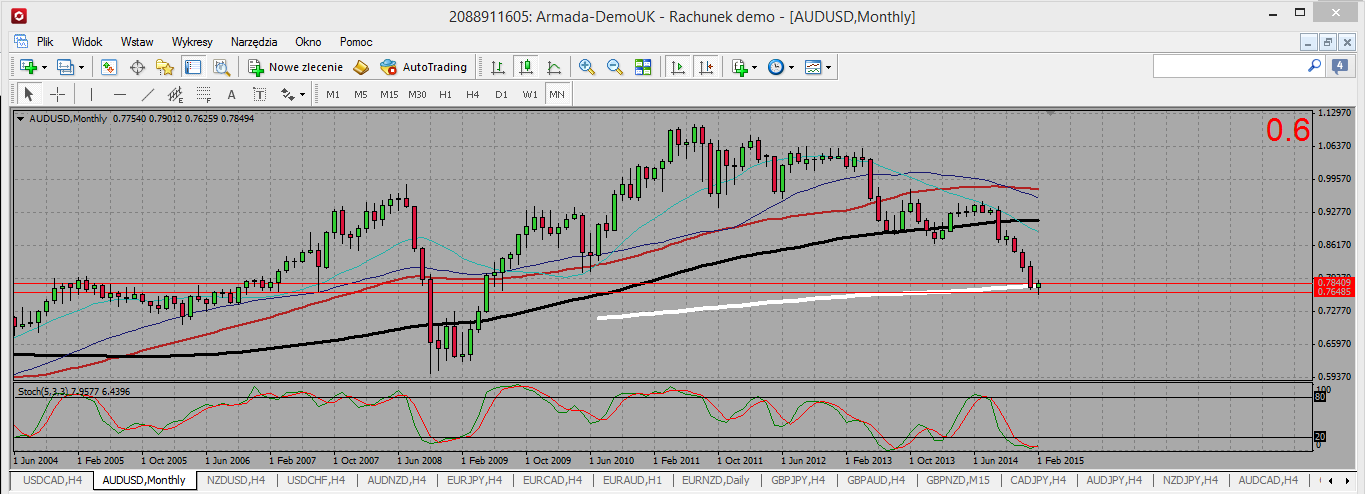
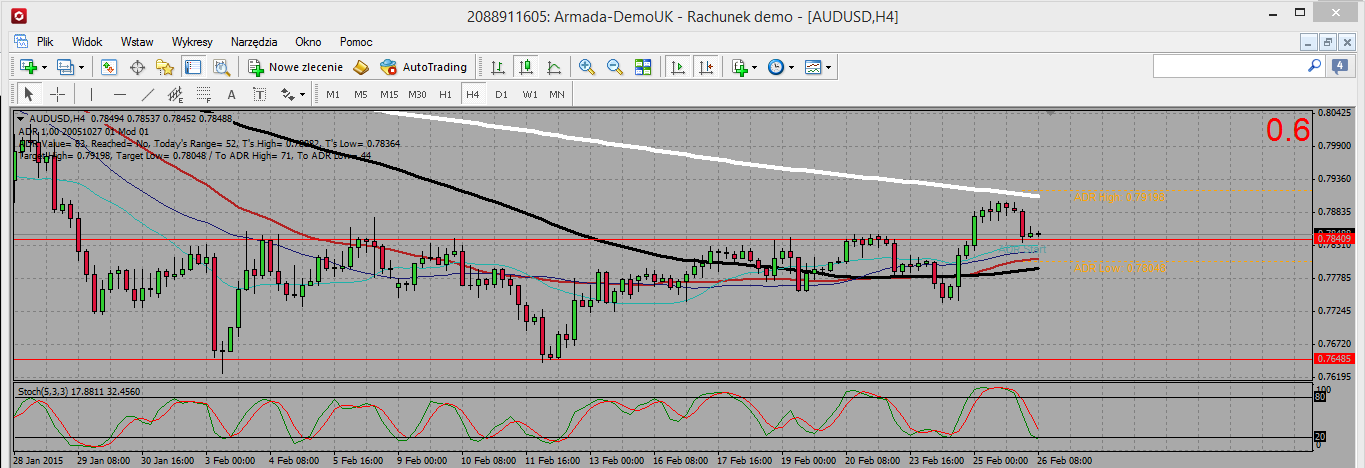
Now that AUD/USD has fallen below 80 cents and below the 61.8% Fibonacci retracement of the 2008 to 2012 rally, the next stop for the currency pair should be the 2007 swing low of 0.7675. As long as AUD/USD remains below 0.8050, the downtrend remains intact.Yes, on the long term. But on the monthly you see it is retesting SMa200, we are nearly at the end of the month, and that candle looks more and more as a hammer.
Then on the H4 we just broke a range resistance, even though the pair failed to cross the SMA200. SO yes I remain bearish long term, but I think we may first do a little consolidation (to ,8 ? to the 61,8 fib?)

-
I'll wait little longer until it's clear breaks around 1.54390. considering as major trend, it's could be simply a correction movement, based on their weekly wave.I ma not sure. On the daily I see we are approaching a resistance zone, so I think we may consolidate at that level. I will rather try to take profits, and may be to sell around1,56, aiming to get back to the fib broken resistance at 1,544.

-
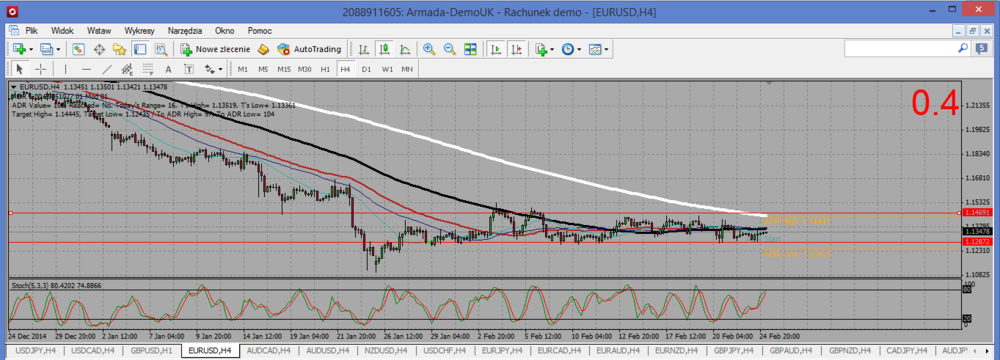
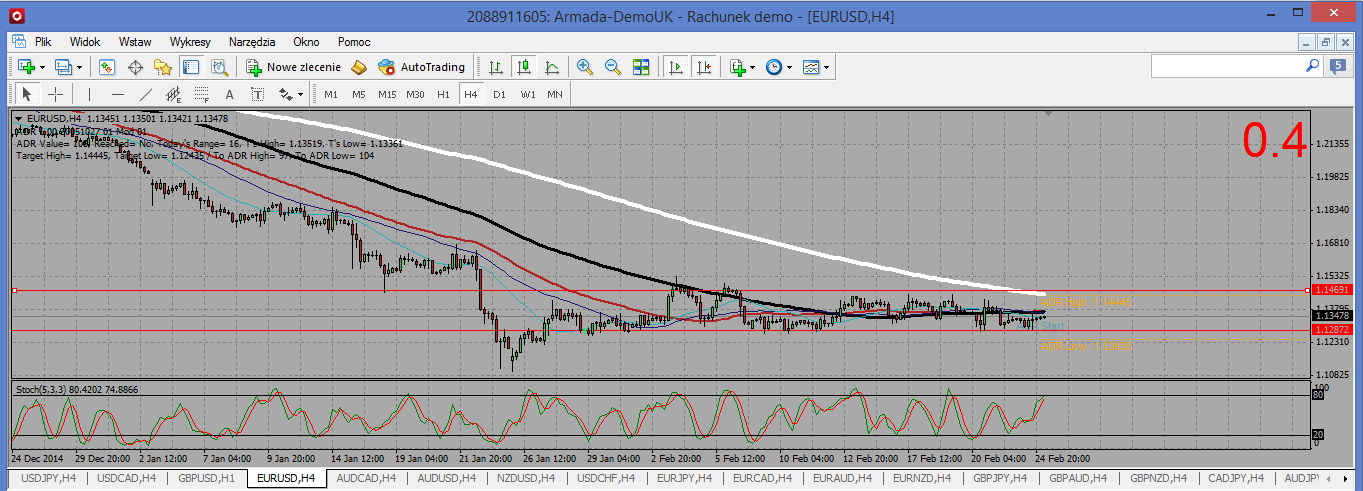
EUR/USD – Time for a BreakoutTaking look at the daily chart, the consolidative triangle pattern is clear. If the EUR/USD breaks the top of the triangle, the next stop should be 1.1645, a former support turned resistance level. If it breaks the downside and takes out 1.1275, the next area of support is at the 11 year low of 1.11.
Definitely consolidating. For me it is a range and not a triangle,but this i secondary. Ths point is to wait for the pair to exit the consolidation figure.
-
Won't be at all surprised to see it pop up another 100 pips or so and take out last weeks high and a bunch of stops.So do I.On H4 it looks like a clear trend reversal. I wold prefer to go long on that one.
-
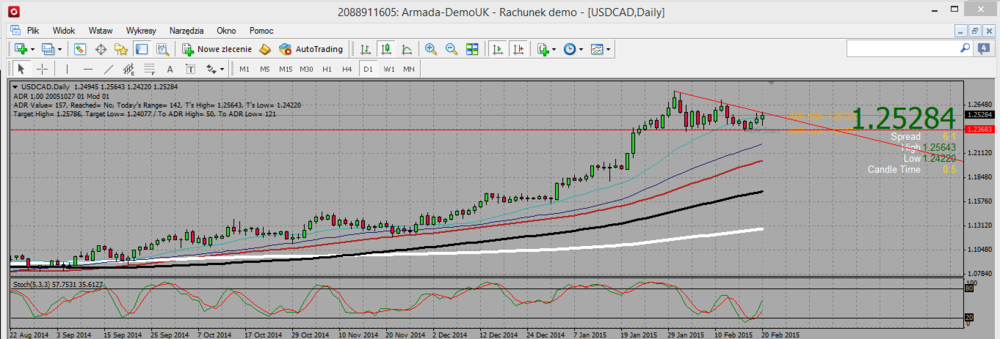
USD/CAD has formed a clear triple top with lower highs suggesting that upward momentum is no longer there. The 1.2800 level remains the operative resistance to the topside while 1.2000 is most immediate near term support.Yes, on the daily it is in a consolidation triangle, but my support is a little bit higher around 1,236. And as it is as triangle, my resistance trend line is decreasing. But yes, the upward momentum is gone for now.
-
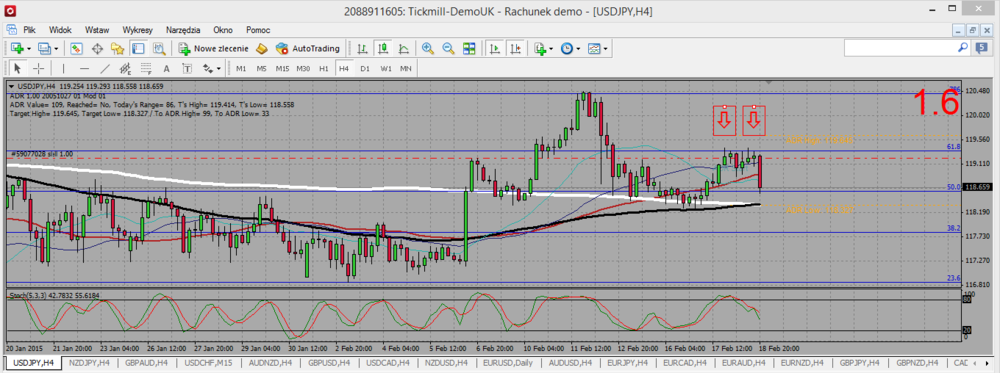
The next big meeting is in March so there’s no need to rush any changes. If we are right and the Fed provides no fresh insight at this week’s meeting, their tightening bias will make the dollar more attractive and drive USD/JPY higher.Technically, there is short-term support at 117.15 and more significant support at 115.57. The 61.8% Fibonacci retracement of the 1998 to 2011 decline at 120.18 will cap gains for the time being.
Right, but 119 is also very strong support/resistance level. I took short when I got a H4 double top at 119,2, for since two or three days I saw no real bullish pressure on UJ. So far so good. Please pay attention that several yen crosses pairs arealso entering resistance area. If they start going south, that will be additional buying pressure on the JPY.
Currently (2015 02 19 5 09 AM GMT) the pair is rebounding up on both H4 SMA100 and 200 at 1118,36. If you are confident in the uptrend, nice place to enter long. If you are confident.
-
Does predatory activity happen in the market all the time? Does a predatory mindset help in trading?I think that adapting a mentality of being ruthless, predatory, opportunistic and stalking your "prey" may help some people be more successful at trading. I get the impression that some traders take on this mentality, and this point of view as a strategy to put themselves into a mental state that helps them to be more objective and disciplined in their trading.
I'm not saying it doesn't work. And I'm not saying that I wouldn't, sort of, engage in those things myself when trading. I guess I would practice opportunistic and "predatory" strategies in the sense that it will make a profit.
Is this view of trading good in the long term? Can it affect your life outside of trading? Is it morally right or wrong?
Personally, I have a mixture of feelings about the whole investment industry, how it works, who it benefits, and what the implications are for the predators and the victims.
But let's hear what you have to say.
I remember someone advising me to trade as a crocodile, meaning a predator will wait for a sure catch and will not try to run everytime a protential prey is around. Spare your strength (account) because it costs everytime you use it.
-
My last trading day of the year depends on how good the business is in that year. If my balance sheet allows me,I take my break as early as 1st December otherwise I work up to 20th December.Same for me except I am on break starting December 15th. I also do not trade in August and the first week of September.
And I usually -not always- do not trade during NFP's Fridays.
-
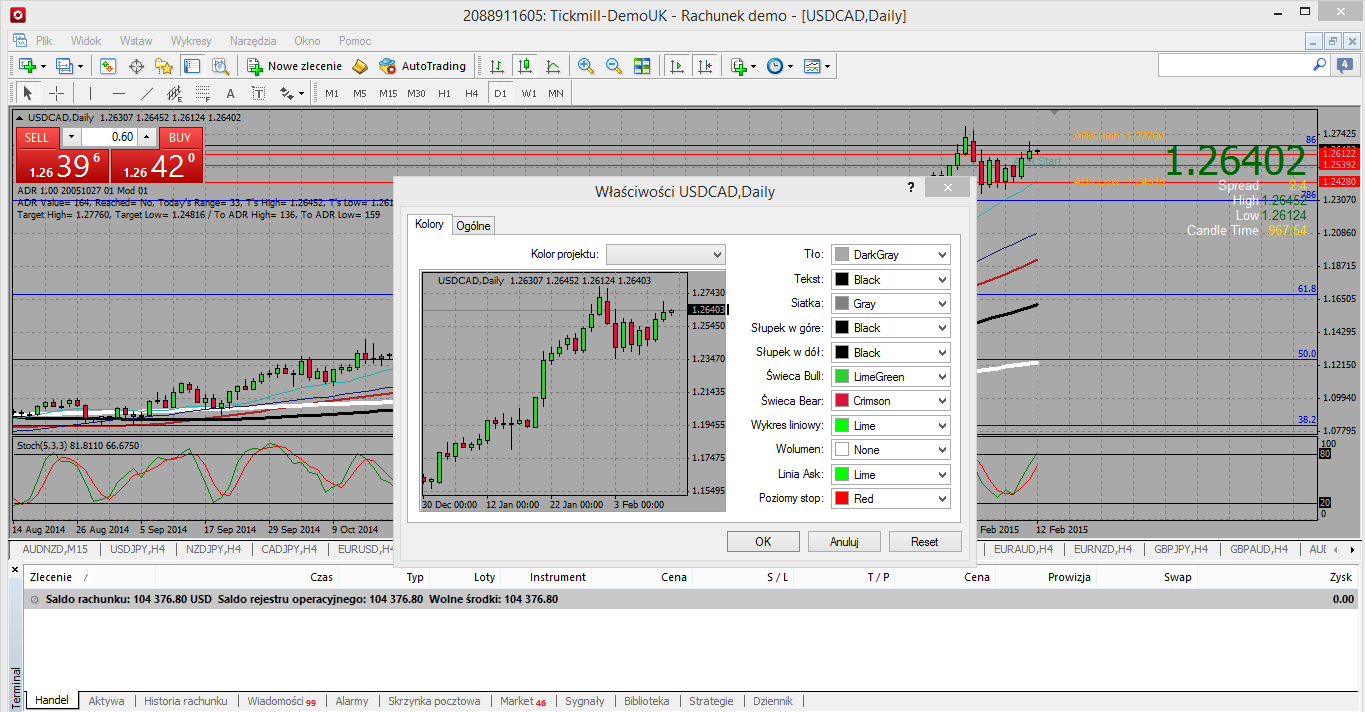
Hi Toksy,
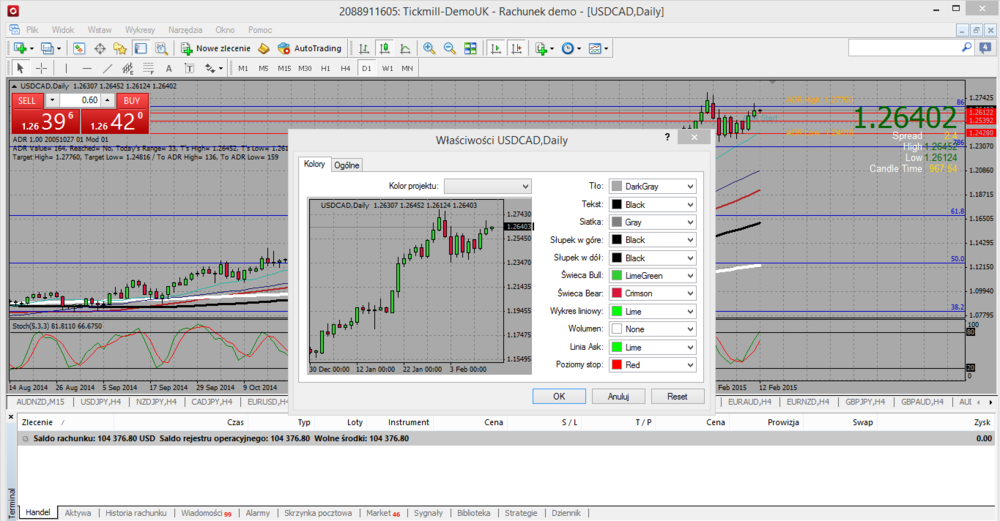
On Mt4, it is up to you to decide which colour you choose for your bullish/bearish bar.
Mine are green for bulls (up) and red for bears (down)
On your chart, right click the mouse then go for the lowest entries (properties). You will be able to change all your colours, not only the bull. (see enclosed image, unfortunately in Polish !)
So basically what is the colour of the u bar and down bar is to be deducted ftom the chat. Is it not hard.
-
Trading without a stop loss is like driving without stopping at traffic lights. It may go faster, but you tremendously increase your chance of getting killed. :doh:
-
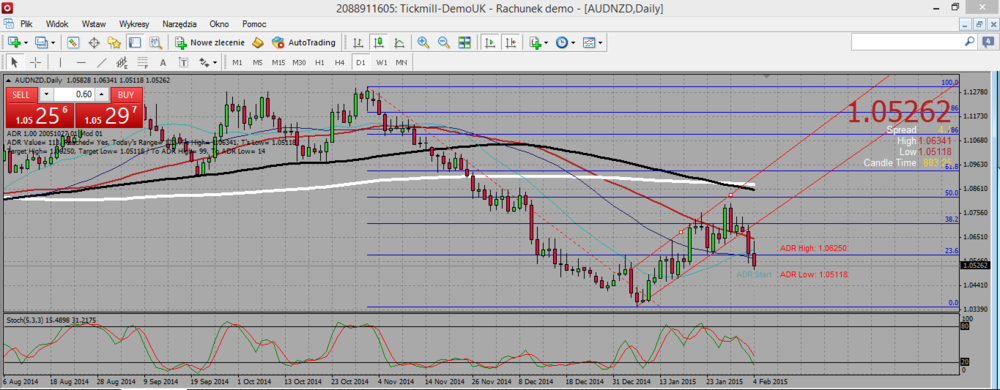
Yesterday AUD/NZD broke down a bearish flag with a 1000 pips pole. As it is very close to its all time low already, another 1000 pips bearish move (which is the move you should expect according to Murphy technical analysis bible ) would bring it to a historical all time low.
So in case I do have a bearish signal on that pair, may be on a retest of the broken flag, I will let a tiny part of the trade open even if I hit my TP. Just in case . :missy:


AUDUSD Discussions
in Forex
Posted
Ok I made a video of my trading plan on AUSDUSD trading plan (2015 03 09)